NF-L Quantification in the TDP-43ΔNLS Mouse Model of ALS
Neurofilament Light (NfL) in Plasma & CSF from Animal Models
Global CRO trusted by research teams around the world to perform ultrasensitive neurofilament light analysis.
Validated mouse NfL and rat NfL biomarker analysis services for plasma and CSF samples.
Biospective has industry-leading expertise in analysis of neurofilament light chain (NfL) concentrations from blood (plasma and serum) and cerebrospinal fluid (CSF) samples from mice, rats, and other research animal models. We utilize ultrasensitive assays to measure low concentrations of this clinically translational fluid biomarker of neurodegeneration and axonal injury from small volume samples (e.g. <10 µL of CSF).
Explore this Service:
- What Services does Biospective offer for Neurofilament Light Chain (NfL) Analysis?
- What Different Sample Types are Supported for Neurofilament Light Chain (NfL) Assays?
- What is Neurofilament Light Chain (NfL)?
- How is Neurofilament Light Chain (NfL) Measured in Blood & CSF?
- What is the Value of Measuring Neurofilament Light Chain (NfL) in Animal Models?
What Services does Biospective offer for Neurofilament Light Chain (NfL) Analysis?
Biospective’s neurofilament light chain assay service (NfL, also written as NF-L or NF-Light) delivers ultrasensitive, quantitative biomarker testing for translational research and preclinical studies, with validated measurement of blood neurofilament light (plasma NfL, serum NfL) and CSF NfL from mice & rats. Neurofilament light chain is a neuron-specific cytoskeletal protein released into biofluids following axonal injury or neurodegeneration, making it a highly relevant biomarker of neuronal damage and therapeutic effect. Our mouse NfL and rat NfL assay services combine rigorous analytical performance with flexible study support to help researchers generate accurate, reproducible data that informs disease progression, drug efficacy, and mechanistic insights across neurological and neurodegenerative disease models.
Certified Ella™ Service Provider
Biospective is a Bio‑Techne®–certified service provider for the Ella™ automated immunoassay platform, ensuring validated workflows, reproducible performance, and high‑quality biomarker data.
What Different Sample Types are Supported for Neurofilament Light Chain (NfL) Assays?
Sample Types Supported
Our neurofilament light chain (NfL) biomarker quantification services support ultra-sensitive NfL measurement in multiple biofluids and biological matrices, allowing flexibility in experimental design across in vivo and in vitro models:
Blood (Plasma, Serum)
- Minimally invasive, ideal for longitudinal studies
- Clinically accessible and translationally relevant
Cerebrospinal Fluid (CSF)
- Gold-standard for central nervous system (CNS) biomarker analysis
- Directly reflects neurodegeneration and neuronal/axonal injury
Sample Collection, Preparation, and Shipping Guidelines
As part of our neurofilament light chain (NfL) assay service, we provide comprehensive support to ensure sample integrity and data reliability.
- Sample Collection: Samples for blood and CSF NfL testing should be collected using standard aseptic techniques.
- Sample Preparation: Samples for blood and CSF NfL testing should be centrifuged, aliquoted, and frozen at -80°C.
- Sample Shipping: Samples should be shipped on dry ice using insulated containers, avoiding repeated freeze-thaw cycles.
Neurofilament light chain (NfL) is released from injured/damaged axons into the extracellular space and subsequently can be detected in CSF and blood.
What is Neurofilament Light Chain (NfL)?
NfL (or NF-L) is a key structural protein within neuronal axons, forming part of the neurofilament triplet (NfL, NfM, and NfH). Axonal damage or injury from disease, trauma, or toxicity leads to NfL release into CSF and blood, where it can be measured as a quantitative & non-invasive biomarker of neuronal integrity.
Why Measure NF-L?
- Non-invasive biomarker of neuronal damage
- Tracks disease progression and therapeutic efficacy
- Applicable across multiple neurological and neurodegenerative diseases and conditions, including:
- Amyotrophic Lateral Sclerosis (ALS)
- Multiple Sclerosis (MS)
- Alzheimer's Disease
- Parkinson's Disease
- Tauopathies (FTD, Progressive Supranuclear Palsy, Corticobasal Degeneration)
- Huntington's Disease
- Spinocerebellar Ataxias
- Traumatic Brain Injury (TBI) & Concussion
Explore how NfL, the ultrasensitive neurofilament immunoassay, and key rodent models - including EAE and rNLS8 TDP-43ΔNLS - are used to study neurodegeneration, monitor disease progression, and evaluate potential therapies. This video provides a clear overview of each tool and its translational relevance for preclinical research.
 Click to copy link
How is Neurofilament Light Chain (NfL) Measured in Blood & CSF?
Advanced NfL immunoassays, such as Ella™ (Simple Plex™, ProteinSimple™, Bio-Techne®), MSD neurofilament light (Meso Scale Discovery), and NfL Simoa® (Quanterix) enable detection of NF-Light in diverse biological matrices with high accuracy and precision.
Comparison of Commonly Used Platforms for NfL Analysis
|
Feature |
Ella™ |
MSD |
Simoa® |
|
Assay Type |
Microfluidic immunoassay |
Electrochemiluminescence (ECL) immunoassay |
Digital ELISA (single molecule array) |
|
Time to Results |
~90 minutes |
4 - 6 hours |
3 - 4 hours |
|
Automation |
Fully-automated |
Semi-automated |
Fully-automated |
|
Sample Types |
Plasma |
Plasma |
Plasma |
|
Throughput / Format |
Up to 72 samples/run |
Up to 40 samples/run |
Up to 40 samples/run |
This table compares three NfL assay platforms - Bio-Techne Ella™ NF-Light, MSD NfL, and Quanterix NfL (Simoa®) - across key criteria, including assay type, time to results, level of automation, supported sample types, and throughput per run.
What is the Value of Measuring Neurofilament Light Chain (NfL) in Animal Models?
Preclinical Applications
Neurofilament light (NfL) is widely used in animal models to monitor neurodegeneration and/or axonal injury, disease progression, and therapeutic efficacy. Our validated platforms and experience enable robust NfL quantification across multiple model systems.
Multiple Sclerosis (MS) Models
In human MS, NfL is a sensitive and reliable biomarker for monitoring disease progression and treatment response (Ferreria-Atuesta, 2021). Elevated NfL levels indicate heightened relapse risk and disease activity, while effective disease-modifying therapies reduce NfL concentrations (Freedman, 2025).
EAE Model (Experimental Autoimmune Encephalomyelitis) of MS
Mimics autoimmune-mediated MS-like pathology, including:
- Neuroinflammation
- Peripheral inflammatory infiltrates
- Demyelination in white matter tracts
- Axonal injury/damage & axon degeneration
NfL serves as a quantitative biomarker of CNS demyelination and axonal injury.
For more on this model, see our Resources:
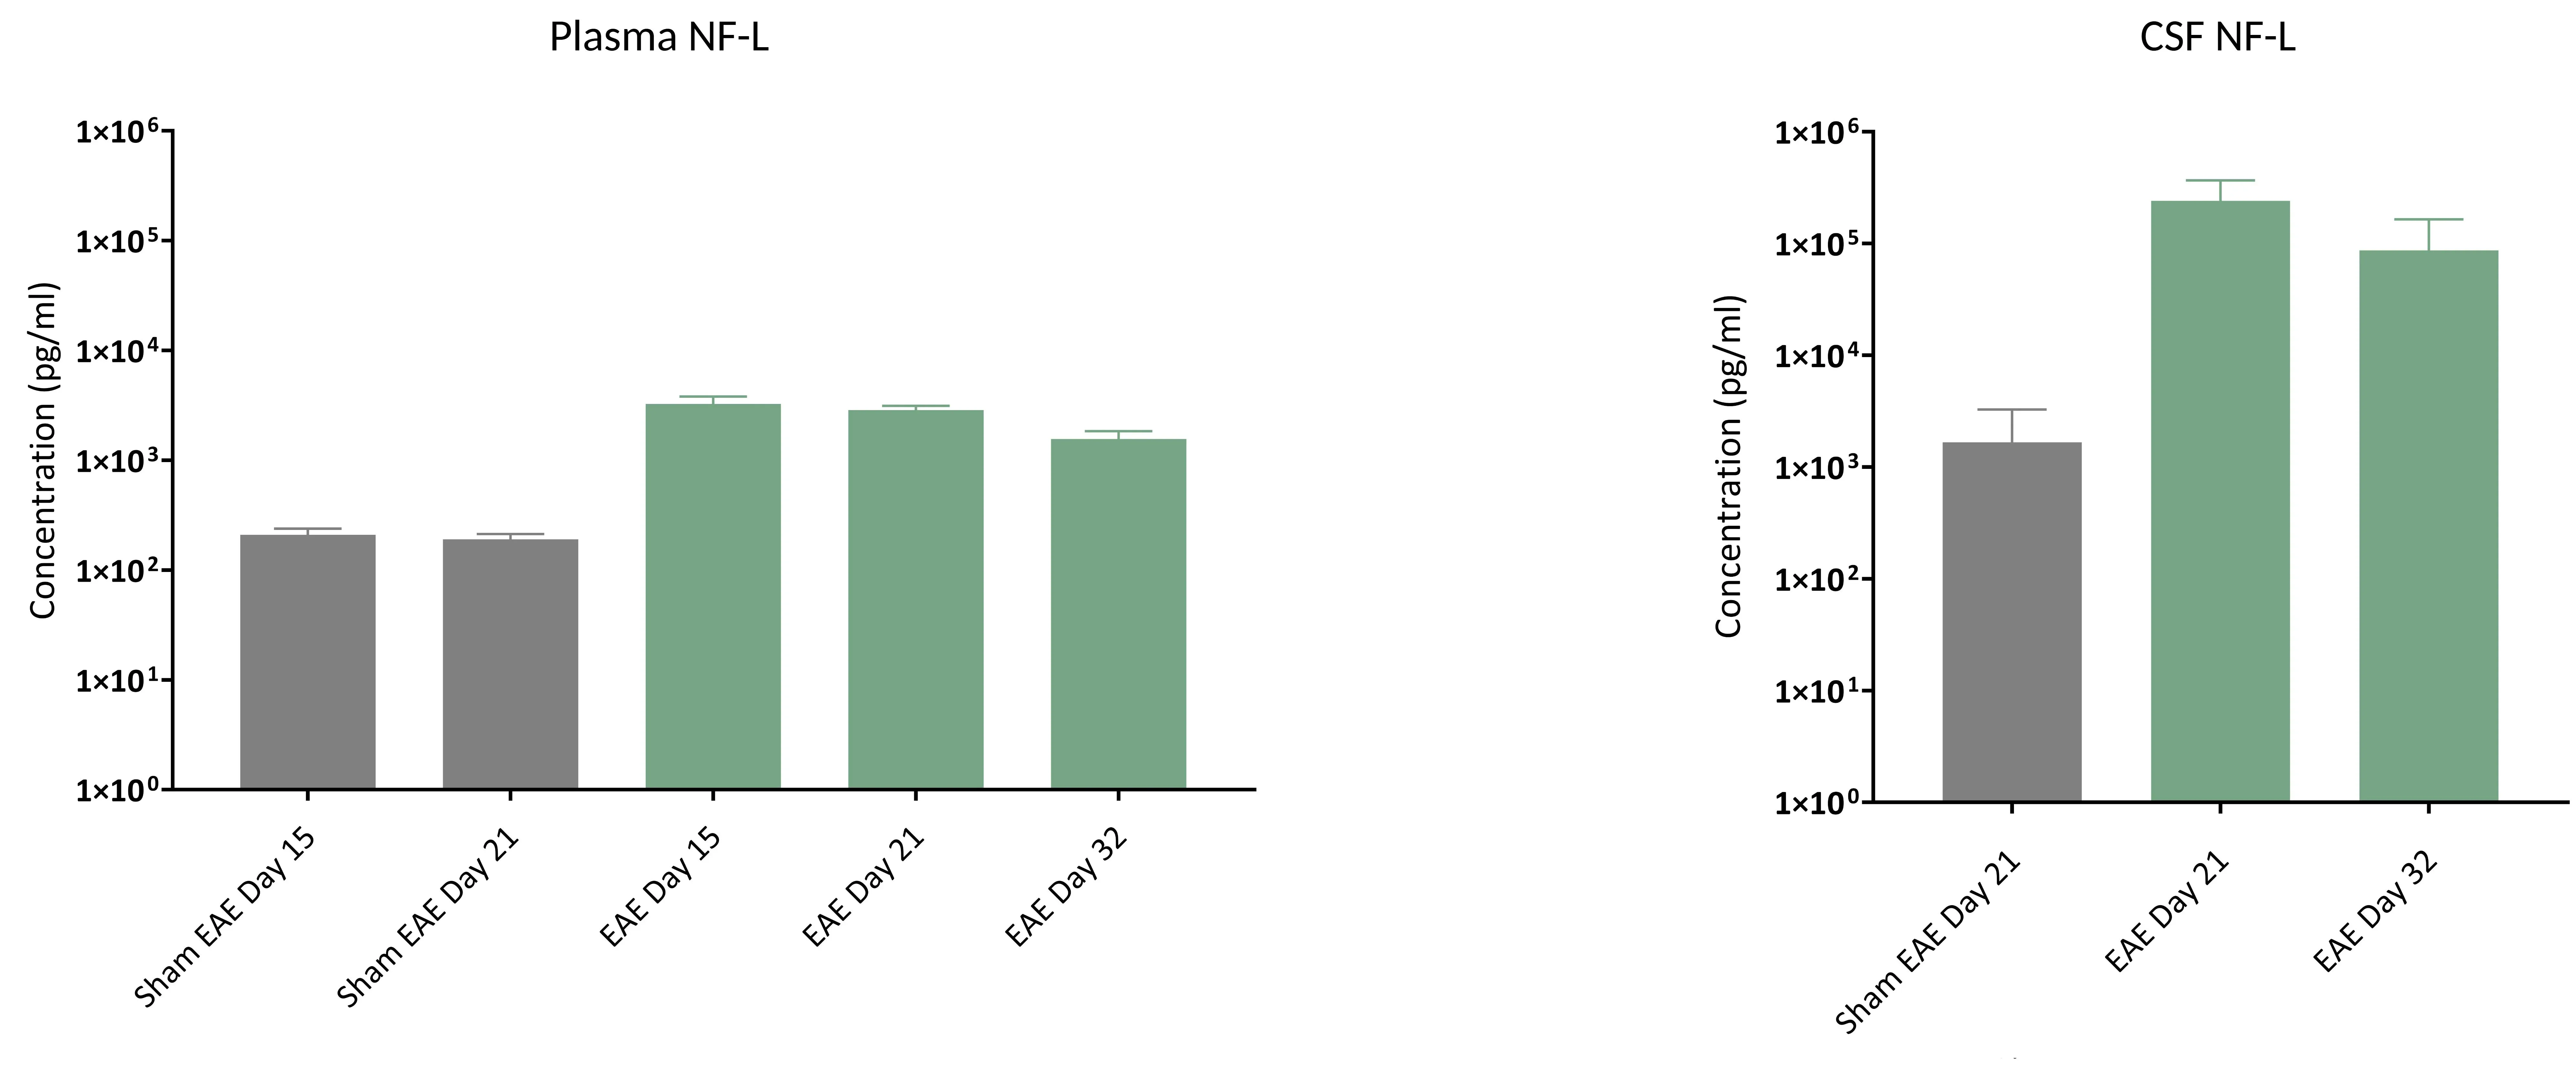
Plasma and CSF NfL data comparing EAE to Sham controls; mean ± SEM.
Amyotrophic Lateral Sclerosis (ALS) Models
NfL is an emerging biomarker of neuroaxonal damage in ALS. In patients, NfL concentrations are elevated in both CSF and blood, correlating with disease severity, rate of progression, and survival (Anjum, 2025). Beyond reflecting neuronal injury, NfL shows promise as a prognostic marker capable of distinguishing clinically relevant patient subgroups (Krishnamurthy, 2024).
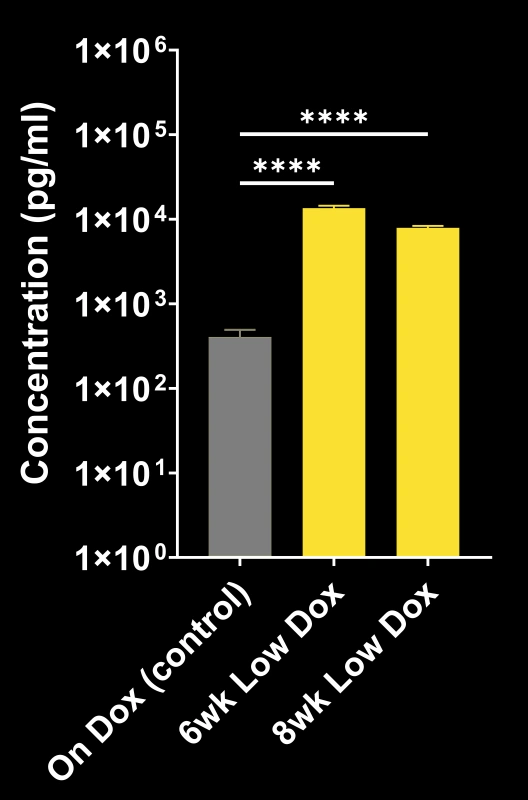
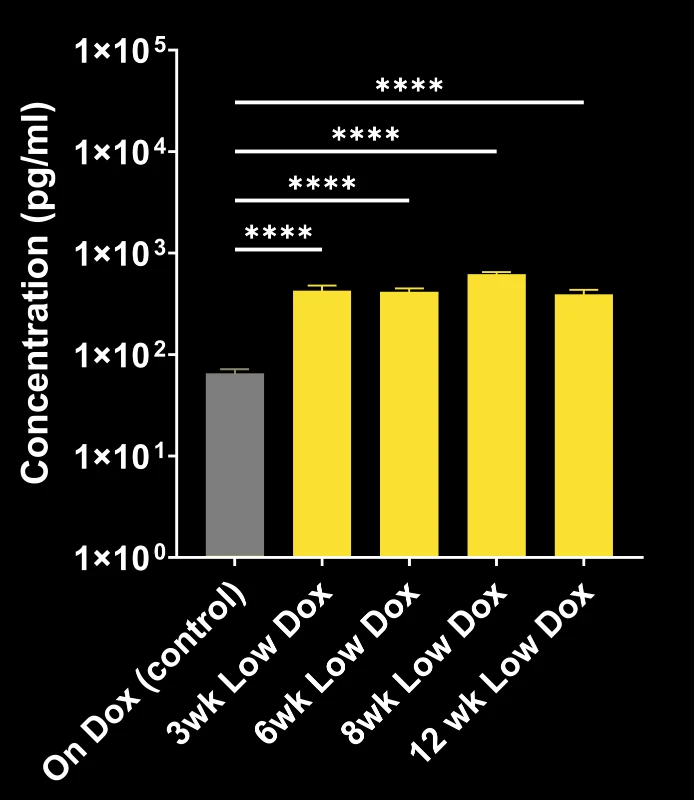
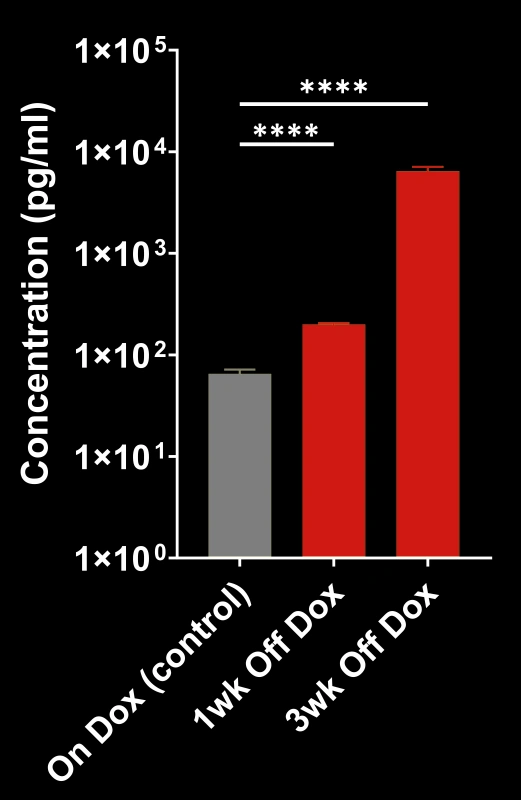
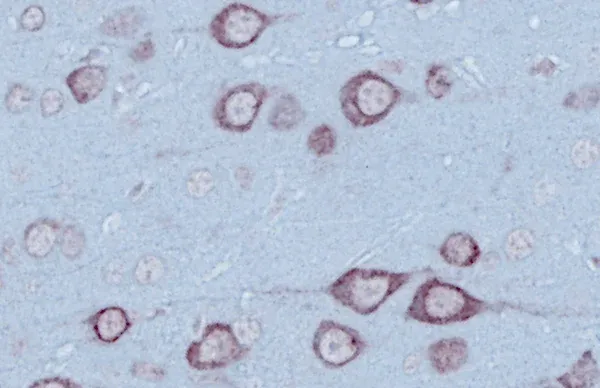
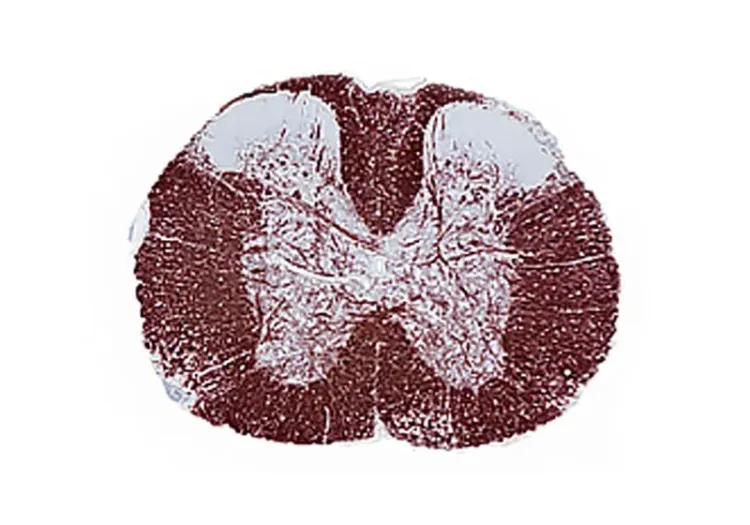
TDP-43ΔNLS (rNLS8) Model of ALS
At Biospective, we use both the original and modified versions of the rNLS8 ALS mouse model of TDP-43 proteinopathy.
- Original mouse model ("Off Dox"): rapidly progressing (weeks)
- Biospective's mouse model ("Low Dox"): slower progression (months)
TDP-43ΔNLS models exhibit progressive:
- Cytoplasmic TDP-43 mislocalization
- Motor deficits
- Motor neuron degeneration & regional brain atrophy
- Neuroinflammation
- Brain, spinal cord, and neuromuscular junction (NMJ) pathology
NfL quantification provides a non-invasive measure of disease progression and treatment response.
For more information, see our Resources:
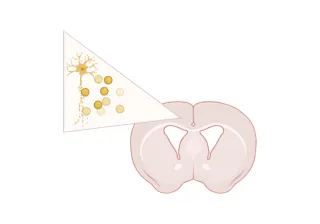
In the "Image Interactive" below, you can explore the relationship between increased NfL levels and pathologic changes shown on high-resolution Multiplex Immunofluorescence tissue sections from Biospective's “Low Dox” TDP-43ΔNLS (rNLS8) mouse model.
How to use Our Interactive Viewer
Navigate through the “Image Story” via the left-hand panel or the on-screen arrows. You can pan around high-resolution microscopy images with your mouse, and zoom in/out using the scroll wheel or the +/- controls. The Control Panel (top-right) allows toggling of image channels and segmentation overlays. For the best experience, we recommend switching to full-screen mode. This Interactive Presentation enables you to explore the model’s neuropathology and associated functional deficits in detail, as if looking directly down the microscope.


Increased NfL levels and pathologic changes shown on high-resolution Multiplex Immunofluorescence tissue sections from Biospective's “Low Dox” TDP-43ΔNLS (rNLS8) mouse model.
- Click to copy link
Parkinson's Disease Models
In PD patients, NfL concentrations are increased relative to healthy controls, and have been reported to correlate with clinical measures of disease severity and progression (Pilotto, 2021; Ou, 2024). Elevated NfL levels in CSF and blood have also been shown to differentiate PD from atypical parkinsonian syndromes (Angelopoulou, 2021; Buhmann, 2023).
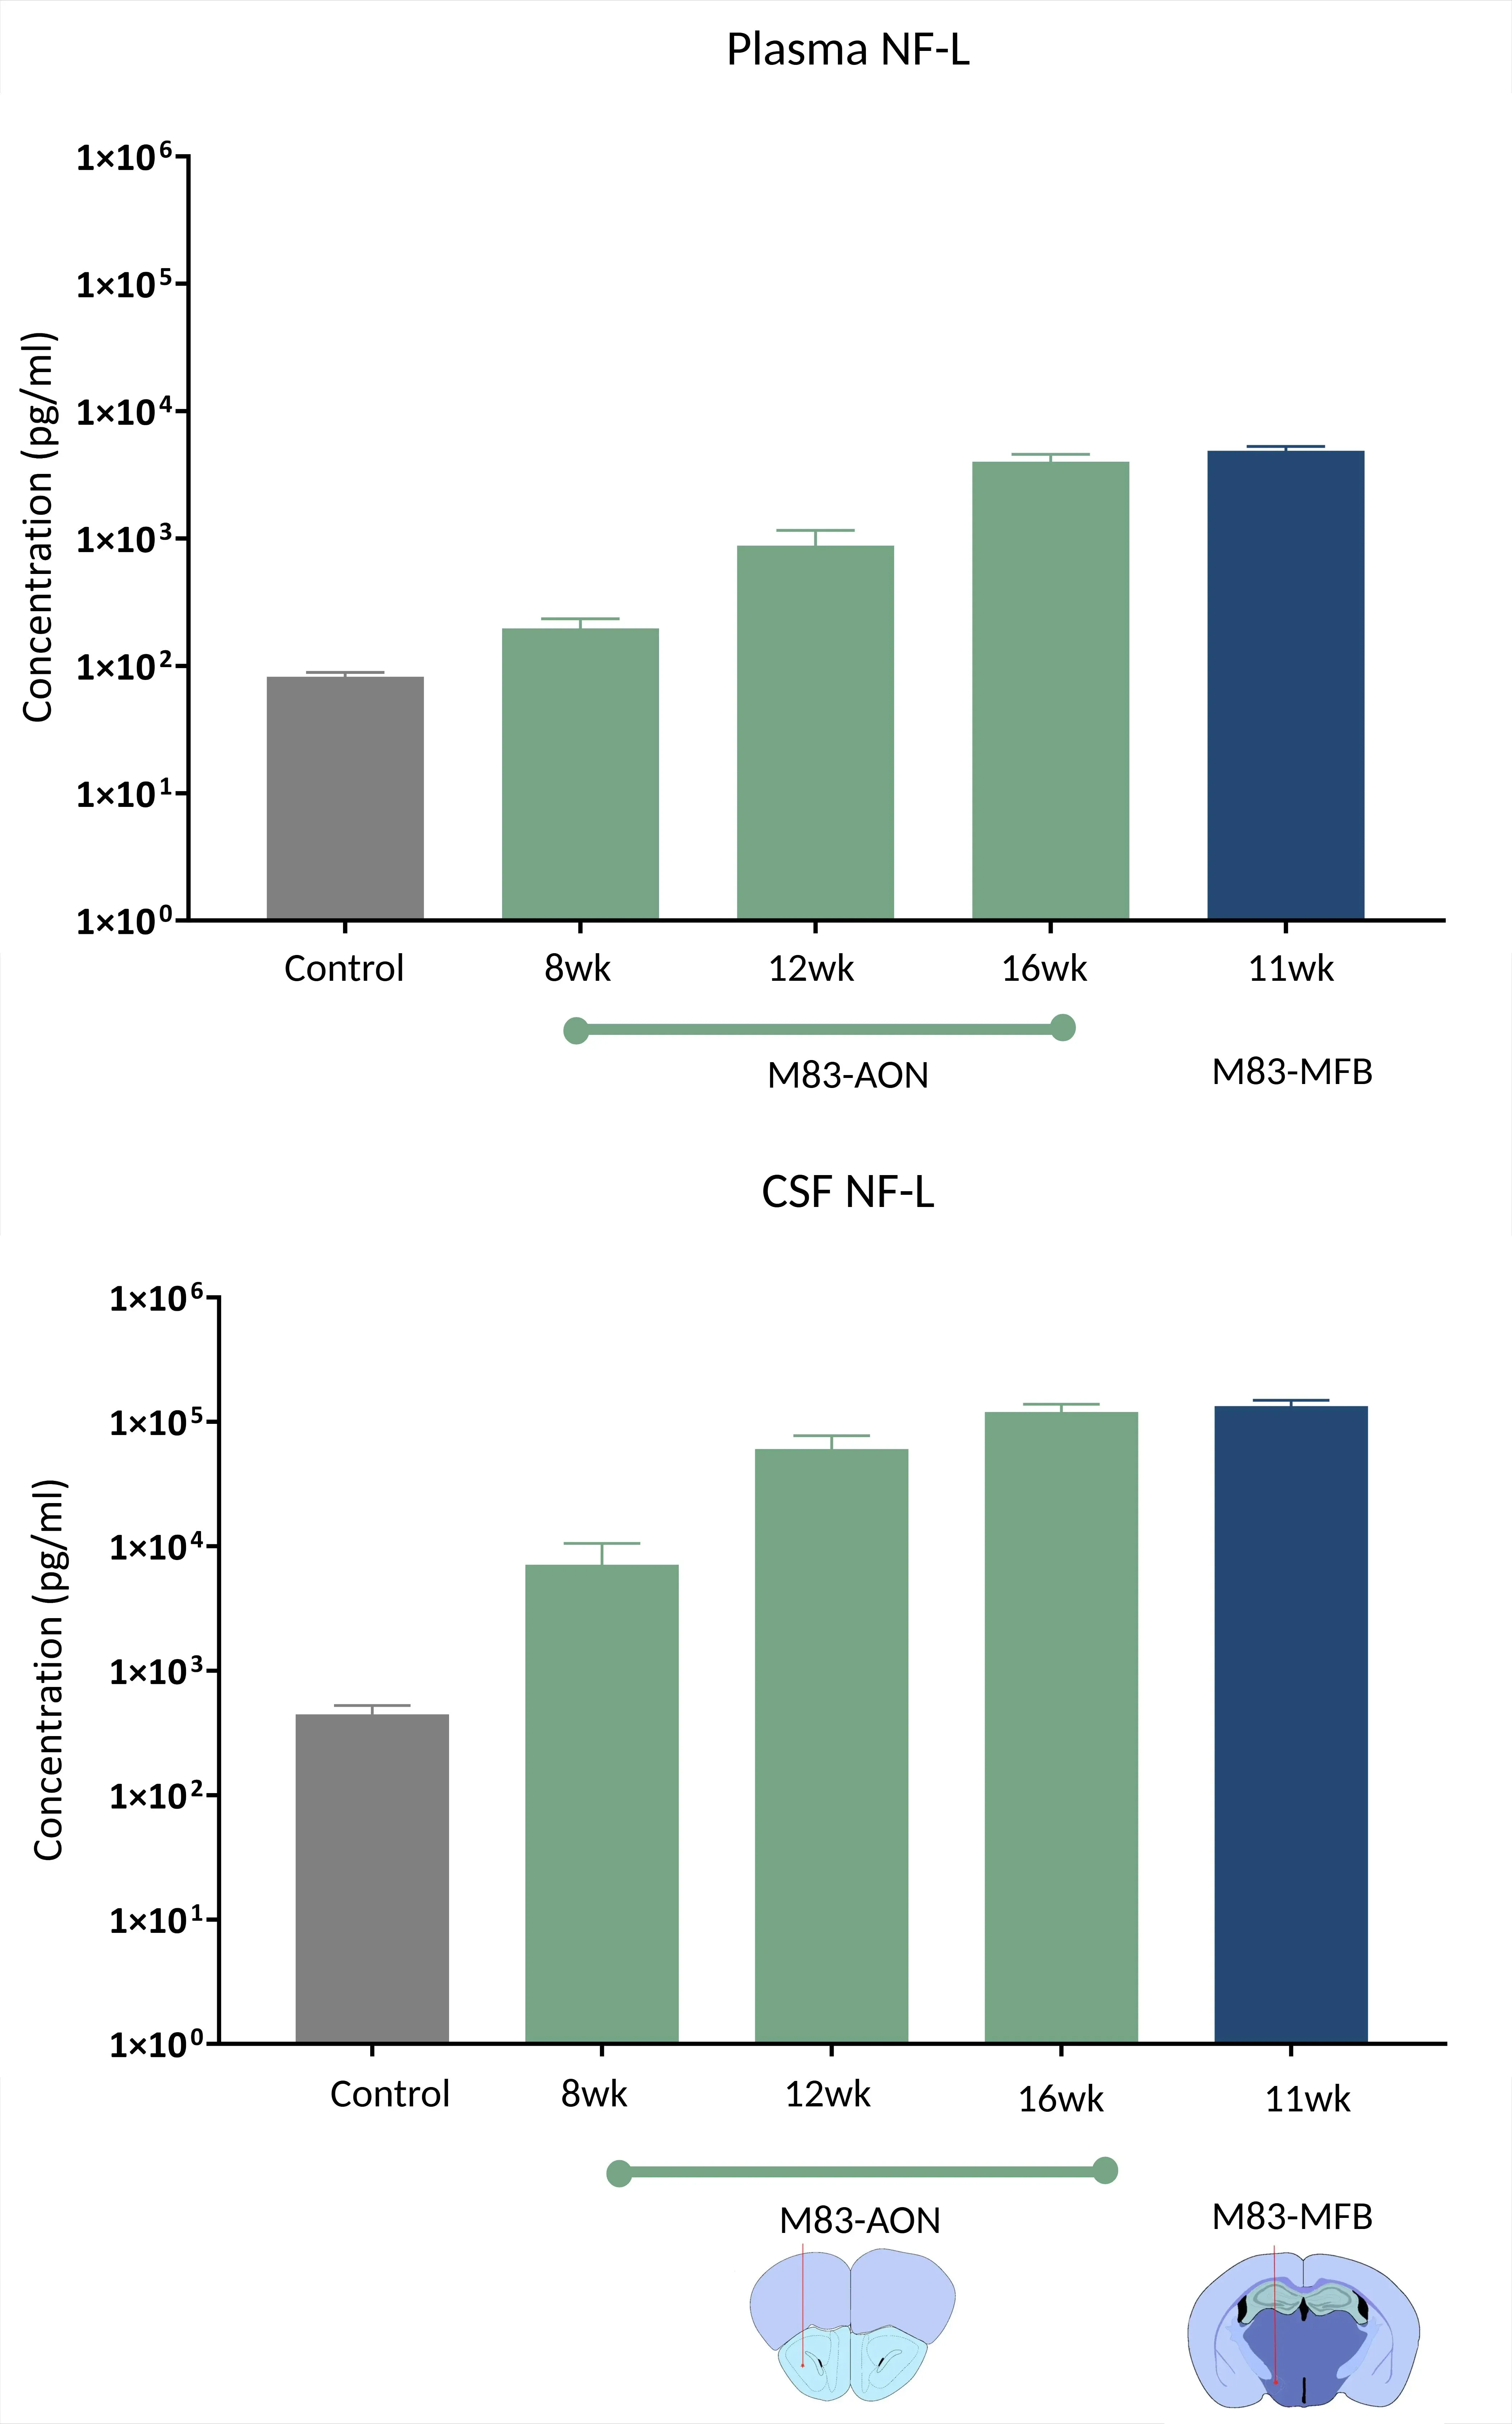
Plasma and CSF NfL levels in M83+/- transgenic mice injected with recombinant human α-syn PFFs into the AON or MFB, compared to controls; mean ± SEM.
α-Synuclein PFF Model of PD
The α-synuclein preformed fibril (PFF) model reproduces key aspects of Parkinson's disease pathology and progression, making it a widely used tool for studying neurodegeneration and testing therapeutic interventions.
Key features of the α-syn PFF model include:
- Seeding and spreading of α-synuclein aggregates in a well-defined spatiotemporal pattern
- Extensive α-synuclein pathology in neuronal cell bodies and neurites
- Neuroinflammation (microgliosis & astrogliosis) and neurodegeneration
NfL quantification in this model provides a readout of neurodegeneration.
For more details on NfL analysis in this model, see our Resource:
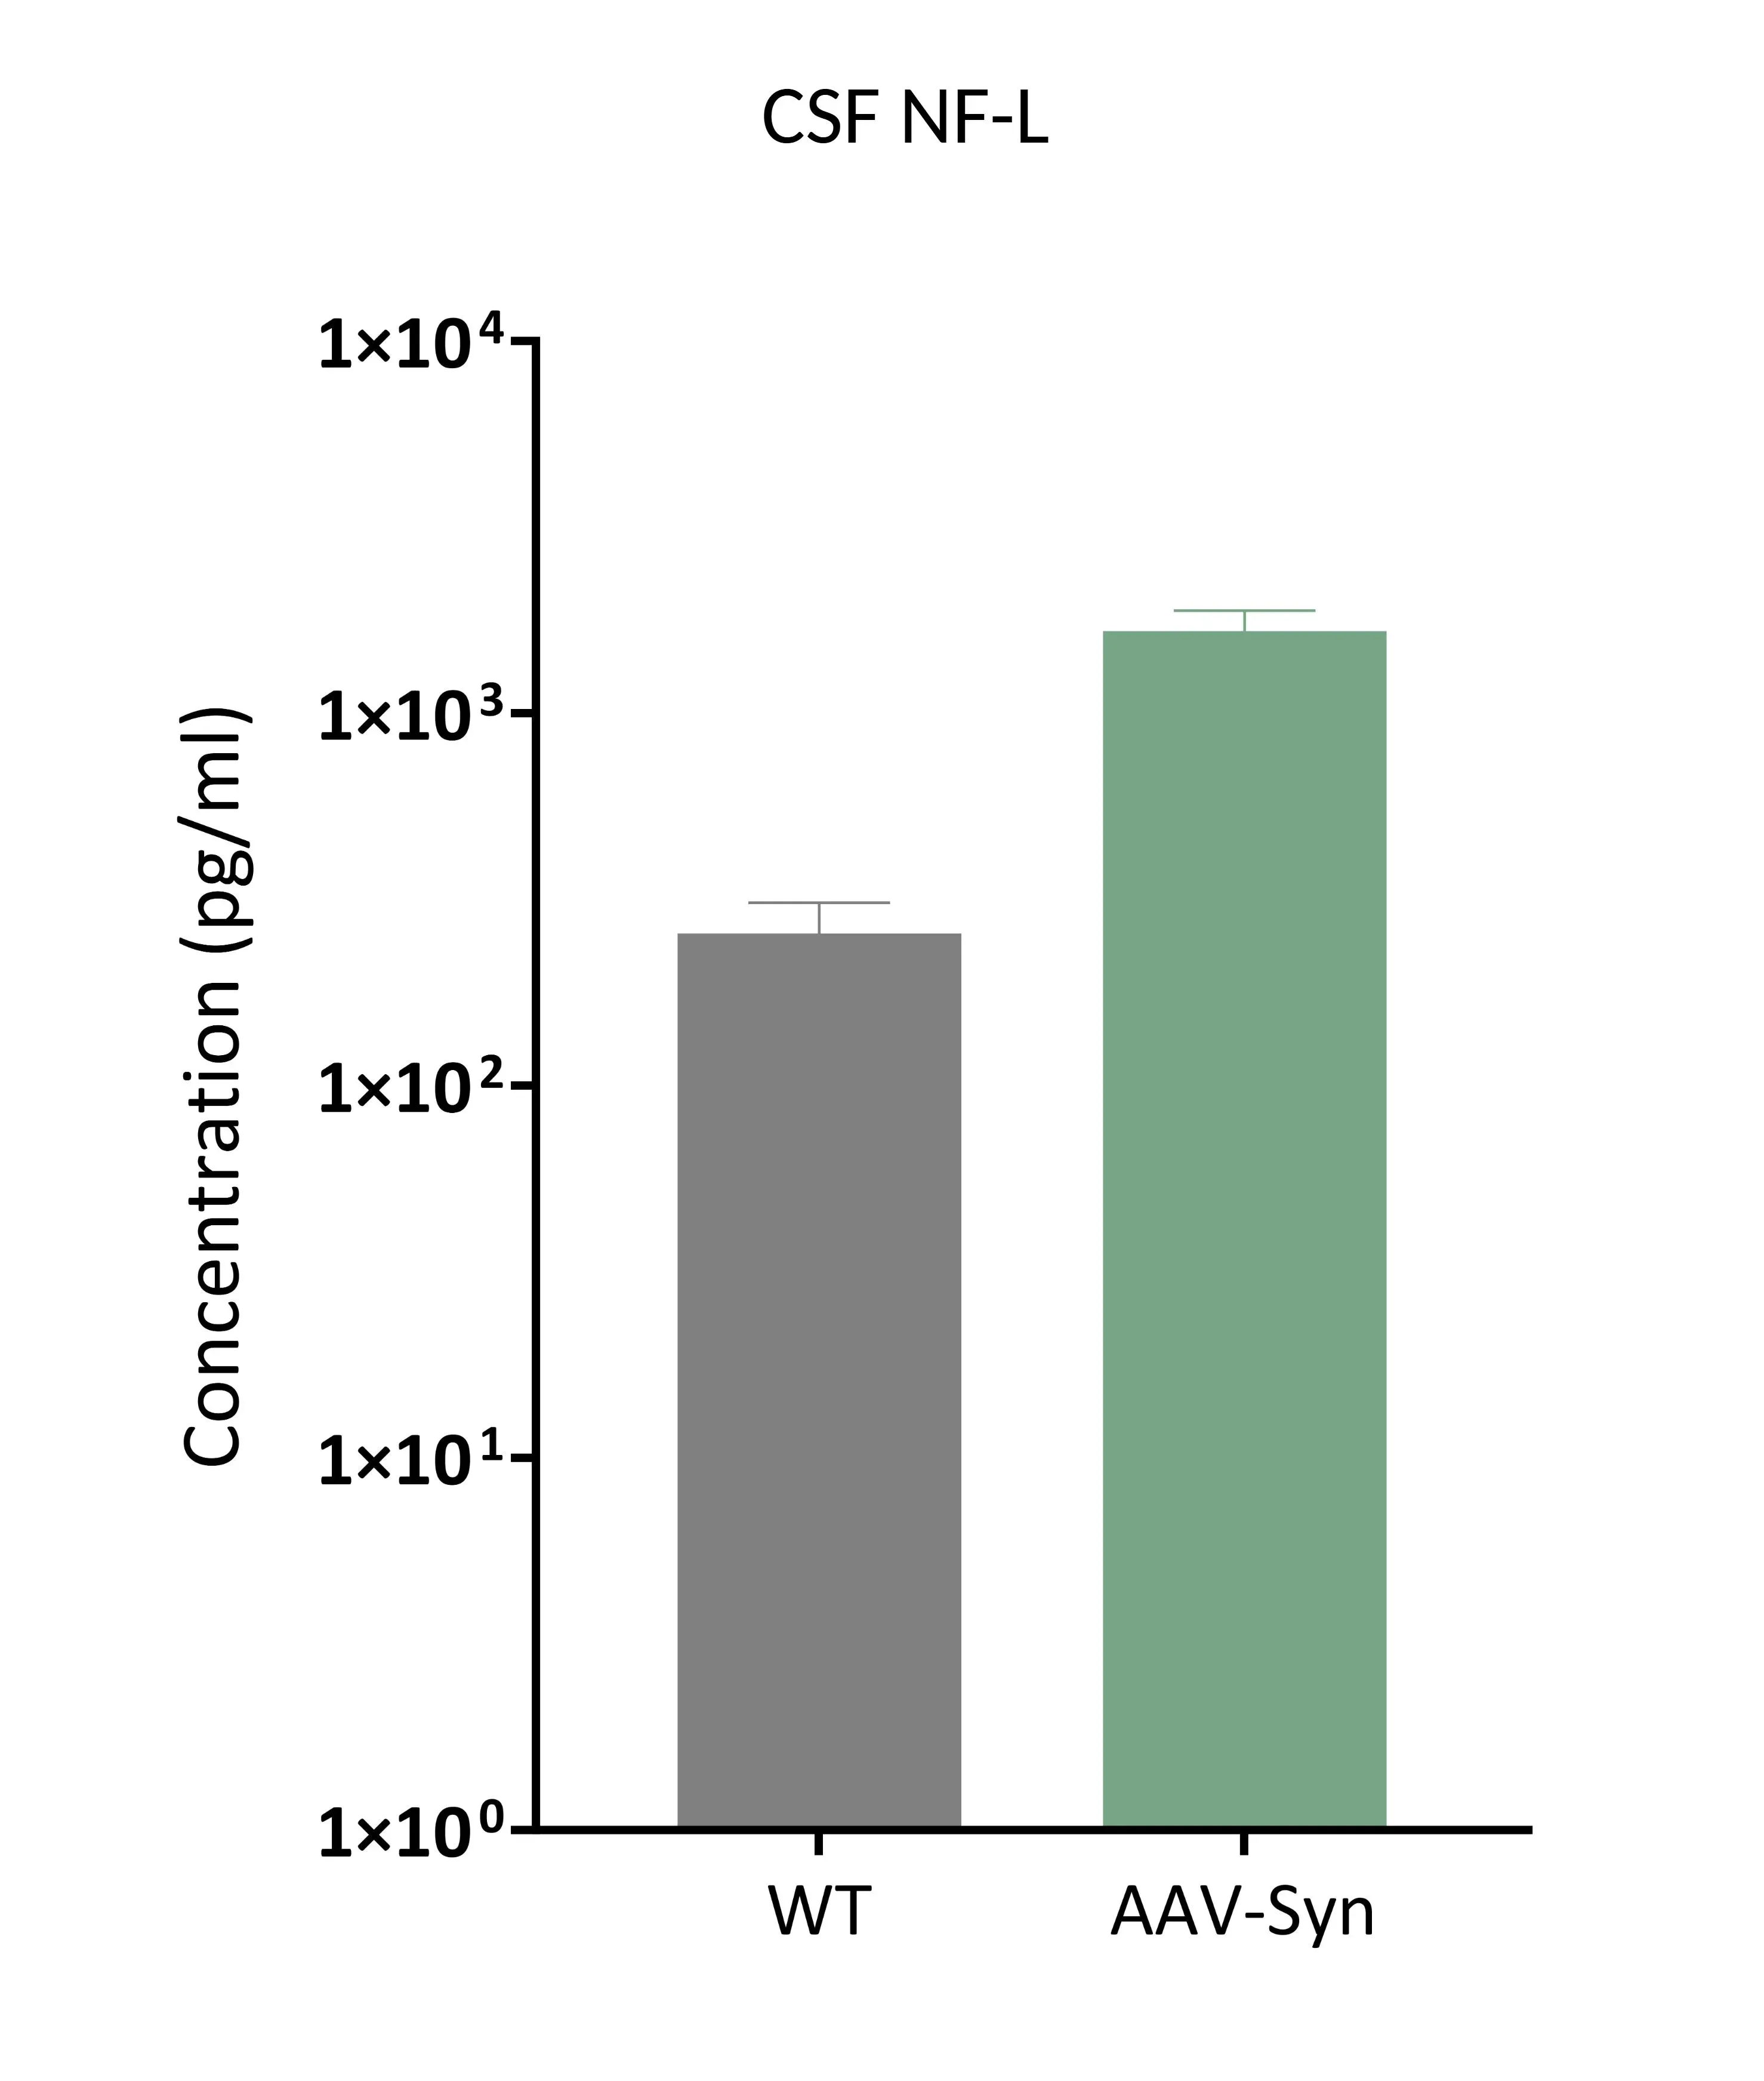
CSF NfL data comparing AAV-Syn to wild type (WT) controls; mean ± SEM.
AAV A53T α-Synuclein Model of PD
The AAV A53T α-synuclein model replicates key pathological features of human Parkinson's disease, including:
- Loss of dopaminergic neurons in the substantia nigra pars compacta
- Dopaminergic denervation of the striatum
- Aggregates of phosphorylated α-synuclein in cell bodies and neurites
- Neuroinflammation (microgliosis & astrogliosis)
- Motor dysfunction due to loss of dopaminergic innervation
NfL quantification in the model provides a sensitive and quantifiable readout of neurodegeneration, supporting both mechanistic studies and therapeutic evaluation.
For more information on this model, see our Resource:
Alzheimer's Disease Models
In patients with AD, both CSF and plasma NfL concentrations are consistently linked to greater cognitive and overall clinical decline, underscoring the value of NfL as a predictive biomarker for disease progression (Thomas, 2025).
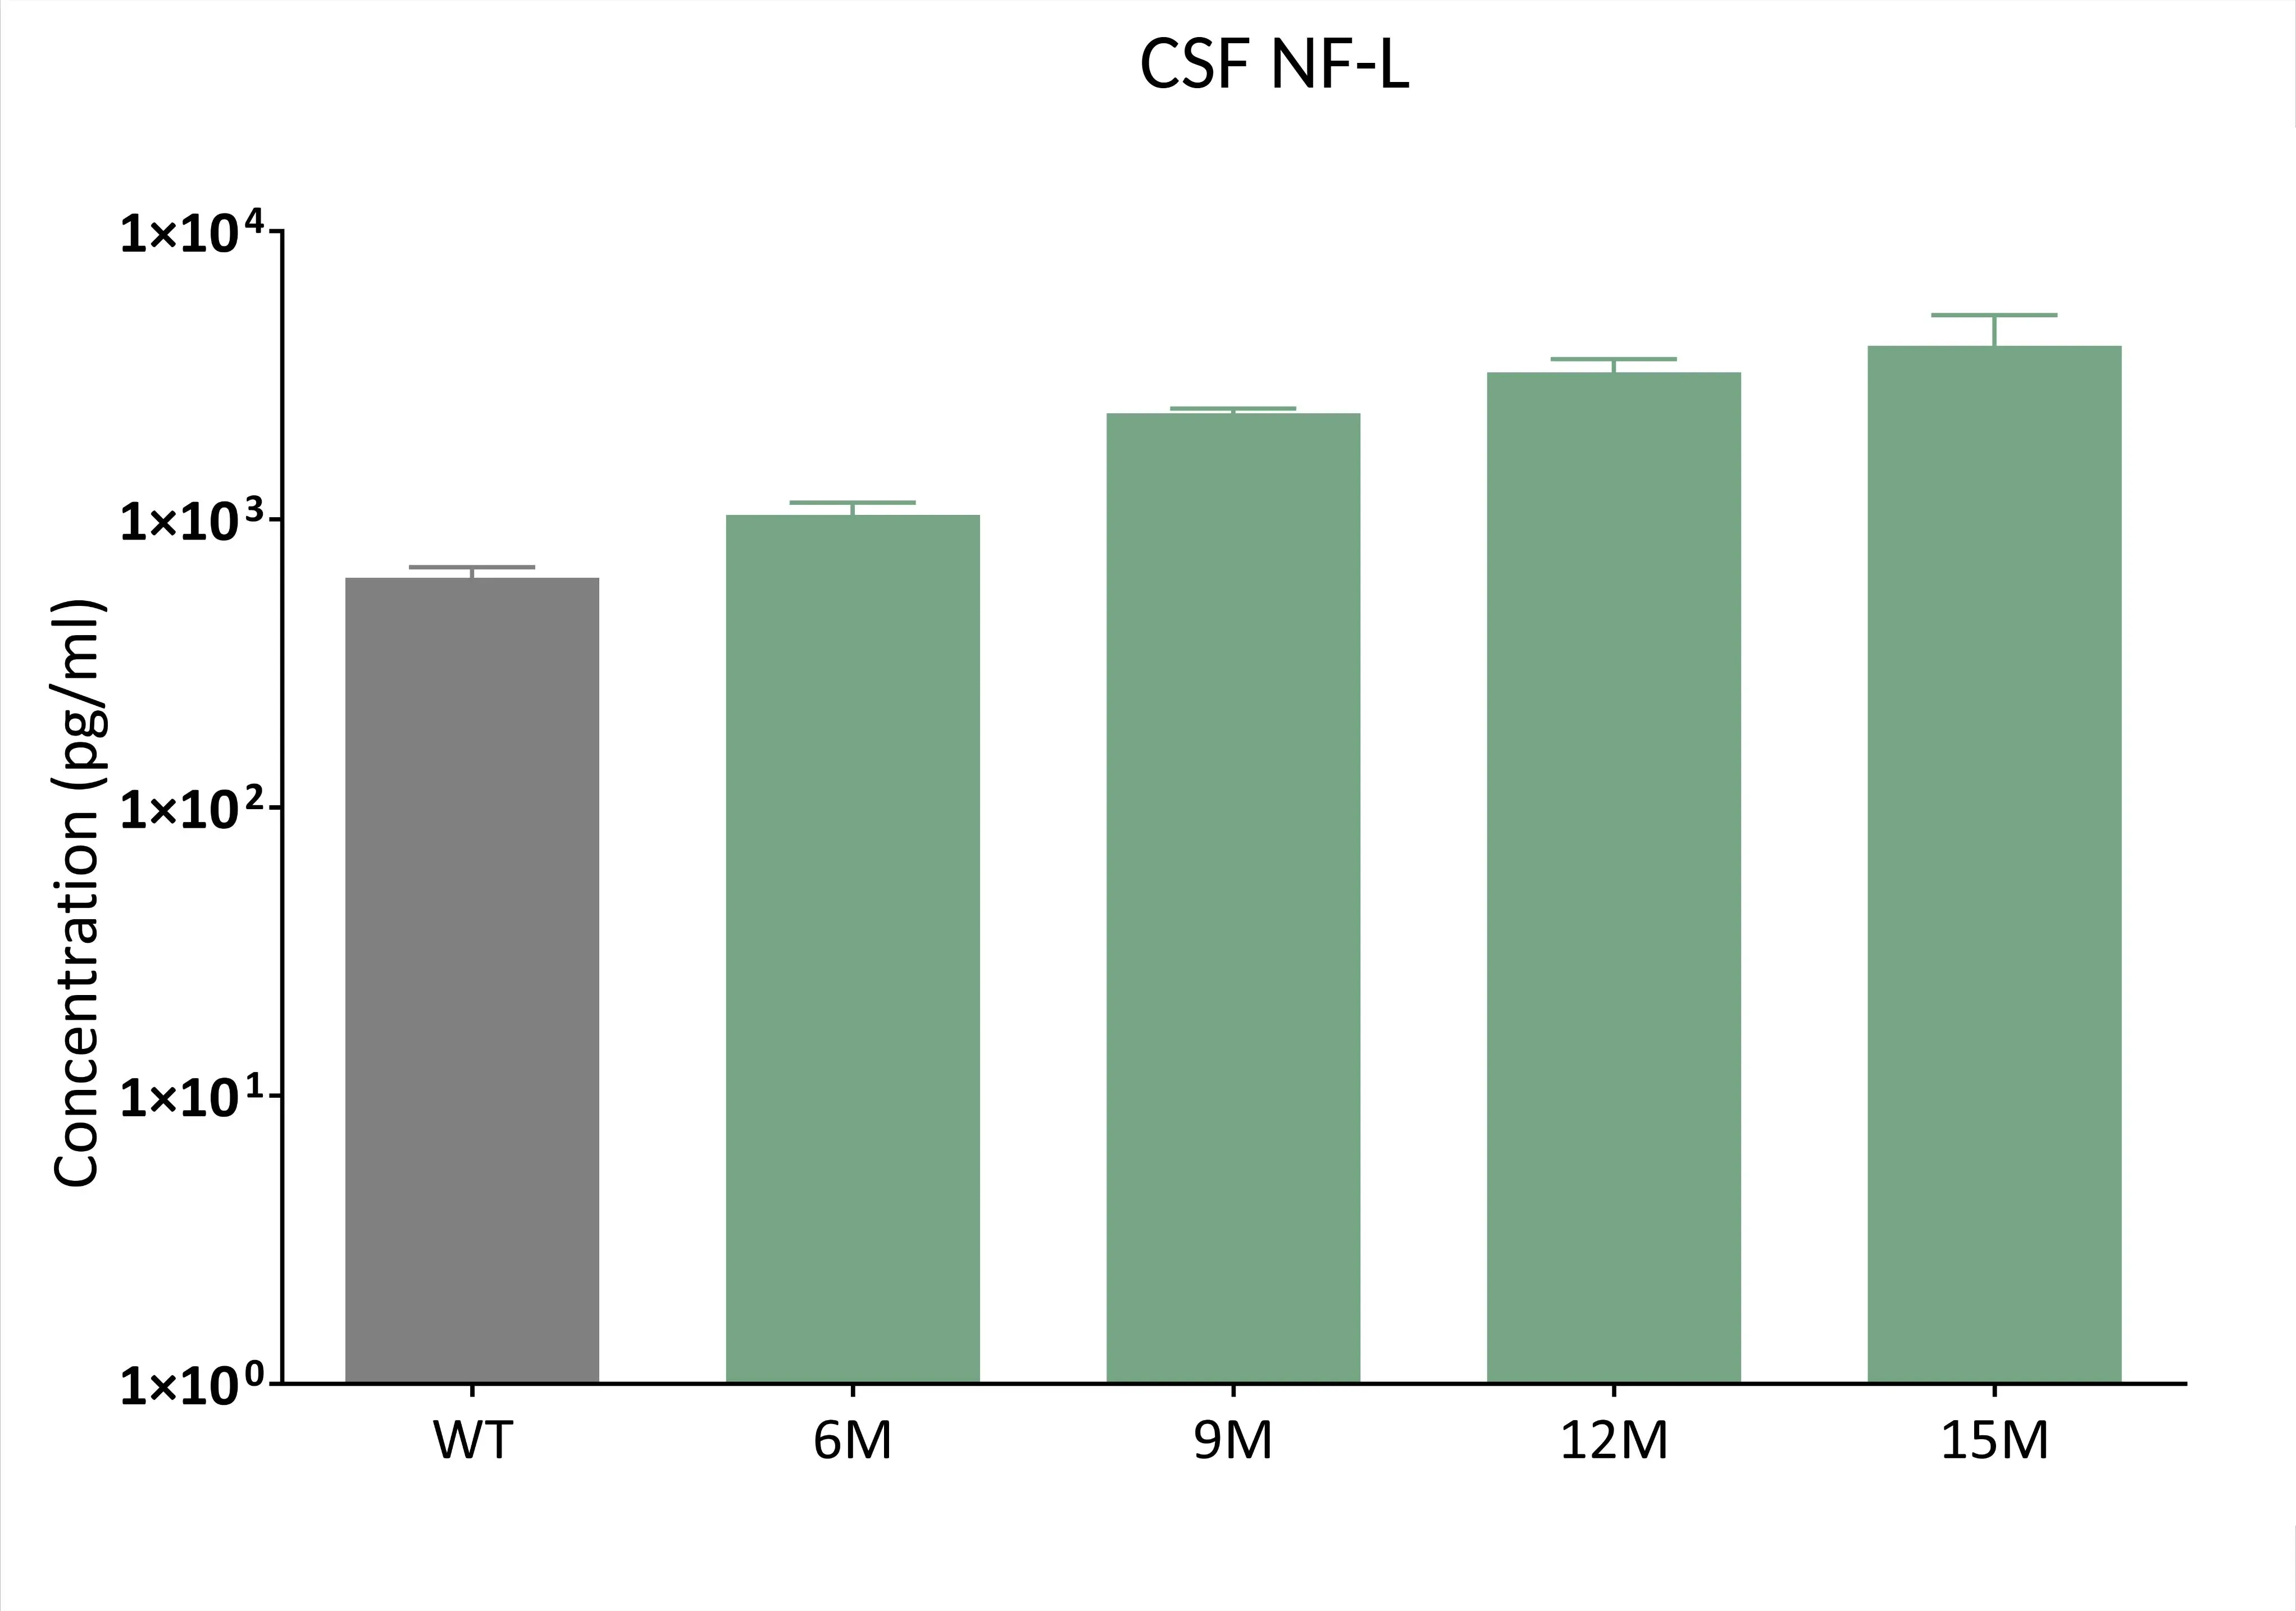
CSF NfL data comparing female APP/PS1 (ARTE10) to wild type (WT) controls; mean ± SEM.
APP/PS1 (ARTE10) Transgenic Model of AD
Replicates Alzheimer's disease-like amyloid-beta pathology, including:
- Progressive amyloid-β (Aβ) plaque deposition with time-dependent increases in burden and extent
- Fibrillar extracellular and intracellular Aβ pathology
- Dense core and diffuse plaques
- Vascular Aβ pathology (cerebral amyloid angiopathy; CAA)
- Neuroinflammation (microgliosis & astrogliosis)
NF-L quantification provides a sensitive biomarker of neurodegeneration in this model.
For more on this model and our innovative analyses, see:
Ella™, Simple Plex™, ProteinSimple™, and Bio-Techne® are trademarks of Bio-Techne; Simoa® is a trademark of Quanterix.
To discuss your study requirements or request a quote for NfL quantification services
Related Content
Up-to-date information on Neurofilament Light Chain (NfL) assays and services.
Neurofilament Light Chain in Parkinson's Disease Models
How neurofilament light chain (NfL; NF-L) levels can be used as blood (plasma; serum) & CSF biomarkers in Parkinson's disease mouse and rat models.
A Guide to ALS Models for Drug Discovery
A Resource for the most effective use of research animal models (mouse & rat models) of Amyotrophic Lateral Sclerosis (ALS) for preclinical testing of therapeutics.
Experimental Autoimmune Encephalomyelitis (EAE) & Axonal Injury
This resource describes the methods available for measuring axonal damage & axon degeneration, including tissue markers and plasma & CSF neurofilament light chain (NfL; NF-L) levels, in the EAE model of multiple sclerosis (MS).
ALS Mouse Models & Spinal Motor Neurons
An overview of the involvement of spinal motor neurons in disease progression in mouse models of Amyotrophic Lateral Sclerosis (ALS).
What is EAE (Experimental Autoimmune Encephalomyelitis)?
An overview of EAE animal models of multiple sclerosis (MS), including pathophysiology and utilization of positive controls for preclinical therapeutic studies.
TDP-43 ΔNLS (rNLS8) Mice for ALS Drug Development
This resource provides information about the use of the ΔNLS (deltaNLS, hTDP-43ΔNLS, hTDP-43DeltaNLS, dNLS, TDP43 NLS, rNLS8) TDP-43 transgenic mouse model of ALS for preclinical therapeutic studies.