Microglia-Neuron Interactions in a Novel TDP-43 Mouse Model
Microglia Histology & Image Analysis for Mouse & Rat Models
Global preclinical CRO specializing in multiplex IF staining & image analysis of microglia in animal models.
Analysis of microglial morphology, cell-cell interactions & other spatial relationships for mice & rats.
Biospective has industry-leading expertise in providing microglia histology & advanced image services, including multiplex immunofluorescence (mIF) staining using a variety of antibodies for comprehensive microglial phenotyping. We have developed proprietary image analysis and image visualization capabilities for microglial morphology, cell-cell interactions, and spatial analysis.
Explore our Services
- What Contract Research Services does Biospective Offer for Microglia Staining & Analysis?
- What is Biospective’s Workflow for Staining & Quantitative Analysis of Microglia?
- Why Quantify Microglial Activation and Microglia-Neuron Interactions in Models of Neurological Diseases?
- How does Biospective Perform Morphology-based “Activated Microglia” Analysis?
- How does Biospective Quantify Microglia-Neuron Interactions?
- Biospective’s Commitment to Neuroinflammation Research
What Contract Research Services does Biospective Offer for Microglia Staining & Analysis?
Multiplex immunofluorescence staining, segmentation, morphological and spatial analysis of microglia in tissue sections from rodent models.
Microglia are central determinants of central nervous system (CNS) homeostasis and disease progression across major indications, including:
Alzheimer’s disease (AD)
Tauopathy-related dementias (e.g. FTD, CBD, PSP)
Parkinson’s disease (PD)
Amyotrophic Lateral Sclerosis (ALS)
Multiple Sclerosis (MS)
Quantitative analysis of microglial features, including density, morphology-based activation state scoring, and neuron-associated contact topology, is critical for measuring disease progression and therapeutic response. Biospective has developed robust multiplex immunofluorescence (mIF) staining and automated whole-slide quantification workflows optimized for pathology-centric microenvironment profiling and microglia–neuron interaction endpoints in rodent CNS tissues.
Our Microglia Staining & Image Analysis Capabilities
Iba1-based Microgliosis Quantification
Whole-slide Iba1 stain density quantification and regional burden within specified regions-of-interest, minimizing sampling bias and supporting cohort-scale comparisons.
Microglia Segmentation and Morphology-based Activation Profiling
Whole-slide detection and classification of microglia.
High-content morphometrics extracted from Iba1-positive cells and analyzed with trained, validated machine-learning models to identify subtle state shifts.
Outputs include soma size and shape remodeling, process length and branching architecture, enabling objective morphology-driven subclassification and continuous state scoring.
Multiplex Phenotyping Aligned to Mechanism-of-Action
Microglia state-marker panels combined with Iba1 in mIF, typically up to four targets plus DAPI, optimized for the rodent model, tissue type, and endpoint strategy. Markers can be quantified as stain density in regions-of-interest and within segmented cells to obtain cell-expression profiles. Common markers include:
Microglia identity and homeostatic state: TMEM119, CD11b, TSPO
Phagolysosomal burden and phagocytic load: LAMP1, CD68
Reactive inflammatory activation and immune context: CD45, TREM2
Effector-pathway context: iNOS, complement components (for example C1q)
Inflammasome engagement: ASC, cleaved caspase-1
Purinergic signaling: P2RY12
Pathology Microenvironment Analysis
Pathology and microenvironment markers can be integrated to quantify how microglial state varies with local pathologic burden and proximity to pathology-defined foci, enabling spatially resolved niche phenotyping within inflammatory microenvironments. Channels may include:
AD models: Aβ plaque markers (fibrillar amyloid, 6E10/4G8, pFTAA) and tau markers (AT8, PHF1, MC1, p-Tau217, cleaved tau N368/Asp412)
ALS models: phospho-TDP-43 (p409/410), human TDP-43, total TDP-43
MS models: myelin integrity markers (e.g. MBP)
Structural and vascular markers: GFAP, laminin
Outputs include profiling of metrics such as stain density and microglial morphology as a function of distance to the pathology, and colocalization of specific markers.
Quantification of Microglia-Neuron Direct Interactions
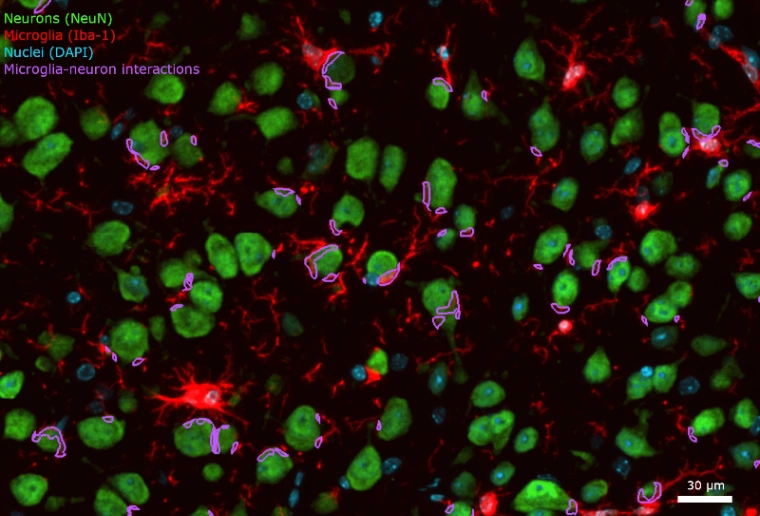
By adding a neuronal marker (e.g. NeuN), direct contacts between microglia and neurons can be characterized.
Both the size of the interaction and the location (microglia process to neuronal soma or soma-soma) can be quantified automatically.
What is Biospective’s Workflow for Staining & Quantitative Analysis of Microglia?
Well-established protocols for brain sample preparation, staining, slide scanning, and quantitative image analysis.
Our Process for Microglia Staining & Analysis
At Biospective, we have implemented a standardized, highly reproducible multi-step process for staining and analysis of microglia from formalin-fixed brains:
Sample Preparation
High-precision microtome sectioning or cryosectioning of FFPE or fixed-frozen brains.
Custom antigen retrieval protocols optimized for Iba1, NeuN, and microglia activation markers, maximizing signal-to-background to support detection of subtle features required for quantitative image analysis. Retrieval conditions are further customized for any additional antibodies included in the multiplex panel. We routinely perform formic acid retrieval, heat-induced retrieval (HIER), enzymatic retrieval, or a combination of these methods.
Stringent quality control (QC) of staining quality and specificity as well as tissue integrity.
Staining (IHC or Multiplex IF)
Marker panels are configured based on the desired analysis, often combining:
Iba1 (microglia)
NeuN (neuronal soma; when cell-to-cell interaction endpoints are required)
Disease model-relevant pathology (e.g. Aβ, p-tau, p-Syn129, phospho-TDP-43)
Microglia state or pathway markers (e.g. CD68, TREM2, ASC)
DAPI (nuclei)
Advantages of Multiplexing
Multiplexing enables cell-type–specific analysis of the microenvironment on a single slide, accurately characterizing the cellular landscape surrounding individual plaques.
Imaging
Whole-section multichannel fluorescence scanning
Quantitative Analysis
We have developed fully-automated quantitative analysis for multiplex immunofluorescence:Fully-automated segmentation for microglia (Iba1), neuronal soma (NeuN), and model-relevant pathology markers
High-throughput, region-based reporting of microglial burden and morphology-derived state metrics
When NeuN is included, contact analysis resolves two interaction topologies:
Microglial process-to-neuronal soma contact
Microglial soma-to-neuronal soma contact, including quantitative contact area.
Illustration of Biospective's process of collecting brain tissue samples from animal models, performing tissue sectioning, multiplex immunofluorescence staining, whole slide scanning, and quantitative image analysis.
Sample Collection, Preparation, and Shipping Guidelines
We provide comprehensive support to ensure sample integrity and data reliability:
Sample Collection: Animals should be perfused with cold PBS and/or 10% neutral-buffered formalin, and the brains should be carefully extracted.
Sample Preparation: Brains must be briefly properly fixed in 10% neutral-buffered formalin.
Sample Shipping: Samples must be shipped in PBS with sodium azide.
Why Quantify Microglial Activation and Microglia-Neuron Interactions in Models of Neurological Diseases?
A brief overview of microglial reactivity in neurological disease models and why rigorous quantitative analysis is critical.
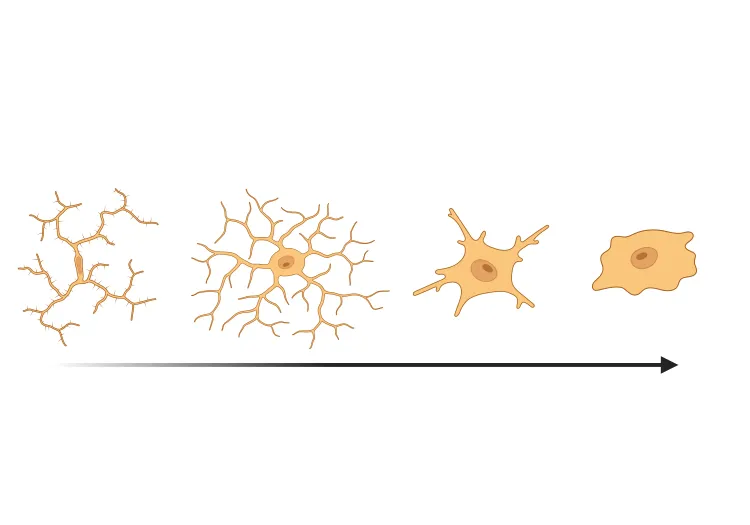
Microglia maintain tissue homeostasis through continuous parenchymal surveillance, immune sensing, and tightly regulated phagocytic clearance. In disease, microglia shift into heterogeneous activated states that are regionally patterned and stage-dependent, aligning with selective neuronal vulnerability and the emergence of synaptic and circuit-level dysfunction. These state shifts are mirrored by quantifiable morphological remodeling, including soma hypertrophy and shorter, thicker, and more branched processes.
Functionally, microglia transition from surveillance to an effector state, meaning they shift from primarily sensing and maintaining homeostasis to executing defined response programs that actively modify the local microenvironment, through inflammatory signaling, oxidative mechanisms, complement cascades, and lysosome-coupled phagocytosis.
These structural changes are commonly accompanied by:
Increased production and release of pro-inflammatory cytokines and chemokines
Reactive oxygen and nitrogen species generation
Complement-associated programs
Elevated phagolysosomal and phagocytic load
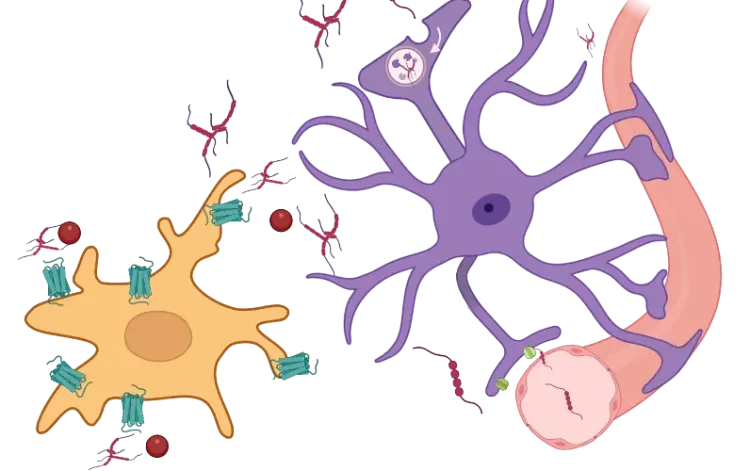
In normal and pathological conditions, microglia directly interacts with neurons for multiple purposes, such as synapse pruning and development (Paolicelli, 2011; Schafer, 2012) and axonal guidance (Squarzoni, 2014). Recently, specialized sites between microglial process and neuronal soma, termed somatic purinergic junction, have been proposed to be a key site for microglial sensing of neuronal health (Cserép, 2020, 2021). These sites were found to be associated with mitochondria on the neuronal side and the purinergic receptor P2Y12R on the microglia side. While the role of somatic junctions in neurodegenerative disorders remains largely unexplored, several lines of evidence suggest they may be altered, including an increase in the frequency of interactions in an acute brain injury model (Cserép, 2020), mitochondrial dysfunction in these conditions, and Biospective’s research study showing a strong correlation between these interactions and neurodegeneration in a mouse model of Parkinson’s disease.
Together, morphology, effector-pathway engagement, and contact topology provide mechanistically anchored, quantifiable endpoints that link microglial state to neuron-associated engagement within pathology-defined microenvironments, and to downstream neuroinflammatory and neurodegenerative phenotypes. Depending on context, these responses can be adaptive, supporting lesion containment, efficient debris clearance, and circuit support via trophic and synapse-modulatory programs, or maladaptive, sustaining inflammatory signaling and inappropriate phagocytic remodeling or removal of stressed yet viable neuronal elements, thereby accelerating circuit dysfunction and neurodegeneration.
How does Biospective Perform Morphology-based “Activated Microglia” Analysis?
A summary of our methods to classify activated microglia.
Overview of Analysis Methodology
Cells are detected and segmented on whole slide images using computer vision and deep-learning approaches.
Morphological features such as the soma area, the number of branching point in processes, etc. are then extracted.
Based on these features, cells are classified as activated or not and are assigned a continuous activation score by a machine learning model.
These metrics are then aggregated by neuroanatomical region-of-interest (ROIs), subject, and group for statistical analysis.
Animated workflow for microglia morphology analysis.
What is the Value of Activated Microglia Analysis?
Larger effect size than simply quantifying Iba1 stain density. In multiple contexts, such as in mouse models of Alzheimer’s disease and Parkinson’s disease, Biospective has observed larger effect size in group comparisons using the microglial morphological analysis than measuring the Iba1 stain density. In the context of a preclinical efficacy study, this result means that the same drug effect would be detectable with smaller cohort size.
Correlates with translationally relevant clinical metrics. Our microglia morphological analysis has shown strong correlation to translationally relevant clinical metrics, such as motor scores and MRI brain volume, making it a valuable insight into the effects of a putative therapeutics..
How does Biospective Quantify Microglia-Neuron Interactions?
A summary of our quantification methods for cell-to-cell interactions and an illustrative example from a TDP-43 ALS mouse model.
In order to analyze direct interactions between neurons and microglia, we perform multiplex immunofluorescence including microglial (e.g. Iba1) and neuronal (e.g. NeuN) markers in thin tissue sections. Biospective’s platform automatically identifies and quantifies the properties of each interaction:
Size: overlap area, fraction of cellular perimeter covered, etc.
Type/Subcellular Localization: soma-soma or microglial-process-to-neuronal soma
Aggregate statistics (e.g. fraction of microglia with process-to-soma interactions) can then be calculated by neuroanatomical regions, subjects, and groups for statistical analysis.
To illustrate our workflow, we have applied this image processing & analysis pipeline to mIF images from the brains of a novel TDP-43 proteinopathy mouse model developed by Biospective. Non-transgenic, wild-type (WT) C57BL/6 mice were unilaterally injected with AAV-hTDP43ΔNLS (or AAV-null as a control) into the substantia nigra pars compacta (SNc). Brains were collected at 6 weeks post-injection.
In this research study, we found that, compared to controls, the AAV-hTDP43ΔNLS group had:
Extensive microgliosis, with a strong increase in the Iba1 stain density and the density of activated microglia obtained from the morphological analysis.
More microglia-neuron interactions:
A larger fraction of neurons had interactions with microglia.
Even though the total number of microglia was highly increased, a larger fraction of microglia had interactions with neurons. Interestingly, this metric had stronger statistical significance than pure microglia-based metrics.
A large increase in the density of both microglia-process-to-neuronal soma interactions and soma-soma interactions.
A change in the nature of the interactions, as the interactions are larger.
These interactions appeared to be a direct microglial response to the pathology: the greater the pathological burden was present within individual cells (as measured by hTDP43/pTDP43 markers), the more likely these cells were to have an interaction.
These advanced metrics are therefore highly valuable for preclinical therapeutic efficacy studies. The higher sensitivity means that a smaller effect size would be detected using the same cohort size. In addition, these metrics offer detailed insights into neuronal health, treatment-related microglial responses to pathology, and microglia-neuron interactions.
Interactive Presentation of Our Research Study
In the "Image Interactive" below, you can find results from our microglia-neuron interaction analysis, including high-resolution Multiplex Immunofluorescence tissue sections of brains from our proprietary inducible TDP-43ΔNLS model and control mice.
How to use Our Interactive Viewer
Navigate through the “Image Story” via the left-hand panel or the on-screen arrows. You can pan around high-resolution microscopy images with your mouse, and zoom in/out using the scroll wheel or the +/- controls. The Control Panel (top-right) allows toggling of image channels and segmentation overlays. For the best experience, we recommend switching to full-screen mode. This Interactive Presentation enables you to explore the model’s neuropathology and associated functional deficits in detail, as if looking directly down the microscope.


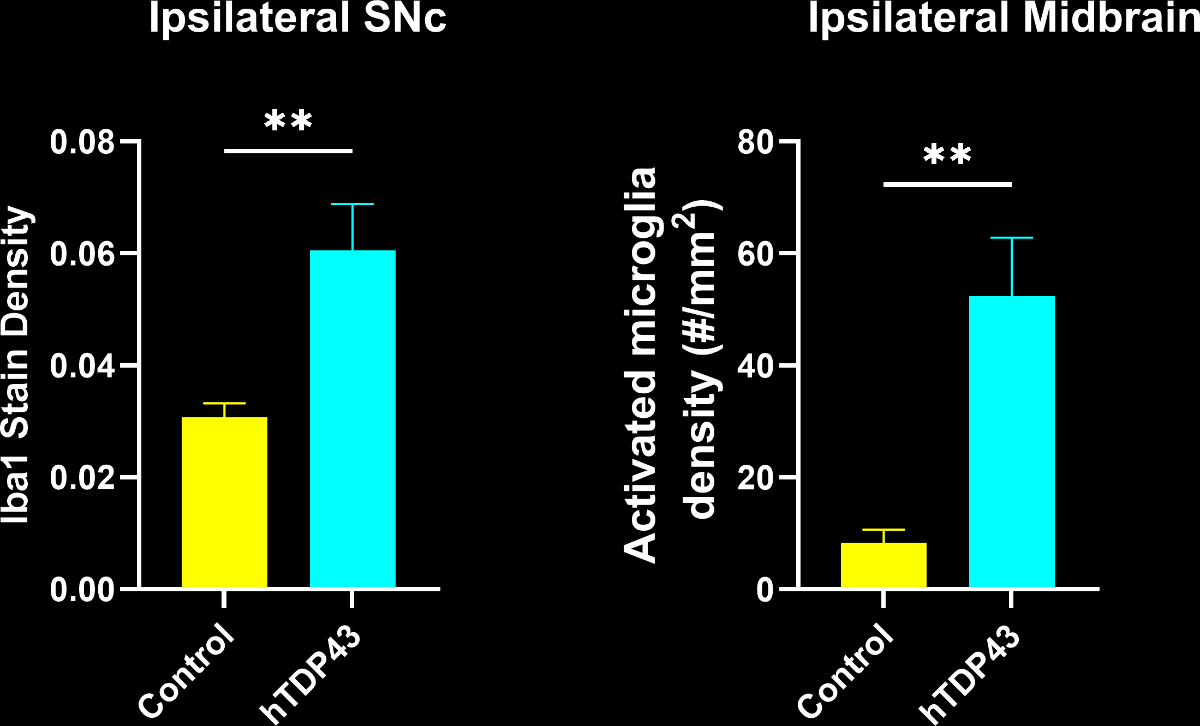
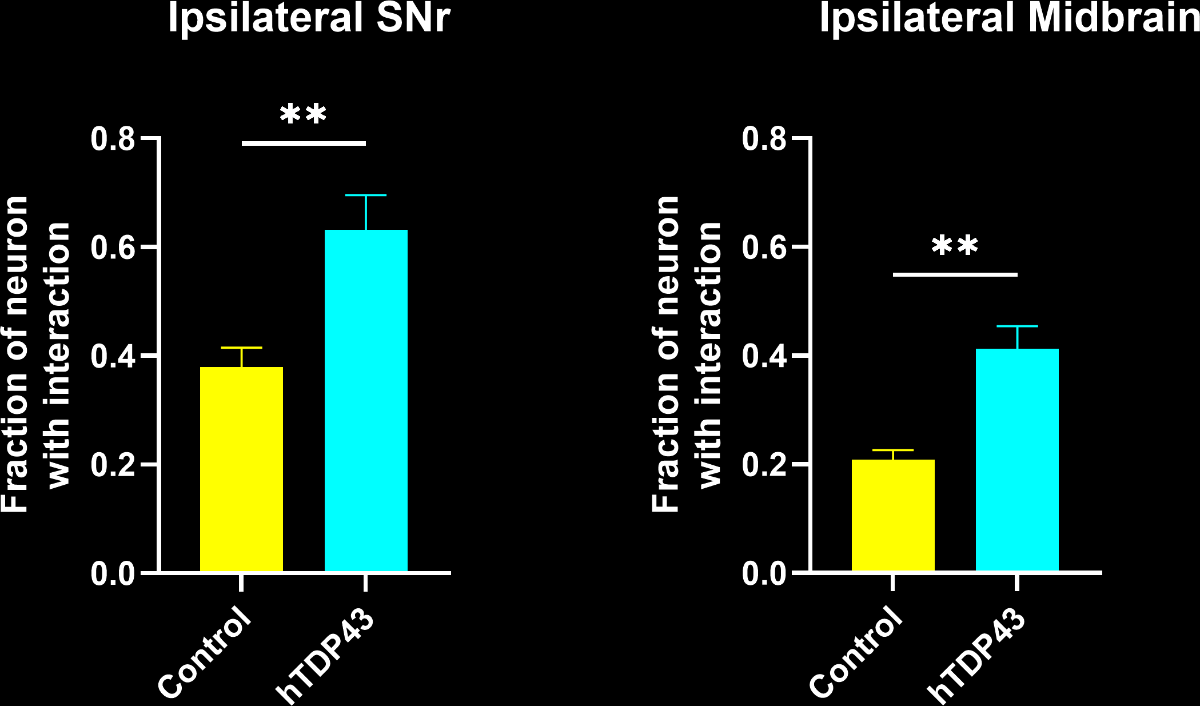
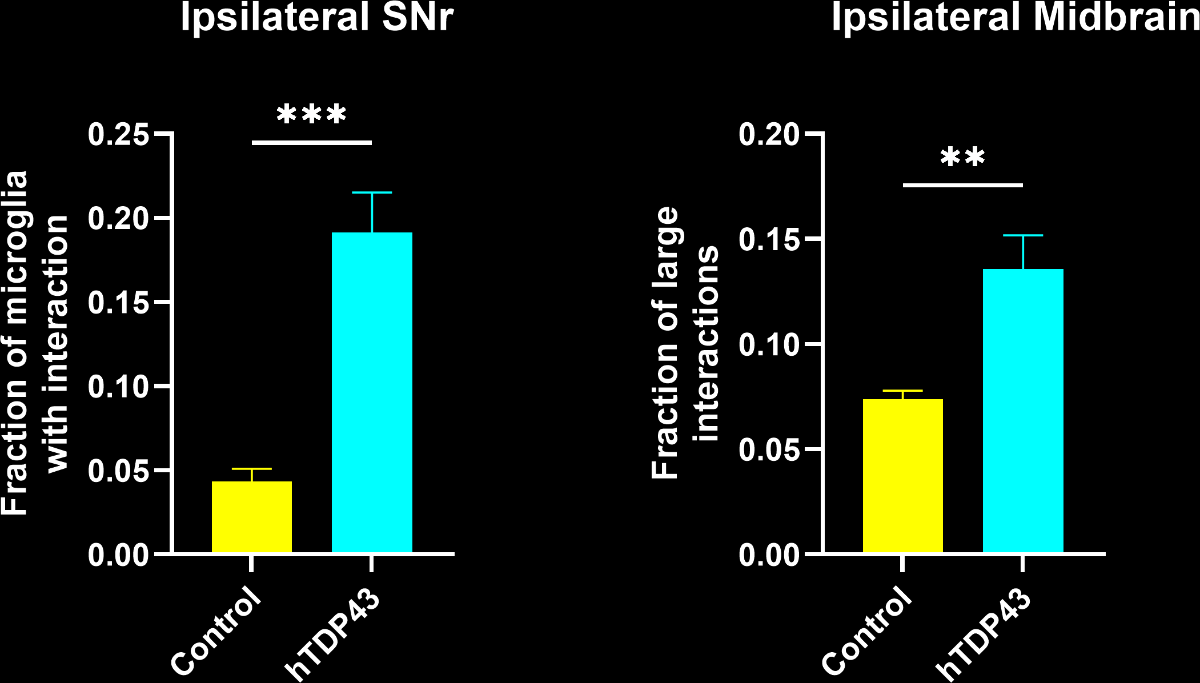
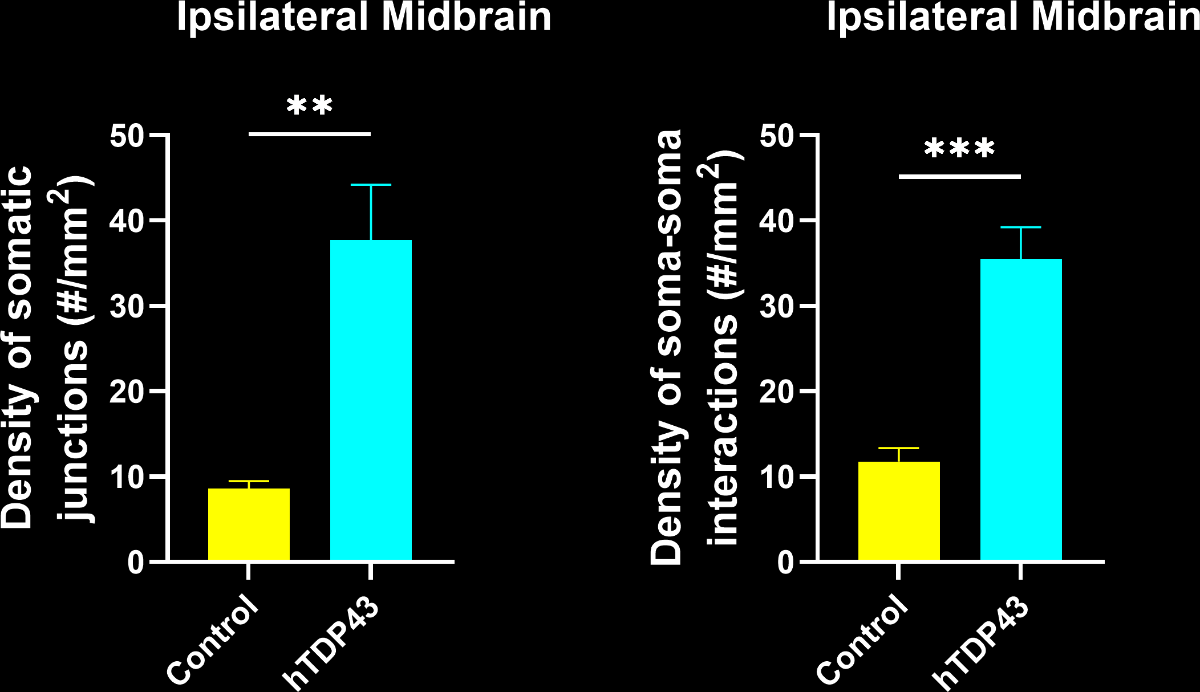
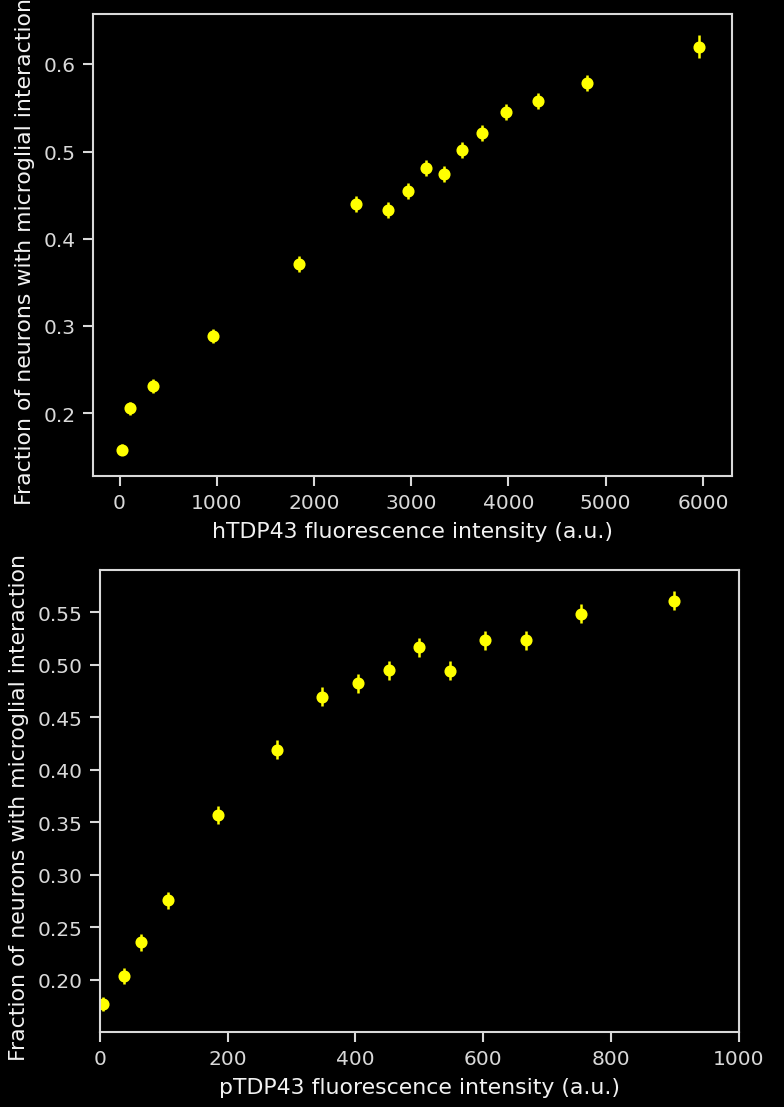
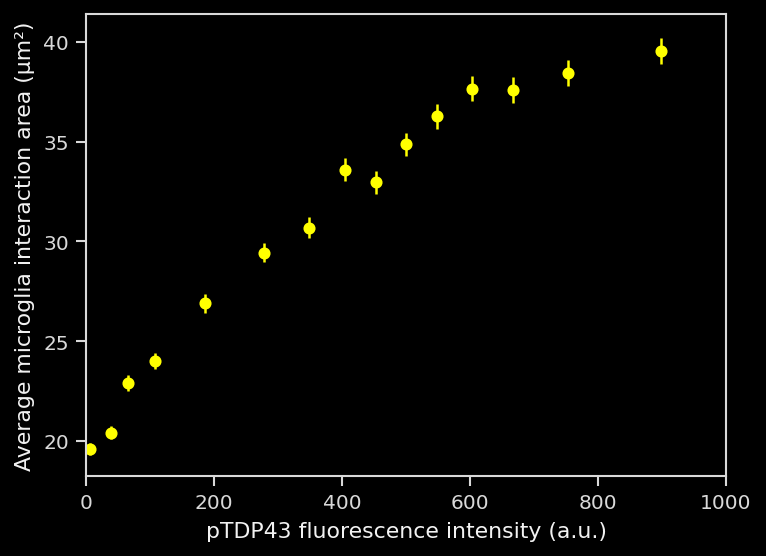
Image Interactive describing our microglia-neuron analysis, including high-resolution Multiplex Immunofluorescence brain tissue sections, from our AAV-TDP-43ΔNLS mouse model and control mice.
Key Advantages of Biospective's Microglia Staining & Analysis Services:
High-sensitivity microglia detection
Optional staining with markers of microglial phenotype, including custom antibody/marker staining
High-throughput, automated whole slide imaging and neuroanatomical region analysis
Unique fully-automated quantitative image analysis
Microglial morphology and activation states
Microglia-neuron interactions
Spatial proximity analysis (e.g. Aβ plaques)
Cross-species (mouse, rat) compatibility
Complementary services (e.g. tissue & fluid cytokine concentrations measured via immunoassays)
Selection of Amyloid Plaque Environment Metrics provided by Biospective's Platform
Metric | Units | Description |
Stain density | Fraction | Fraction of pixels positive for each stain used in mIF or IHC |
Density of morphologically reactive microglia | Counts per mm² | Density of microglia classified to a non-ramified morphology state |
Mean microglia activation score | Morphology score | Average morphology-derived activation score of detected microglia in an ROI |
Fraction of neurons with microglial contacts | Fraction | Fraction of NeuN+ neurons in direct apposition with Iba1+ microglia |
Fraction of microglia–neuron contacts that are process-to-soma | Fraction | Fraction of contacts classified as microglial process-to-neuronal soma topology |
This table compares the various quantiative microglial metrics provided by Biospective's platform.
Biospective’s Commitment to Neuroinflammation Research
We have an active research & innovation (R&I) program with a particular emphasis on interrogating the intricate roles that microglia & astrocytes play in neurodegenerative, neuromuscular, and neuroinflammatory diseases.
At Biospective, we recognize the key role that neuroinflammation plays in neurological diseases, and the value of targeted therapeutic modulation of neuroinflammatory responses. As part of our internal research and innovation efforts, we are actively working to better understand the involvement of neuroinflammation in disease pathogenesis. Our current activities include:
Our Microglia, Astrocytes, and Neurodegenerative Diseases Initiative - a collection of original Presentations and Resources interrogating the complex relationship between neuroinflammation and neurodegeneration.
Analysis of microglia and astrocytes in our animal models of ALS, Alzheimer’s disease, Parkinson’s disease, Tauopathies, and Multiple Sclerosis.
Development of new methods to characterize the phenotypes of microglia & astrocytes, as well as their spatial relationships to misfolded proteins (e.g. amyloid-β, α-synuclein, tau, TDP-43), neurons and their processes, cerebral vasculature, peripheral inflammation, etc.
Contact Us CTA
To discuss your study requirements or request a quote for Microglia Staining and Image Analysis services:
FAQs
FAQs
References
Keywords
Related Content
Up-to-date information on Microglia and Neuroinflammation.
Amyloid-β & Inflammatory Microenvironment in Alzheimer's Mice
We have analyzed the complex spatial relationships between β-amyloid plaques, activated & resting microglia, and astrocytes in an APP/PS1 transgenic model.
Microglial Activation in an α-Synuclein PFF Mouse Model
We have quantified microglial activation, based on morphology, in an α-synuclein preformed fibril (PFF) seeding & spreading mouse model of Parkinson’s disease.
Microglia Morphology in ALS, Alzheimer's Disease & Parkinson's Disease
An overview of microglial morphological analysis and the applications to neurodegenerative disease research and drug discovery & development.
Impaired Microglia Autophagy in Neurodegenerative Diseases
How impaired microglia autophagy contributes to the progression of neurodegenerative diseases.
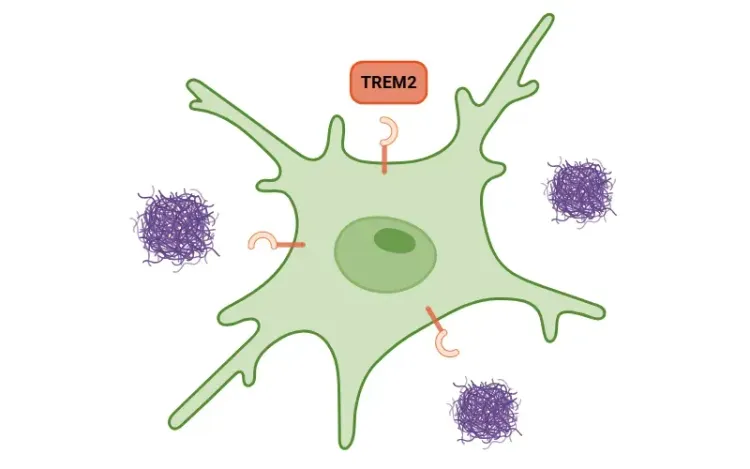
TREM2, Microglia and Neuroinflammation
An overview of TREM2, its role in microglia, links to neurodegenerative diseases, and potential treatment implications.
TNF-α (TNF-alpha) & Microglia in Neurodegenerative Diseases
An overview of the function of tumor necrosis factor-alpha (TNF-α) in microglia and its contribution to the progression of neurodegeneration.
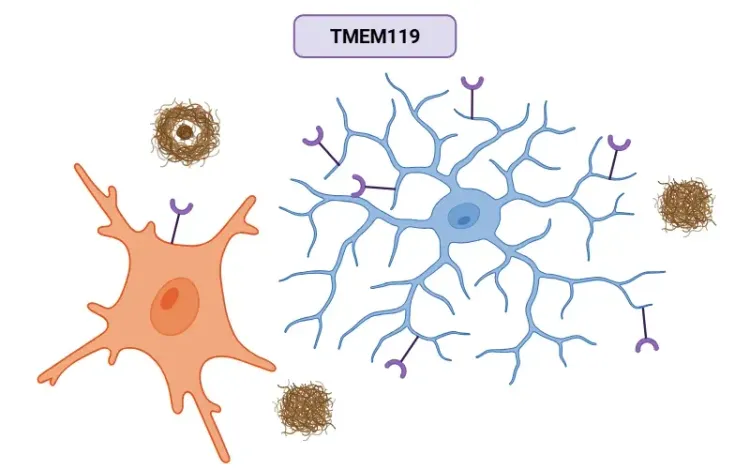
TMEM119 (transmembrane protein 119) and Microglia
An overview of the significance of TMEM119 in labeling microglia and its role in various diseases, including Alzheimer’s disease.
Lysosome Dysfunction in Microglia & Astrocytes
An overview of lysosomal dysfunction in microglia & astrocytes, and its role in neurodegenerative diseases.
Microglia, Astrocytes & Tau in Neurodegenerative Diseases
How glial-driven neuroinflammation fuels tau aggregation, propagation, and neuronal loss in Alzheimer’s disease and other tauopathies.
Microglia, Astrocytes & α-Synuclein in Parkinson’s Disease
How α-synuclein influences microglia and astrocytes in Parkinson’s disease and other synucleinopathies.
Microglial Senescence and Neurodegenerative Diseases
An overview of microglial senescence and its role in neurodegenerative diseases, including Alzheimer’s disease (AD) and Parkinson’s disease (PD).
Microglia-Neuron Interactions & Neurodegenerative Diseases
A concise review of the direct interactions between microglia & neurons, and how these cell-to-cell interactions may be affected in neurodegenerative diseases.
Mitochondrial Dysfunction in Microglia & Astrocytes
The role of mitochondrial dysfunction in microglia and astrocytes in neurodegenerative diseases, including Alzheimer’s disease, Parkinson’s disease, and ALS.
NLRP3 Inflammasome and Neurodegenerative Diseases
An overview of the NLRP3 inflammasome and its role in neurodegenerative diseases, including Alzheimer's disease, Parkinson’s disease, and ALS.