ALS Mouse Models & Spinal Motor Neurons
An overview of the involvement of spinal motor neurons in disease progression in mouse models of Amyotrophic Lateral Sclerosis (ALS).
Do mouse models of ALS reproduce spinal motor neuron pathology observed in human disease?
An essential feature of a useful animal model of ALS is that it reproduces multiple aspects of the human disease that can be readily measured (see ALS Mouse Models for Drug Development). Motor neuron loss and axonal, dendritic & synaptic degeneration are hallmarks of ALS (Salzinger, 2024). Degeneration of motor neurons leads to skeletal muscle weakness and wasting, and eventual death, typically due to respiratory failure (Hardiman, 2011).
Familial ALS constitutes approximately 10% of cases, with the most common mutations occurring in the C9ORF72, SOD1, FUS, and TARDBP genes (Hardiman, 2017). While mutations observed in the TARDBP gene are rare (<1%), the protein (TDP-43) encoded by the TARDBP gene forms cytoplasmic aggregates in approximately 97% of ALS cases (Shatunov, 2021). As such, genetically engineered animal models of ALS have been developed based on these and other genes.
An illustrative example of an ALS mouse model that recapitulates neuromotor features of human disease is the hTDP-43ΔNLS (rNLS8) transgenic mouse model (Walker, 2015) [see TDP-43 ΔNLS (rNLS8) Mice for ALS Drug Development]. These mice show:
- Overexpression of human TDP-43 with a defective nuclear localization signal (NLS), resulting in mislocalization (with reduced levels of nuclear TDP-43 expression) and formation of cytoplasmic aggregates
- Loss of fast-fatigable (FF) motor neurons with a relative sparing of slow motor neurons
- Neuromuscular junction (NMJ) denervation and reinnervation, as seen in human ALS (Spiller, 2016; Hur, 2022)
Which in-life measures can be used to assess the involvement of spinal motor neurons?
The ability to evaluate the effects of disease progression on spinal motor neurons during the in-life phase of a preclinical therapeutic efficacy study has significant advantages. Several approaches are available, including direct visualization of the spinal cord and associated quantitative imaging metrics, as well as downstream measures resulting from denervation of the target muscles.
In vivo Spinal Cord Imaging
Non-invasive imaging, such as in vivo magnetic resonance imaging (MRI), can allow for quantitative measures that reflect the state of spinal motor neurons. Grolez et al. (Grolez, 2018) showed a progressive decrease in the cervical spinal cord thickness in SOD186R transgenic mice. Marcuzzo et al. (Marcuzzo, 2017) found time-dependent changes in spinal cord white matter and gray matter via longitudinal, in vivo diffusion tensor imaging (DTI) in G93A-SOD1 mice. Figini et al. (Figini, 2016) optimized DTI parameters to allow for robust detection of differences between G93A-SOD1 and wild-type mouse spinal cords. Gatto and colleagues (Gatto, 2018) performed in vivo DTI in YFP,G93A‐SOD1 mice, and found significant changes in fractional anisotropy (FA), axial diffusivity (AD), and radial diffusivity (RD) in postnatal day 80 (P80) animals. These in vivo imaging differences between G93A‐SOD1 and control mice were correlated with changes in axonal fluorescence intensity and membrane cellular markers. Underwood et al. (Underwood, 2011) found that diffusion tensor imaging (DTI) could detect axonal spinal cord damage in vivo, where FA values were reduced exclusively in the ventral white matter tracts of the lumbar spinal cord of G93A‐SOD1 mice compared to wild-type littermates, with this effect becoming more pronounced with disease progression and correlating with disease severity. The reduced FA values were limited to white matter tracts arising from the motor neurons, whereas sensory white matter fibers were preserved. In addition, significant changes in axial and radial diffusivity were associated with axonal degeneration measured by electron microscopy (EM).
Non-invasive Imaging of Muscle Atrophy
As an alternative to evaluating the diffusion properties of the spinal cord itself, which can be challenging in mouse models, measuring muscle atrophy resulting from denervation due to axonal degeneration/spinal motor neuron loss via non-invasive imaging is less difficult and is clinically translatable. From a clinical perspective, Wilcox et al. (Wilcox, 2021) showed that volumetric MRI demonstrates reproducibility, temporal responsiveness, and correlation with clinical assessments of muscle function, and suggested that volumetric MRI could be a potential outcome measure of muscle reinnervation. Jenkins and colleagues (Jenkins, 2013; Jenkins, 2018) have used MRI to measure muscle volumetric changes and other imaging parameters (e.g. T2 signal) in ALS. In a pilot study, this group found progressive muscle volume loss in specific muscles in individuals with ALS in whom clinical weakness progressed (Jenkins, 2013). Klickovic et al. (Klickovic, 2024) reported a significant decline in the volume of the dominant hand and head & neck muscles, as well as cross-sectional area (CSA) of the lower limbs, over the individual maximum observation period.
Longitudinal, in vivo measures of muscle atrophy are feasible in animal models using modalities such as MRI and computed tomography (CT). Marcuzzo and colleagues (Marcuzzo, 2011) performed longitudinal quantitative MRI analysis in G93A-SOD1 mice and demonstrated significant losses in hindlimb muscle volume starting at 8 weeks-of-age. Pasetto et al. (Pasetto, 2018) and van der Heyden et al. (van der Heyden, 2020) reported the feasibility of micro-CT measures of the lower hindlimbs in mice as an alternative to MRI.
Our team at Biospective has been leveraging preclinical micro-CT imaging to evaluate muscle atrophy in TDP-43 models of ALS. We have been able to acquire high-resolution images of the lower hindlimbs of TDP-43 ΔNLS (rNLS) mice with short acquisition times. The figure below shows the percent change in muscle volume relative to baseline at 10 weeks from disease induction in our “Low Dox” mouse model.
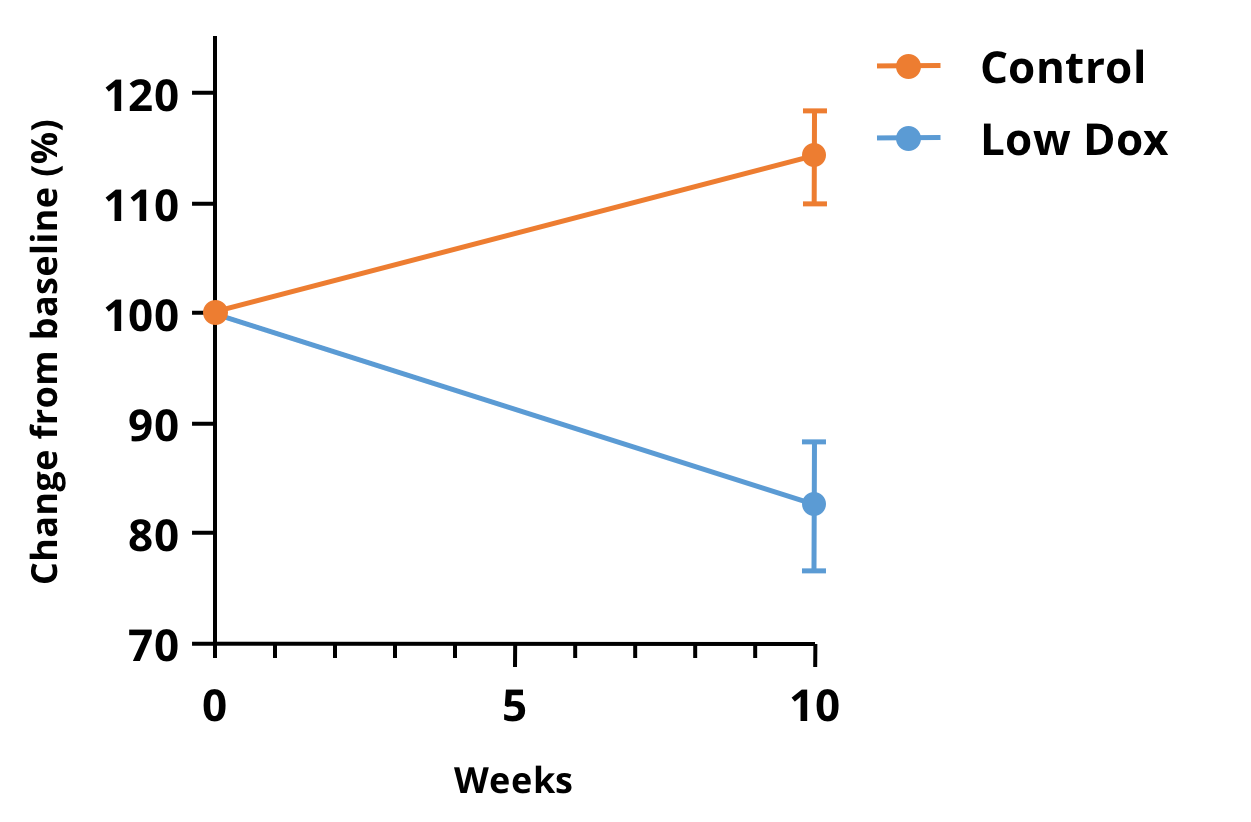
Percent change in the micro-CT imaging-derived volumes of the lower hindlimb muscles in the “Low Dox” hTDP-43ΔNLS mouse model. There is a highly significant difference (p<0.0001) between the Control (tTA) and Low Dox mice over 10 weeks, making this measure attractive as an in-life readout for therapeutic efficacy studies in this model.
Neuromuscular Electrophysiology
Electrophysiology (e.g. electromyography [EMG]) is a standard test used in ALS patients for diagnosis and monitoring of disease. This technique can also be applied to animal models of ALS to assess the neuromuscular functional status.
Spiller et al. (Spiller, 2016) measured the evoked compound muscle action potential (CMAP) amplitude in the gastrocnemius muscle after stimulation of the sciatic nerve in non-transgenic (nTg) and rNLS8 mice that were off the high-dose doxycycline diet (to allow for transgene expression) for several weeks. This group found that CMAP measurements significantly decreased with hTDP-43ΔNLS expression.
Our group at Biospective has performed similar studies using our “Low Dox” version of the rNLS8 model. Consistent with the observations in the “Off Dox” model, we found highly statistically significant reductions in CMAP amplitude in the “Low Dox” model. This test can be performed at multiple time points, and it is well-suited to evaluate the effects of experimental therapeutic agents in this model. Further, evaluation of CMAP complements micro-CT imaging-based measures of muscle atrophy to provide a comprehensive picture of structural and functional neuromuscular changes as a function of disease progression and potential disease modification via therapeutic intervention.
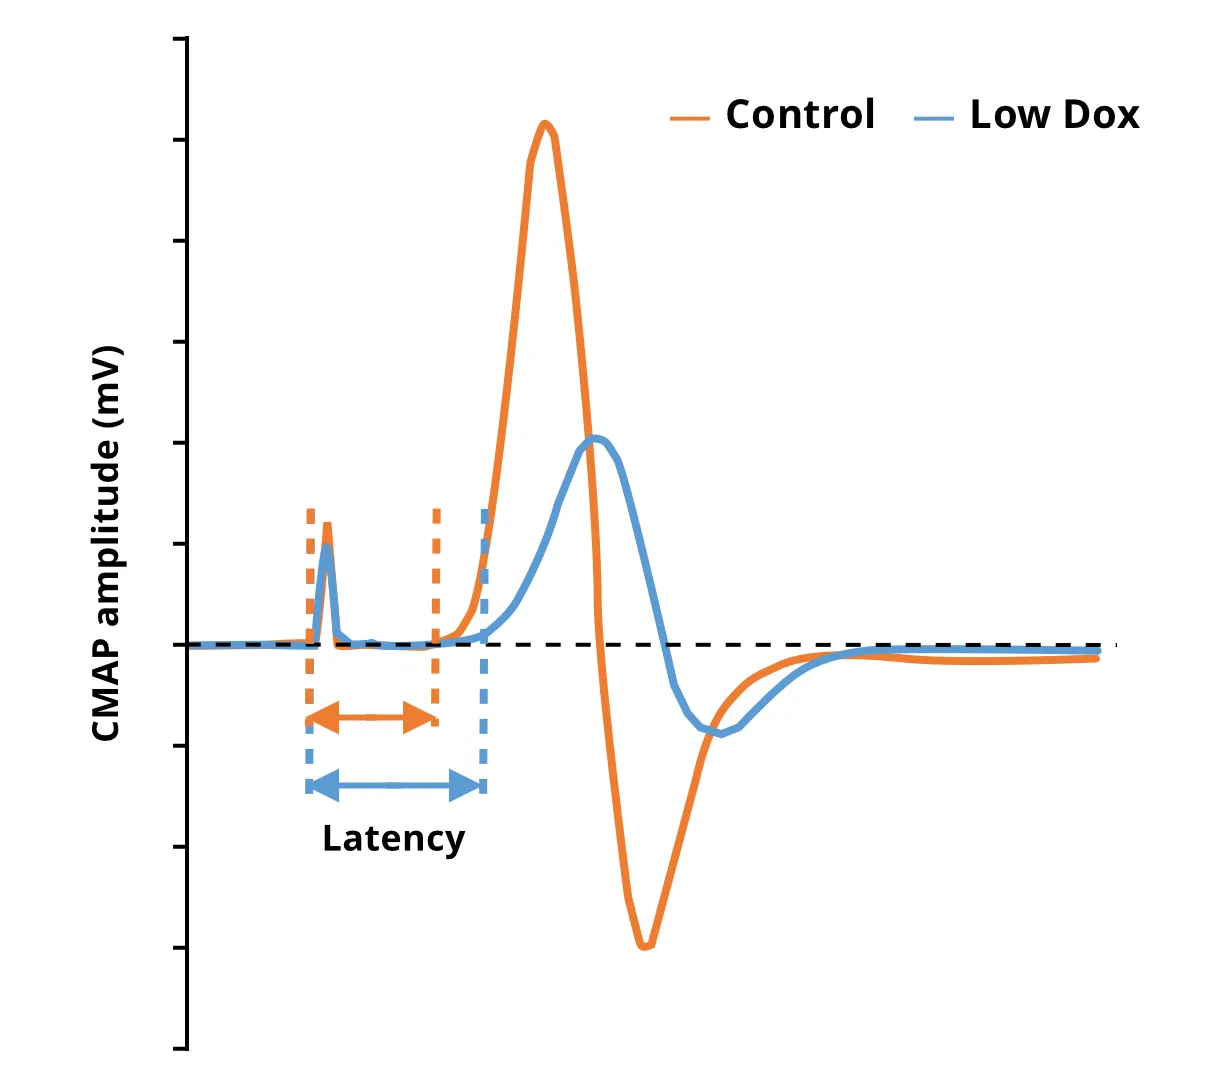
Individual traces showing reduced CMAP amplitude and increased latency in Low Dox hTDP-43ΔNLS mice compared to control mice.
CMAP has also been used to assess motor system function in mutant SOD1 mouse and rat models of ALS:
- In SOD1G93A mice, CMAP declines over time (Mancuso, 2011; Mancuso, 2014)
- In SOD1G93A mice treated with an antisense oligonucleotide (ASO) at 5 weeks-of-age, CMAP is maintained over the next 12 weeks. While the CMAP of control mice is reduced by greater than half over the same time period (McCampbell, 2018)
How can spinal motor neuron involvement in ALS models be assessed on tissue sections?
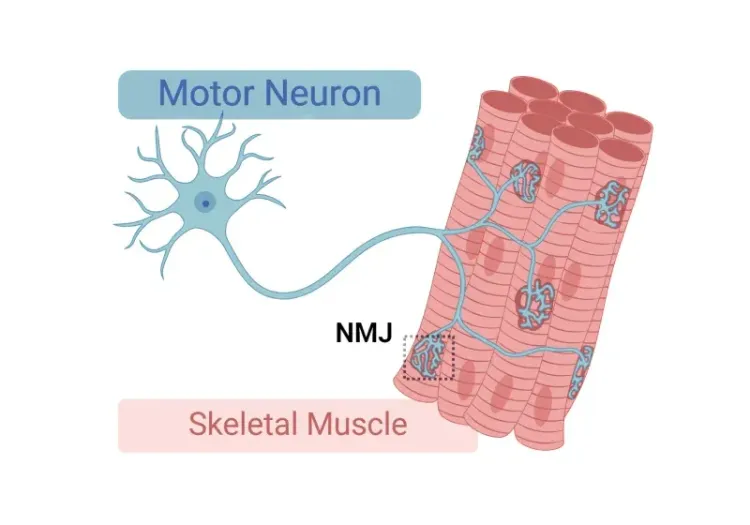
Direct visualization, characterization, and quantification of spinal motor neurons (cell bodies and processes) can be performed on post-mortem tissue sections using immunohistochemistry (IHC) and immunofluorescence (IF) methods. Multiplex immunofluorescence (mIF) is particularly useful given that multiple markers can be evaluated on the same tissue section and co-localization of specific markers can be assessed.
One strategy for imaging of spinal motor neurons on tissue sections is performing neuronal tracing by injecting retrograde tracers which are either fluorescent molecules (e.g. Cholera Toxin Subunit B, Alexa Fluor™ 594 Conjugate; CTB-594) or vectors (e.g. AAV9) expressing reporter genes (e.g. GFP, mCherry). Alternatively, antigens expressed by spinal motor neurons can be immunostained.
Common targets include:
- Choline acetyltransferase (ChAT)
- Vesicular acetylcholine transporter (VAChT)
- Matrix metalloproteinase-9 (MMP-9)
- Type 3 small conductance calcium-activated potassium channel (SK3)
A range of quantitative measures can be derived from digitized tissue sections:
- Number and size of cell bodies & axons can be measured using ChAT- or VAChT-stained tissue
- Terminals can be quantified via the staining of VAChT or other markers (e.g. SV2)
- Fast and slow motor neurons can be evaluated by MMP-9 and SK3, respectively
- Morphological measures, such as soma surface area and various dendritic properties (e.g. total arbor length, mean tree length, maximum dendritic reach, and dendritic complexity), can be obtained from images of stained tissue sections using advanced image processing methods (Fogarty, 2020)
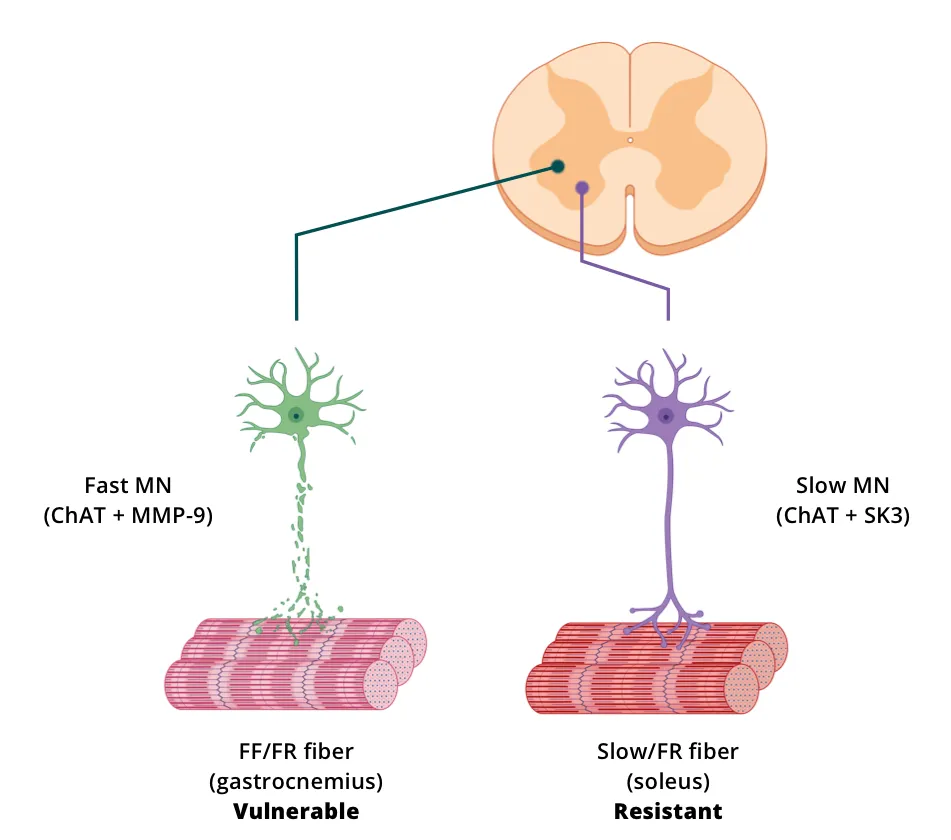
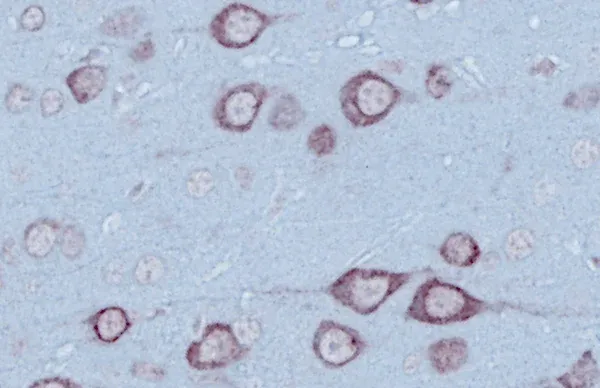
Illustration of strategies for labelling spinal motor neurons in animal models (figure reproduced and adapted from Hur, 2022 under the Creative Commons Attribution License).
Spiller et al. (Spiller, 2016) measured the number of motor neurons and the soma size using VAChT IF and the number of fast motor neurons via VAChT and MMP-9 co-localization in the spinal cords of hTDP-43ΔNLS mice. This group reported that within the spinal cord of rNLS8 mice, “slow motor neurons” survived to end stage, whereas “fast fatigable motor neurons” were lost. They also showed that axonal dieback occurred first from fast-twitch muscle fibers, whereas slow-twitch fibers remained innervated. Following transgene suppression, resistant motor neurons sprouted collaterals to reinnervate previously denervated neuromuscular junctions (NMJs). The selective vulnerability/resistance of motor neurons can result in differential atrophy or electrophysiology of the various muscle groups based on the distribution of fiber types. For example, the superficial gastrocnemius is primarily composed of Type II (fast twitch) fibers, while the soleus is primarily composed of Type I (slow twitch) fibers (Rosser, 1992).
Our team would be happy to answer any questions about the TDP-43 ΔNLS ALS mouse model or provide specific information about the models that we use for therapeutic efficacy studies.
Discover more about our ALS Models
Related Content
Up-to-date information on Amyotrophic Lateral Sclerosis and best practices related to the evaluation of therapeutic agents in ALS animal models.
Autophagy & Neurodegenerative Diseases
An overview of how cellular autophagy plays a role in brain health and neurodegeneration.
Neuromuscular Junction (NMJ) Morphology & ALS Models
Insights into neuromuscular junction (NMJ), its role in amyotrophic lateral sclerosis (ALS), and tools & methods used to study morphological changes in NMJs.
A Guide to ALS Models for Drug Discovery
A Resource for the most effective use of research animal models (mouse & rat models) of Amyotrophic Lateral Sclerosis (ALS) for preclinical testing of therapeutics.
Microglia Morphology in ALS, Alzheimer's Disease & Parkinson's Disease
An overview of microglial morphological analysis and the applications to neurodegenerative disease research and drug discovery & development.
Brain Atrophy Analysis in Mouse Models of Neurodegeneration
Automated in vivo MRI-based quantitative brain atrophy measures (regional brain volumes and cortical thickness) from mouse models of ALS & Parkinson's disease.
TDP-43 ΔNLS (rNLS8) Mice for ALS Drug Development
This resource provides information about the use of the ΔNLS (deltaNLS, hTDP-43ΔNLS, hTDP-43DeltaNLS, dNLS, TDP43 NLS, rNLS8) TDP-43 transgenic mouse model of ALS for preclinical therapeutic studies.