Tau, Rather than Amyloid-β, Drives Neurodegeneration in Alzheimer's Disease (AD) and Mouse Models of AD
Alzheimer's Disease Mouse Models for Preclinical Drug Development
Global preclinical neuroscience CRO specializing in Alzheimer’s disease models and translational biomarkers.
Validated Alzheimer's disease mice (APP/PS1; amyloid-β & tau co-pathology) for drug development studies.
Biospective’s validated Alzheimer’s disease animal models (APP/PS1 transgenic; amyloid-β & tau co-pathology) are optimized for translational neuroscience drug development. Featuring beta amyloid plaques, human tau, neuroinflammation, and neurodegeneration, our AD mouse models enable therapeutic efficacy, MoA, and target-engagement studies. As a leading global neuroscience CRO, Biospective's studies include advanced imaging, cognitive tests, quantitative IHC/IF, and clinically relevant biomarkers tailored for biotech and pharma companies.
Biospective specializes in AD mouse models, with deep expertise in amyloid-beta and tau pathology. As a global preclinical contract research organization, we support biotech and pharmaceutical drug development programs using validated Alzheimer’s disease rodent models for therapeutic efficacy, biodistribution, mechanism-of-action, target engagement, and PK/PD studies across small molecules, antisense oligonucleotides (ASOs), gene therapy (AAVs), antibodies, and other biologics.
Biospective's APP/PS1 models and amyloid-beta & tau co-pathology mouse models recapitulate key features of human Alzheimer’s disease, including misfolded protein aggregation, neuroinflammation, neurodegeneration, and cognitive dysfunction. Studies include translational biomarkers such as MRI and PET imaging, fluid biomarkers including neurofilament light chain (NfL) & cytokines, and quantitative IHC/IF. With fully integrated, end-to-end preclinical services, and over 15 years of experience executing Alzheimer’s disease contract research studies in animal models, Biospective's services enable translational Alzheimer’s disease research from study design through data interpretation.
Amyloid-Beta & Tau Mouse Models – Our Core Expertise
Biospective specializes in disease-relevant Aβ & tau mouse models for Alzheimer's disease drug development.
Amyloid-β and tau protein aggregation and propagation are central to Alzheimer’s disease pathophysiology. Biospective has built specialized capabilities around amyloid and tau AD animal models. Our unique, proprietary "co-pathology" mouse model, featuring both Aβ and human wild-type tau, is a core differentiator of our preclinical CRO services.
These Alzheimer's mouse models enable direct evaluation of target engagement and downstream neurodegenerative processes under pathological conditions. Notably, our co-pathology model recapitulates key features of human Alzheimer’s disease – including Aβ plaques, cerebral amyloid angiopathy (CAA), intracellular tau aggregates, neuroinflammation, and neuron loss. Our animal model portfolio emphasizes reproducibility, well-defined phenotypes, and the integration of cognitive, imaging, biochemical, molecular, and quantitative histopathological endpoints to enable comprehensive in vivo Alzheimer's disease efficacy studies and exploration of mechanism-of-action.
Multiplex immunofluorescence (mIF) image showing Aβ plaques and associated neuroinflammation in our APP/PS1 transgenic mouse model.
APP/PS1 Transgenic Mice
The beta-amyloid pathology that is a hallmark of human Alzheimer's disease can be modeled via overexpression of mutant human amyloid precursor protein (APP) and presenilin 1 (PS1; PSEN1) in transgenic mice. Similar to human disease, the evolution of the pathology increases with age.
The APP/PS1 model that we use for preclinical evaluation of the efficacy of experimental, disease-modifying therapeutic agents is highly reproducible and replicates several key features of human AD. These mice show progressive development amyloid-beta (Aβ) plaques, cerebrovascular pathology, and neuroinflammation. The response to therapeutic intervention can be assessed by several quantitative readouts, including advanced image analysis of multiplex immunofluorescence staining of digitized brain tissue sections.
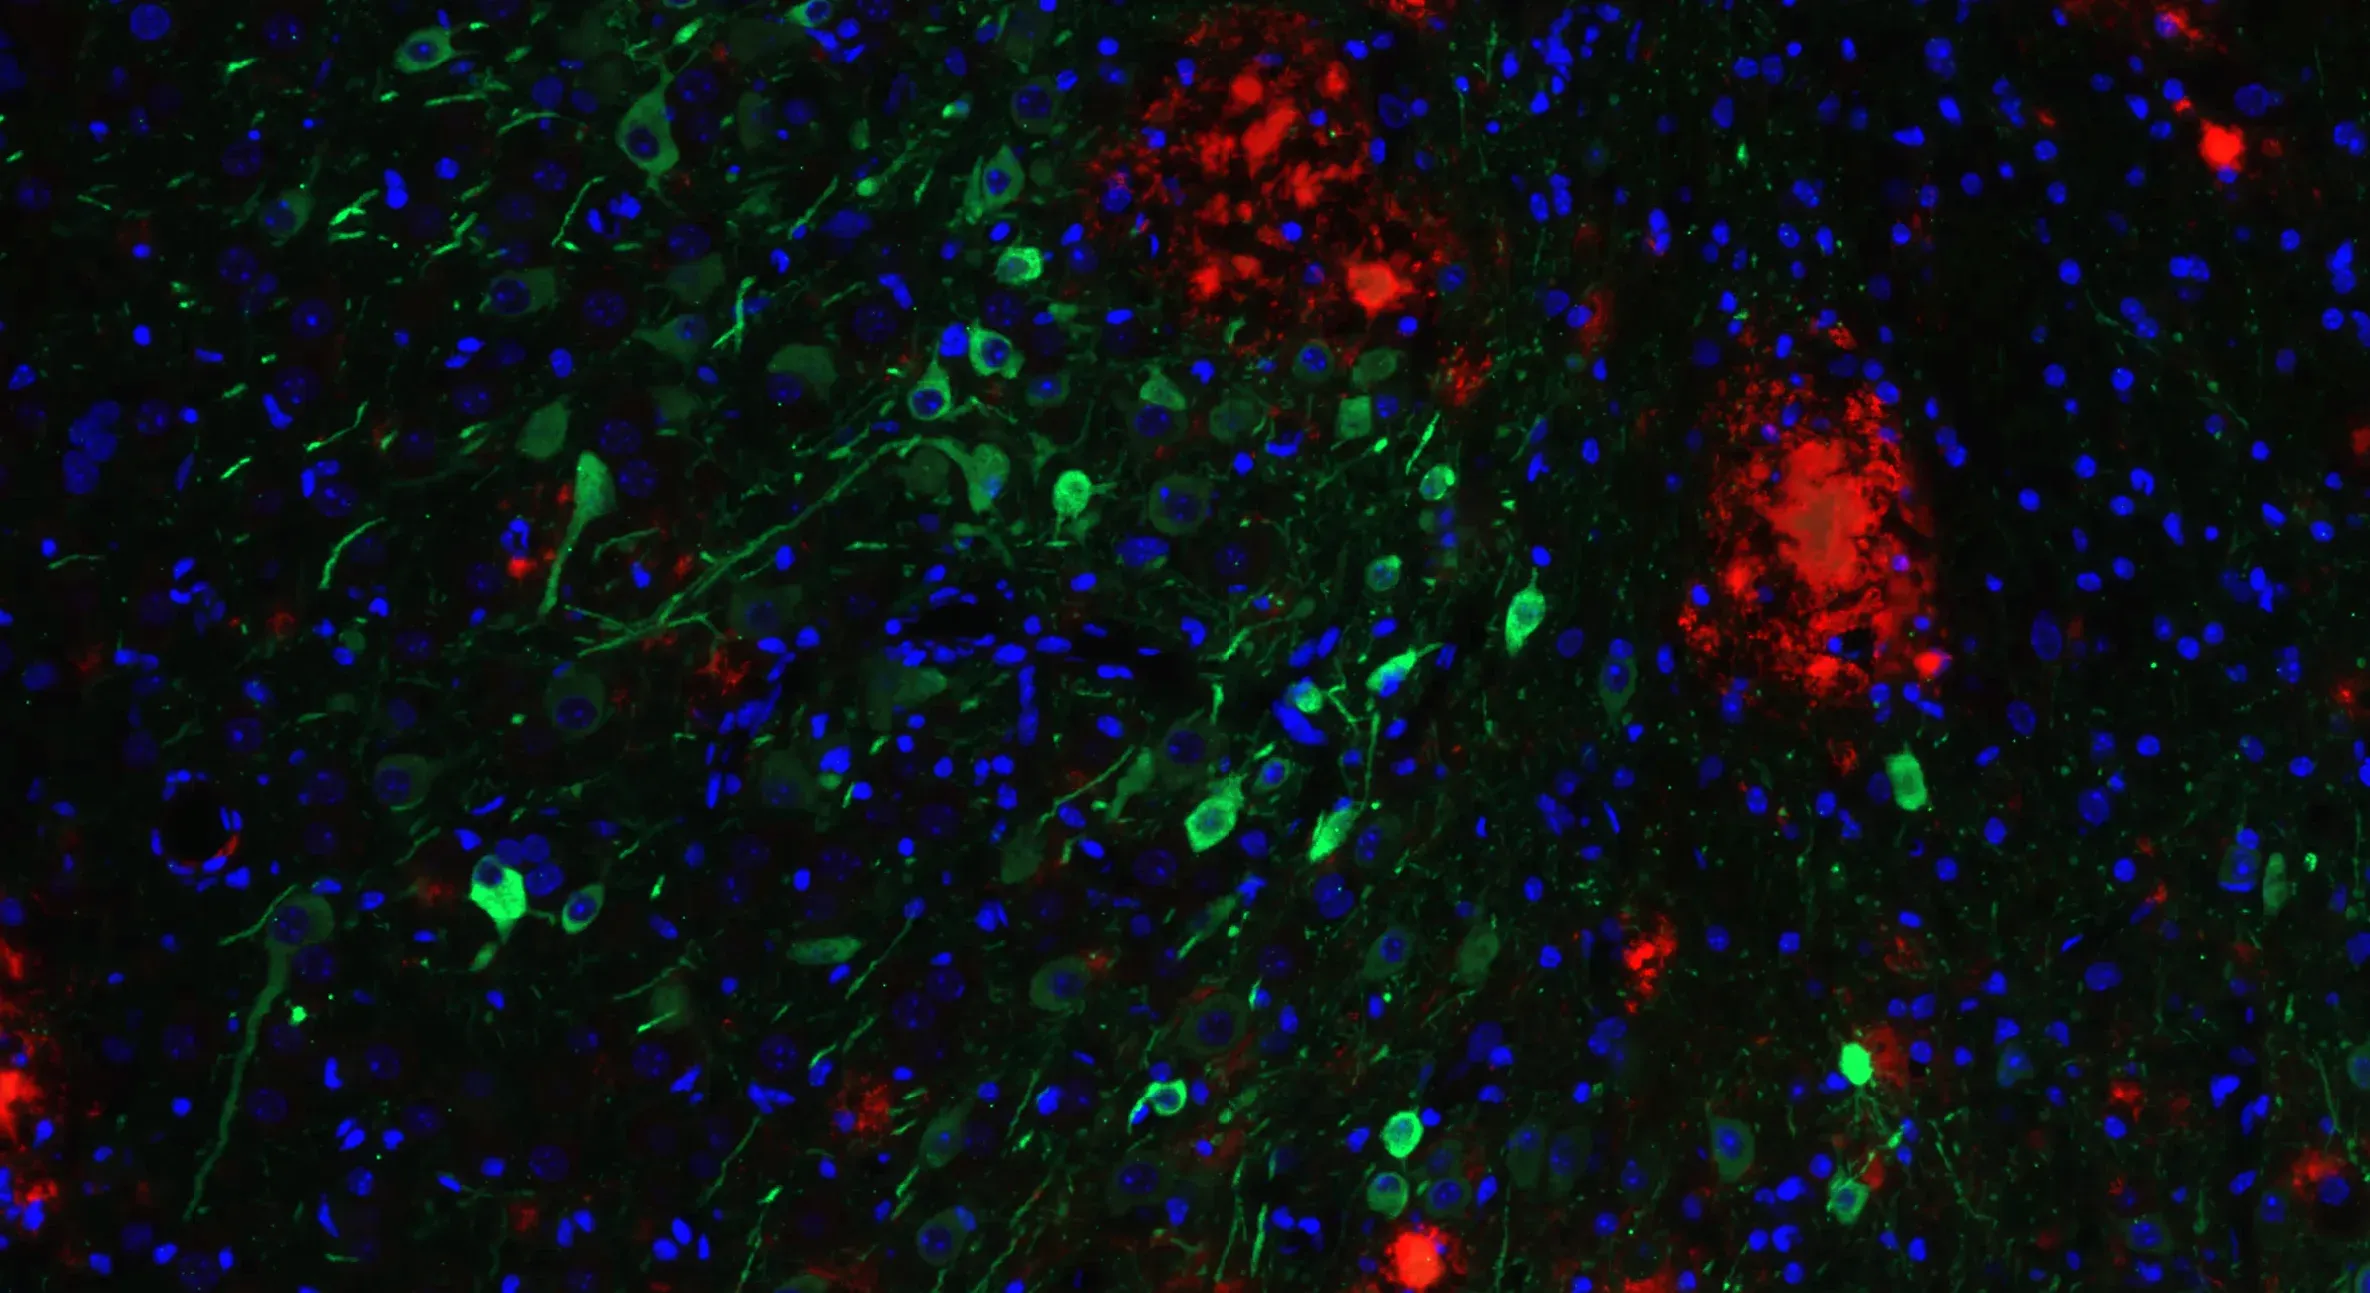
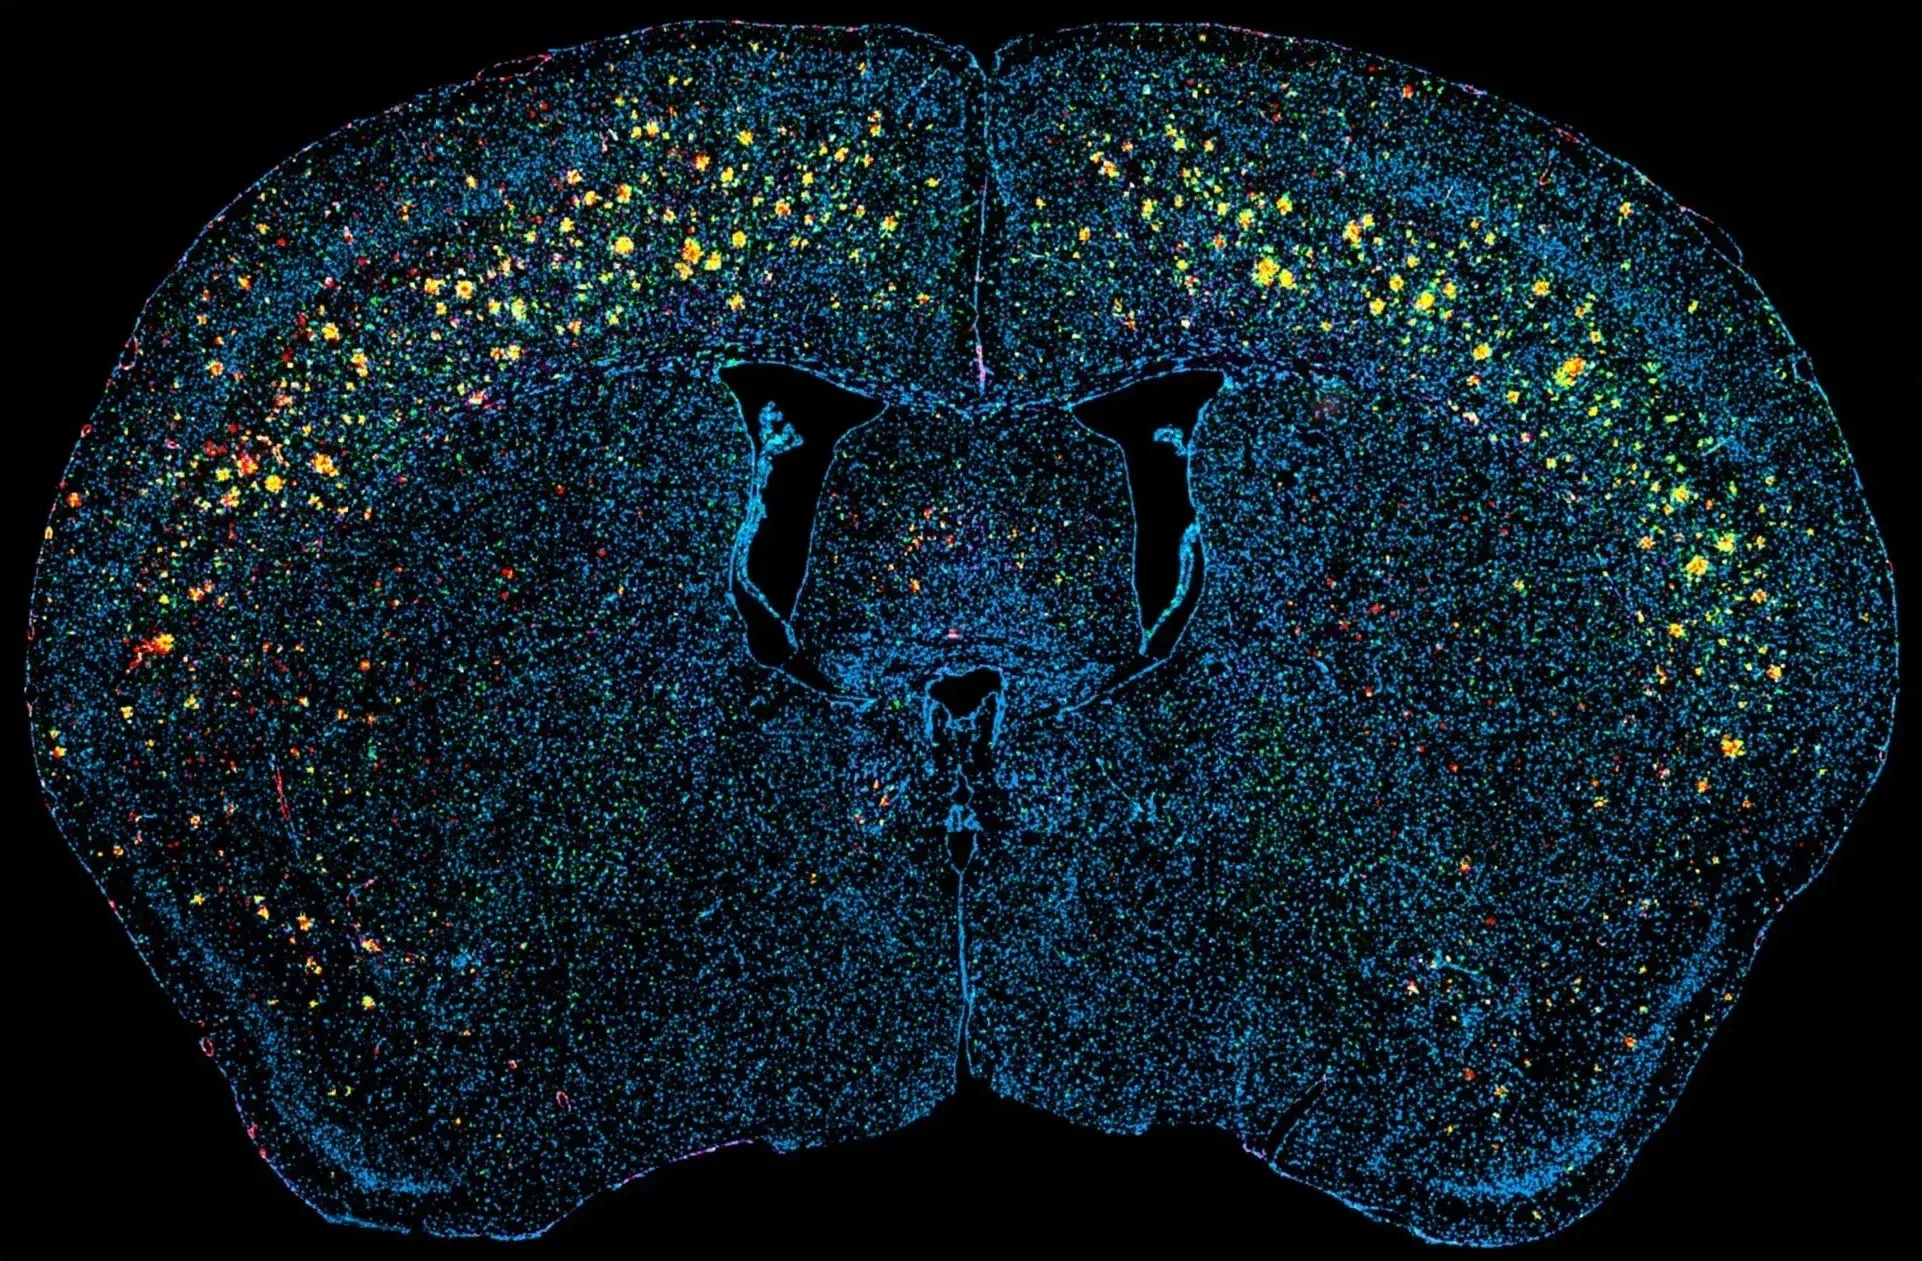
Multiplex immunofluorescence (mIF) image showing Aβ (red) and tau (green) in Biospective's Alzheimer's disease co-pathology model.
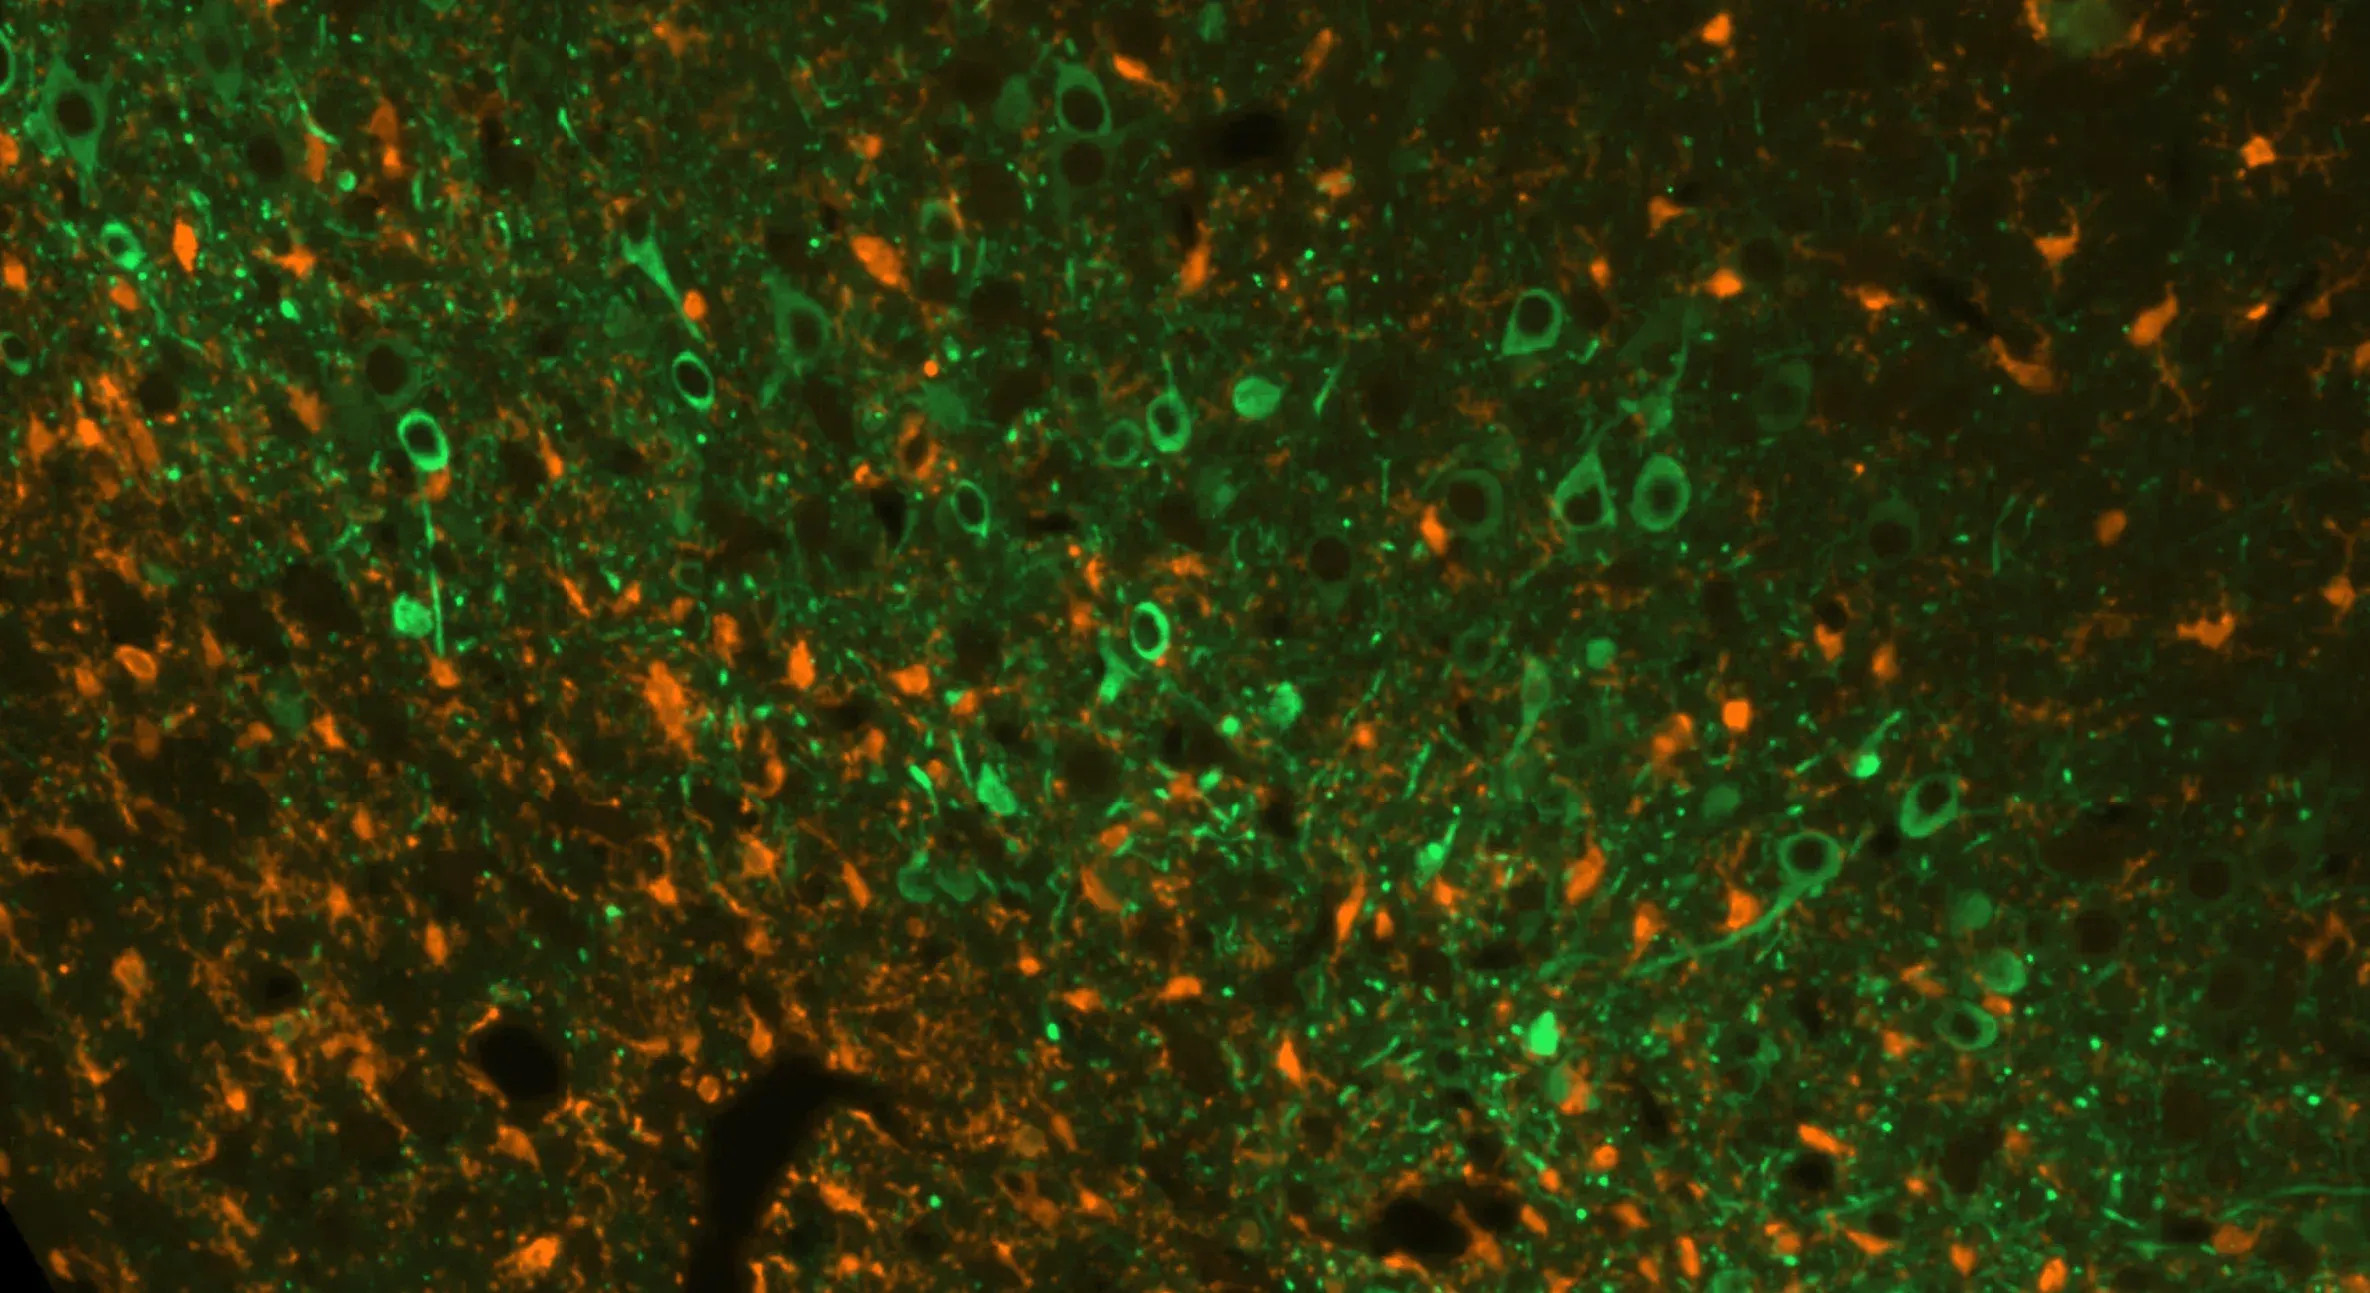
Multiplex immunofluorescence (mIF) image showing tau (green) and microglia (orange) in Biospective's Alzheimer's disease co-pathology model.
Amyloid-β & Tau Co-Pathology Mice
Our amyloid-beta (Aβ) and tau co-pathology mouse model captures two defining features of Alzheimer’s disease — Aβ plaque accumulation and tau-associated neurodegeneration — by combining transgenic and viral vector-based methodologies. This model offers a robust and translationally relevant platform for investigating disease mechanisms & assessing the efficacy of disease-modifying therapeutic interventions for Alzheimer's disease.
The amyloid-β pathology is established using APP/PS1 transgenic mice, which exhibit age-dependent Aβ plaque deposition. To induce tauopathy, adeno-associated virus (AAV) vectors encoding wild-type human tau are delivered via stereotaxic injection into disease-relevant brain regions. This targeted expression leads to the accumulation of phosphorylated tau aggregates within neuronal soma and processes. This co-pathology model demonstrates marked neuroinflammation, neurodegeneration, and associated functional impairments, reflecting complex pathological interactions relevant to Alzheimer's disease.
Translational Pathology and Biomarkers in Alzheimer’s Disease Models
Biospective has established a broad range of clinically-relevant disease markers to facilitate translation to clinical studies.
As a Preclinical Neuroscience CRO, we design our AD models with translational relevance to mirror key aspects of the human disease. A major differentiator of Biospective is our focus on translational biomarkers that align preclinical findings with clinical outcomes – including advanced neuroimaging and fluid biomarkers. We incorporate:
-
Amyloid-β plaque analysis (pathology)
-
Tau–related biomarkers (pathology and spread)
-
Neuroinflammation markers (microglial/astrocyte activation)
-
Neurodegeneration endpoints (neuron loss, atrophy)
-
Mechanism-of-action confirmation (target/pathway engagement)
Our modeling and biomarker strategies ensure that preclinical successes meaningfully predict clinical potential, de-risking the transition from animal studies to human trials.
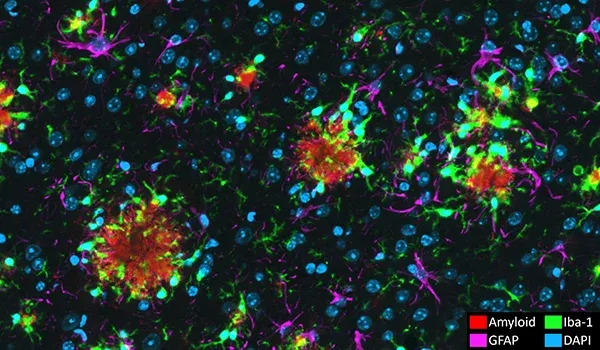
Aβ plaques surrounded by activated microglia and reactive astrocytes in APP/PS1 mouse model.
Amyloid-β Plaques & Cerebrovascular Pathology
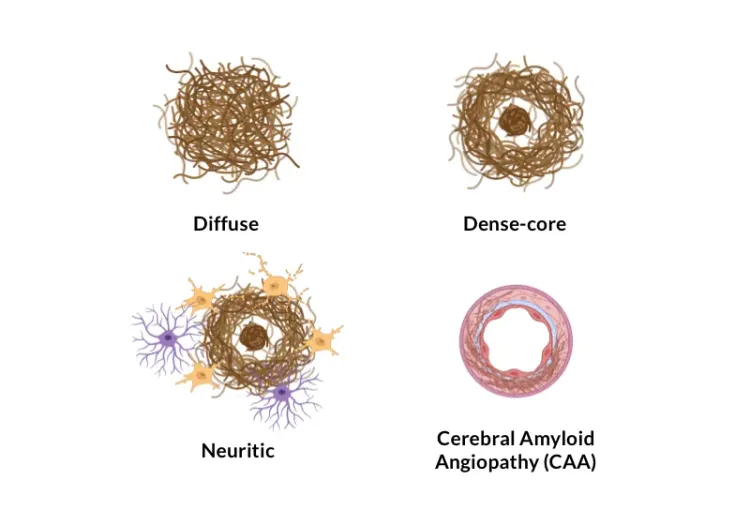
Extracellular plaques and cerebrovascular deposits of aggregated amyloid-β are neuropathologic hallmarks of Alzheimer's disease (Serrano-Pozo, 2011). Our APP/PS1 mouse model shows time-dependent increases in amyloid-β pathology (including diffuse, dense-core, and neuritic plaques, intracellular amyloid-β, and cerebrovascular pathology). The Aβ pathology progresses in a well-defined spatiotemporal pattern and can be quantified using sophisticated algorithms developed by our team.
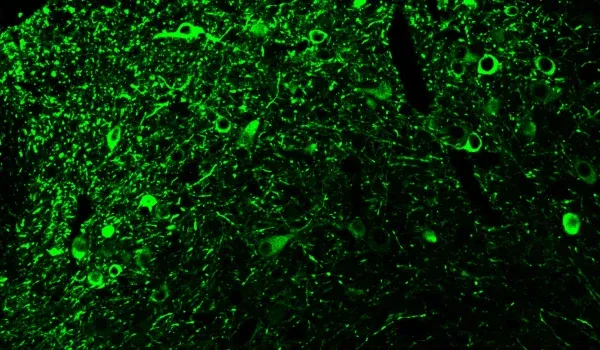
Phosphorylated tau stained with AT8 in APP/PS1/hTau co-pathology mouse model.
Tau Pathology
In addition to amyloid-β, tau is a key misfolded protein found in Alzheimer's disease. Tau is thought to be the primary driver of some of the clinical and neuroimaging features of AD (Lew, 2021; Carbonell, 2025). Our APP/PS1/human Tau "co-pathology" model demonstrates both amyloid-β and tau pathology. Phosphorylated tau staining (with various phosphorylation sites) is observed in both cell bodies and processes.
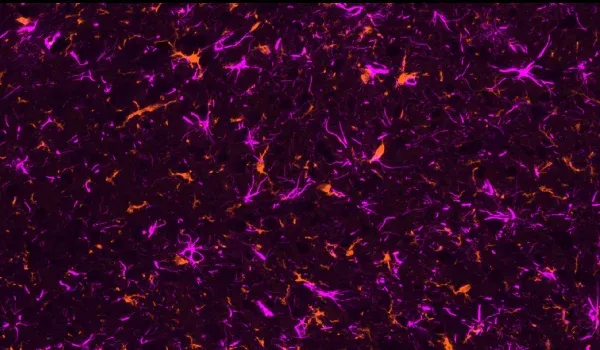
Microglia (Iba1; orange) and astrocytes (GFAP; violet) demonstrating neuroinflammation in the APP/PS1 mouse model.
Activated Microglia & Reactive Astrocytes
Neuroinflammatory cells, including activated microglia and reactive astrocytes, are found in close proximity to misfolded amyloid-β and tau (Minter, 2015; Chen and Yu, 2023). In our APP/PS1 mouse model, we have demonstrated a spatial and temporal relationship between Aβ plaques, activated microglia, and non-activated microglia, as well as between Aβ plaques and hypertrophic & non-hypertrophic astrocytes. We also observe a strong microgliosis and astrogliosis in relation to phosphorylated tau in our APP/PS1/hTau co-pathology model.
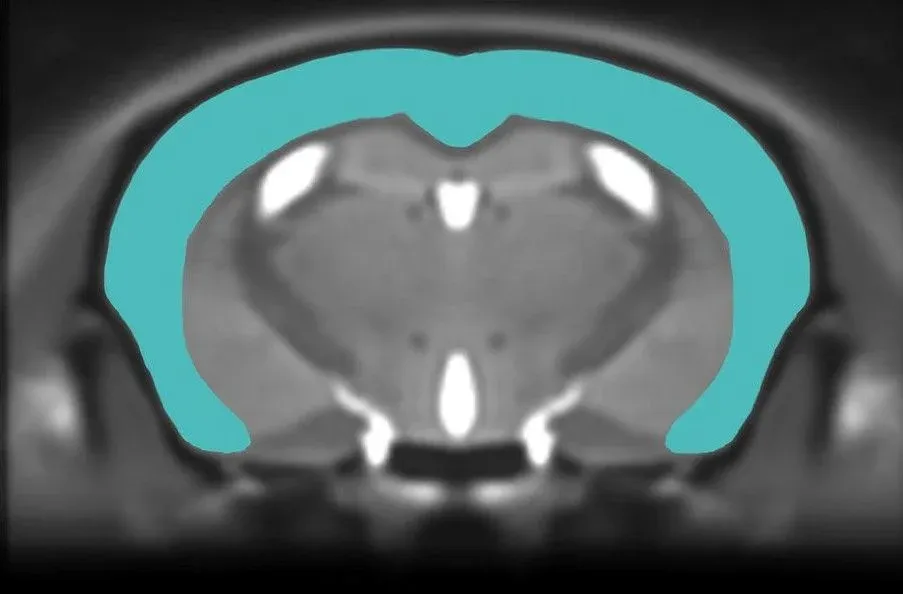
Anatomical MRI of mouse brain showing segmented cerebral cortex for measurement of cortical thickness.
Regional Brain Atrophy
Multi-modality imaging biomarkers are widely used in clinical trials of Alzheimer's disease and tauopathies. MRI-derived regional volume and cortical thickness measures are highly sensitive to brain atrophy and allow for monitoring disease progression over time in Alzheimer's disease. Using non-invasive, in vivo whole brain MRI acquisition combined with advanced, fully-automated image processing & analysis, we have shown highly significant regional brain atrophy, specifically related to tau pathology, thereby serving as a robust in-life measure of neurodegeneration and a translational biomarker.
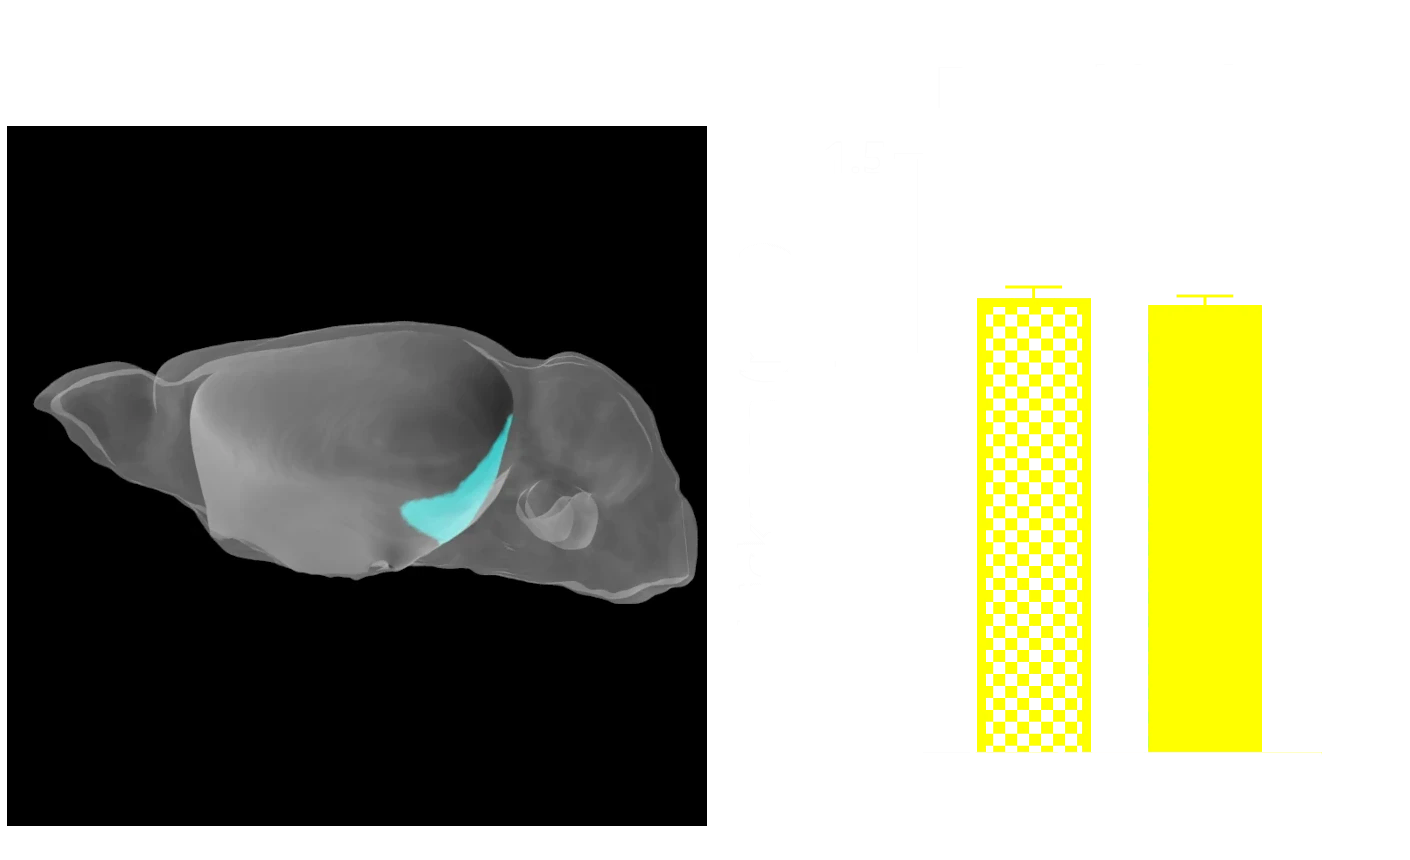
Alzheimer's Disease Mouse Models & Neurodegeneration - A Translational Research Study
Email
Click to copy link
An Interactive Data Presentation exploring the complex relationship between amyloid-β, tau, and brain atrophy in human AD and our Alzheimer's disease mouse models.
In this presentation, we report our MRI analysis of AD from the ADNI study and draw comparisons with findings from our amyloid-β/hTau co-pathology mouse model. We demonstrate that a mouse model featuring both tau and amyloid-β pathologies can mimic neurodegeneration and brain atrophy similar to human disease.
How to use Our Interactive Viewer
Navigate through the “Image Story” via the left-hand panel or the on-screen arrows. You can pan around high-resolution microscopy images with your mouse, and zoom in/out using the scroll wheel or the +/- controls. The Control Panel (top-right) allows toggling of image channels and segmentation overlays. For the best experience, we recommend switching to full-screen mode. This Interactive Presentation enables you to explore the model’s neuropathology and associated functional deficits in detail, as if looking directly down the microscope.


This Image Interactive describes Biospetive's research demonstrating that tau, rather than amyloid-β, drives neurodegeneration in both human Alzheimer's Disease and in AD mouse models.
 Click to copy link
Why Choose Biospective as Your Alzheimer’s Disease CRO?
Biospective is a neuroscience CRO with a focus on Alzheimer’s disease animal models, strong scientific expertise, and extensive experience conducting preclinical studies with Amyloid-β and Tau models.
-
Specialized Alzheimer's Disease CRO: Focused on Alzheimer’s disease and neurodegenerative disease models, not a generalist animal provider.
-
Multiple Validated Alzheimer's Disease Models: Transgenic models and AAV induced mouse models of Alzheimer’s disease are readily available for studies.
-
Amyloid-Beta and Tau Expertise: Deep scientific expertise in Aβ and tau biology and pathology, the central misfolded proteins in AD.
-
Integrated Services: Fully integrated preclinical services from study design to data interpretation, ensuring seamless execution.
-
Proven Efficacy Data: Industry-standard AD models efficacy datasets and extensive historical controls for robust benchmarking.
-
Accelerated Timelines: Rapid study initiation and efficient workflows to compress timelines without sacrificing quality.
-
Translational Biomarkers: Advanced biomarkers (MRI, PET imaging, CSF/blood assays) that bridge preclinical findings to clinical outcomes.
- Flexible & Customized Study Designs: Our scientists work with your team to customize the study design to best fit your goals.
-
Global Support: Experience supporting biotech and pharma clients worldwide, with responsive project management and communication.
Our scientists work as an extension of your internal team, collaborating closely to ensure scientific rigor, reproducibility, and translational relevance at every stage of your Alzheimer’s disease research program.
End-to-End Alzheimer’s Disease Preclinical CRO Services
Biospective offers fully integrated preclinical Alzheimer's disease contract research services.
-
Study design & model selection – expert guidance on choosing the right AD model and designing robust studies
-
In vivo efficacy studies – execution of treatment studies with comprehensive monitoring of outcomes
-
Biodistribution & PK/PD – analysis of drug distribution and pharmacokinetics/pharmacodynamics in CNS and periphery
-
Target engagement assays – confirmation that the therapeutic hits its molecular target (e.g. Aβ reduction, tau reduction, pathway modulation)
-
Behavioral analysis – cognitive testing (Novel Object Recognition, Y-maze, etc.)
-
In vivo multi-modality imaging – MRI, PET, SPECT, fluorescence, and bioluminescence imaging to track disease and treatment effects
-
Immunoassays – biomarker quantification in CSF, blood, and tissue (e.g. NfL, cytokines, chemokines)
-
Immunohistochemistry (IHC) & multiplex immunofluorescence (mIF) – post-mortem tissue staining & quantitative image analysis to assess pathology and therapeutic impact
-
Data analysis & reporting – rigorous quantitative analysis, statistics, and comprehensive reporting by our scientists
This end-to-end approach minimizes handoffs, accelerates timelines, and reduces risk for our sponsors by keeping all aspects of the study under one expert team.
How are Alzheimer's Disease Mouse Models Used in Drug Development?
We work closely with our biotech and pharma sponsors to:
-
Evaluate therapeutic efficacy and dose-response in Alzheimer’s models
-
Assess target engagement and disease-modifying effects
-
Support translational biomarker strategies, including imaging and fluid biomarkers for clinical readiness
Our Alzheimer’s disease mouse models are optimized for in vivo testing of multiple therapeutic modalities, including both traditional and advanced approaches:
Small Molecules
-
Brain penetration and PK/PD profile
-
Behavioral efficacy on cognitive symptoms
-
Reduction of pathology (Aβ plaques, tau aggregates, neuron loss)
RNA-Targeted Therapies
- Target knockdown verification (e.g. mRNA or protein level reduction)
-
CNS biodistribution of ASOs/siRNA
-
Translational biomarker readouts to confirm pathway engagement
Gene Therapy & Viral Vectors
-
Transgene expression levels in target regions
-
Regional biodistribution of viral vectors (e.g. AAV spread)
-
Functional rescue or disease modification outcomes (behavioral and pathological improvements)
Antibodies & Biologics
-
CNS exposure and penetration of biologics (e.g. BBB engagement)
-
Aβ and Tau aggregation clearance or reduction
-
Mechanism-of-action validation (target binding, downstream signaling changes)
Learn more about our in-depth characterization of these Alzheimer's disease mouse models, our validated outcome measures, and the full scope of our Alzheimer's disease CRO services.
Related Content
Up-to-date information on Alzheimer's disease and best practices related to the evaluation of therapeutic agents in Alzheimer's disease animal models.
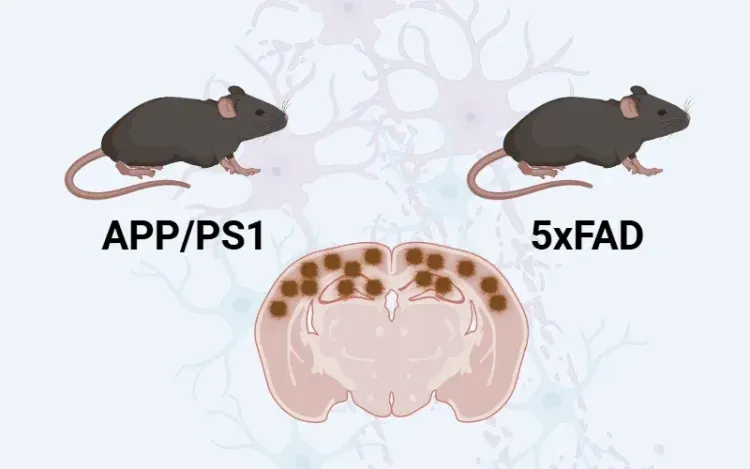
5xFAD Mice & APP/PS1 Mice – Alzheimer Disease Mouse Models
A comparison of 5xFAD and APP/PS1 mouse models of Alzheimer’s disease, including amyloid-beta pathology, neuroinflammation, and cerebrovascular disease.
Amyloid-β & Inflammatory Microenvironment in Alzheimer's Mice
We have analyzed the complex spatial relationships between β-amyloid plaques, activated & resting microglia, and astrocytes in an APP/PS1 transgenic model.
Amyloid-β Plaque Analysis in Alzheimer's Disease
Overview of methods to classify & quantify Aβ plaques in brain tissue sections from humans & Alzheimer’s disease animal models (transgenic mice & rats).
Astrocytes & Amyloid-β Mouse Models of Alzheimer's Disease
Analysis of astrocyte morphology in the amyloid-β plaque microenvironment provides a sensitive measure of disease progression in transgenic mice.
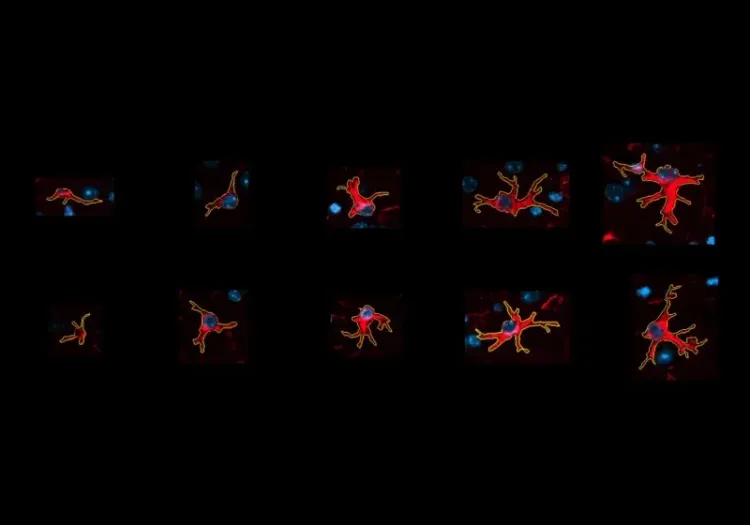
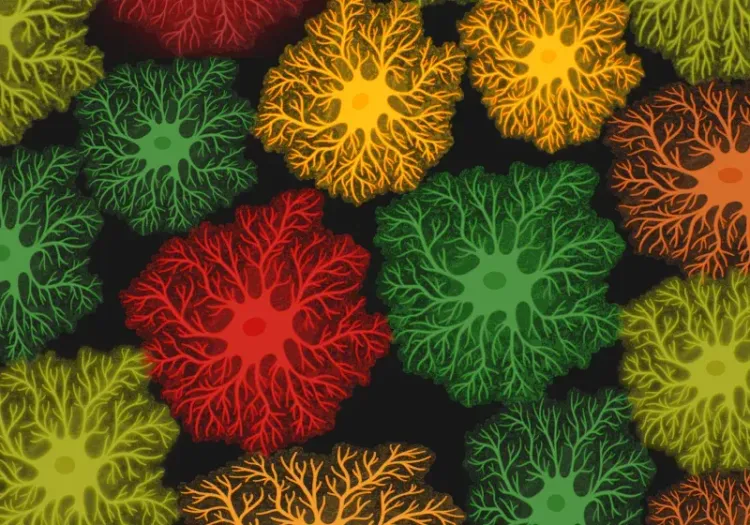
Microglia Morphology in ALS, Alzheimer's Disease & Parkinson's Disease
An overview of microglial morphological analysis and the applications to neurodegenerative disease research and drug discovery & development.
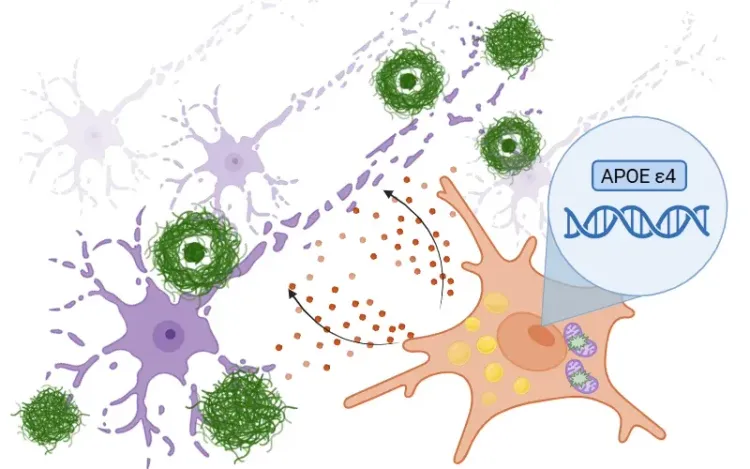
APOE4, Microglia & Alzheimer’s Disease
An overview of how ApoE4 influences microglial activity in Alzheimer's disease and the development of targeted therapeutics.
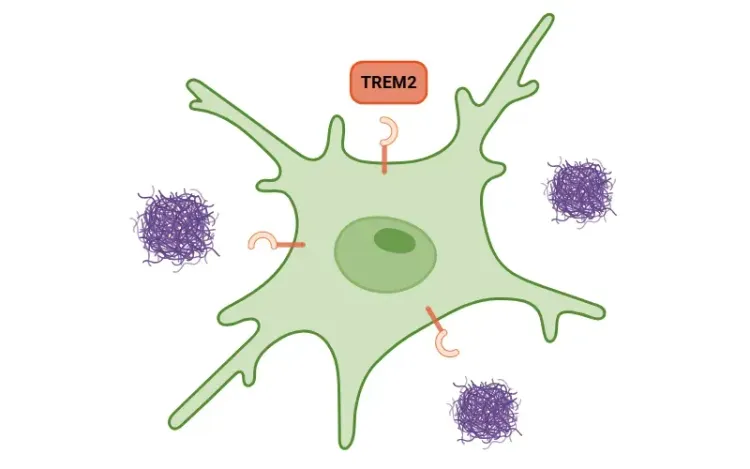
TREM2, Microglia and Neuroinflammation
An overview of TREM2, its role in microglia, links to neurodegenerative diseases, and potential treatment implications.
NLRP3 Inflammasome and Neurodegenerative Diseases
An overview of the NLRP3 inflammasome and its role in neurodegenerative diseases, including Alzheimer's disease, Parkinson’s disease, and ALS.
Astrocyte Morphology in Alzheimer's Disease
An overview of astrocyte morphological analysis and the applications to neurodegenerative disease research and drug discovery & development.
Autophagy & Neurodegenerative Diseases
An overview of how cellular autophagy plays a role in brain health and neurodegeneration.
Impaired Microglia Autophagy in Neurodegenerative Diseases
How impaired microglia autophagy contributes to the progression of neurodegenerative diseases.
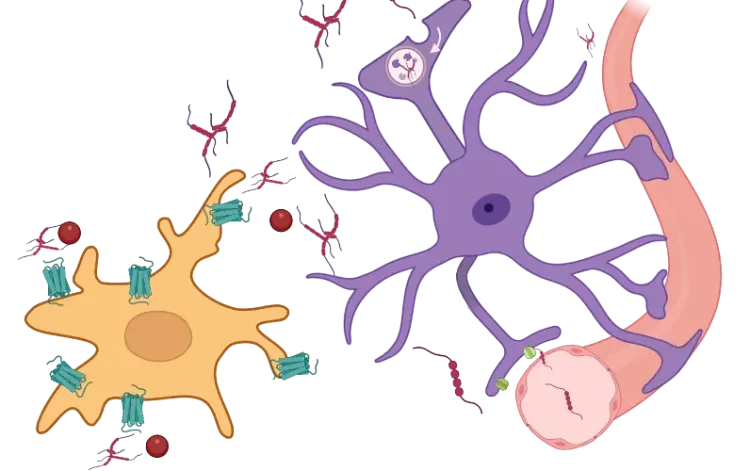
Microglia, Astrocytes & Tau in Neurodegenerative Diseases
How glial-driven neuroinflammation fuels tau aggregation, propagation, and neuronal loss in Alzheimer’s disease and other tauopathies.
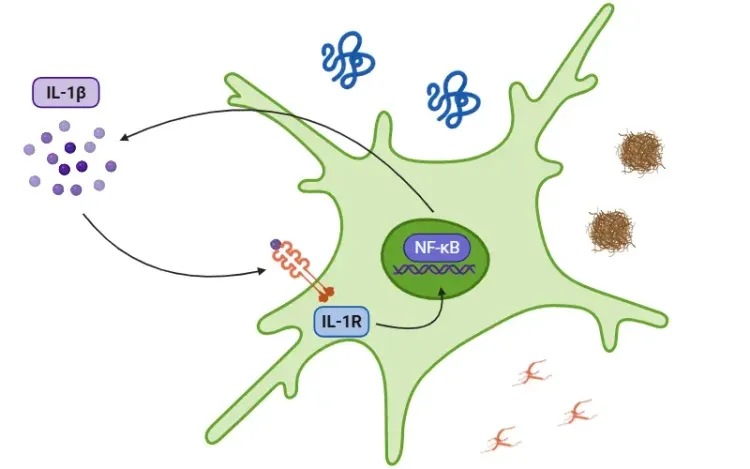
Interleukin-1 Beta (IL-1β) and Neurodegenerative Diseases
The role of IL-1beta in neurodegenerative diseases, including Alzheimer's disease (AD), Parkinson’s disease (PD), and amyotrophic lateral sclerosis (ALS).
Lysosome Dysfunction in Microglia & Astrocytes
An overview of lysosomal dysfunction in microglia & astrocytes, and its role in neurodegenerative diseases.
Microglial Senescence and Neurodegenerative Diseases
An overview of microglial senescence and its role in neurodegenerative diseases, including Alzheimer’s disease (AD) and Parkinson’s disease (PD).
Mitochondrial Dysfunction in Microglia & Astrocytes
The role of mitochondrial dysfunction in microglia and astrocytes in neurodegenerative diseases, including Alzheimer’s disease, Parkinson’s disease, and ALS.