Characterization of a New Amyloid-β & Tau Co-Pathology Mouse Model of Alzheimer's Disease
Amyloid-Beta & Tau Mouse Model of Alzheimer's Disease
Validated amyloid-β & tau "co-pathology" model of Alzheimer's disease supported by translational biomarkers.
Preclinical neuroscience CRO with unique Aβ & tau models expertise for Alzheimer's drug development.
Biospective's Amyloid-β & Tau co-pathology mouse model of Alzheimer’s disease combines APP/PS1 transgenic mice with an AAV vector expressing human wild-type tau. This unique AD model demonstrates Aβ plaques, CAA, phosphorylated tau aggregates, neurodegeneration, and neuroinflammation. Biospective offers this validated animal model as part of its preclinical CRO services, supporting efficacy testing and target engagement studies using translational endpoints.
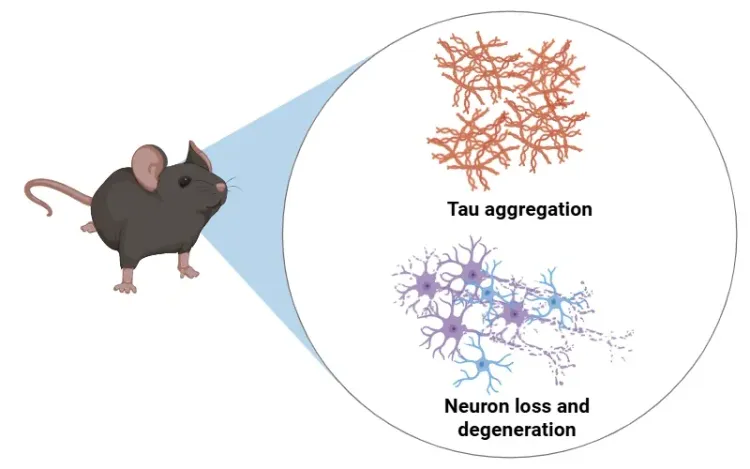
In this robust mouse model of Alzheimer's disease, adeno-associated virus (AAV) vectors expressing human wild-type tau are injected into the brains of APP/PS1 transgenic mice. The resulting model demonstrates amyloid-β plaques, cerebral amyloid angiopathy (CAA), intracellular phosphorylated tau aggregates, neuronal loss, and neuroinflammation (activated microglia and astrocytes), reminiscent of the pathology observed in human AD.
Biospective has extensively characterized this model and leverages it as an ideal platform for preclinical drug development, supporting high-throughput efficacy testing, mechanism-of-action studies, and target engagement evaluation for novel Alzheimer’s therapeutics. As a specialized neuroscience CRO, we provide fully integrated, end-to-end services – from surgical model induction and in vivo imaging to biomarker assays and quantitative pathology – delivering high-quality, decision-ready data for biotech and pharma clients worldwide.
Overview of the Aβ & Tau Co-Pathology (APP/PS1/hTau) Model of Alzheimer's Disease
A unique animal model of Alzheimer's disease optimized for preclinical drug development.
In this model, adeno-associated virus (AAV) vectors encoding human wild-type tau undergo stereotaxic injection into disease-relevant brain regions of APP/PS1 mice. This targeted brain delivery drives high levels of toxic tau expression on the background of amyloid-beta expression, triggering a cascade of Alzheimer’s-like pathology. This rodent model faithfully recapitulates key hallmarks of AD, including:
-
Aβ Plaques: Progressive development of extracellular plaques with a well-defined spatiotemporal pattern.
- Cerebral Amyloid Angiopathy (CAA): Cerebrovascular amyloid pathology in leptomeningeal vessels and penetrating arterioles.
-
Tau aggregation: Accumulation of pathogenic tau (including phosphorylated tau), forming tangle–like intracellular inclusions in affected brain regions.
-
Robust neuroinflammation: Pronounced activation of microglia and reactive astrocytes in areas of tau pathology, mirroring the neuroinflammatory response observed in Alzheimer’s disease.
By reproducing these pathological features, the APP/PS1/hTau model provides a disease-relevant platform to evaluate therapeutic interventions under conditions that mirror the clinical hallmarks of human Alzheimer’s disease.
This APP/PS1/hTau model shows progressive pathology development with a well-defined timeline. These mice develop measurable phospho-tau inclusions, neuronal loss, activated microglia, and reactive astrocytes within several weeks of vector injection. In parallel, Aβ plaques and CAA appear with a spatial distribution dependent on the age of the mice at study start. The relatively fast onset of tau-related pathology enables shorter studies and more efficient go/no-go decisions in preclinical Alzheimer's disease research programs without sacrificing biological relevance.
1/5
Amyloid-β & Tau Co-Pathology Mouse Model (APP/PS1/hTau) Generation & Study Timeline
Our expert team employs state-of-the-art, precise stereotaxic surgery techniques to induce tau pathology.
We inject high-titer AAV vectors bilaterally into AD-relevant brain regions. For these surgeries, we utilize digital stereotaxic systems with automated microinjectors to ensure accurate targeting and controlled viral delivery. This refined methodology yields consistent tau expression.
Illustration showing Biospective's process to induce tau pathology in APP/PS1 mice to generate a robust and translational model of Alzheimer's disease.
For this specific model, we typically use APP/PS1 mice at ~6 months-of-age (although younger or older mice can be used). The in vivo phase of the study typically lasts several weeks to months (depending on the starting age of the mice and the desired stage of disease). In-life readouts, such as MRI brain atrophy, show significant effects at 6 weeks following tau AAV injections. As such, generation of clinically-relevant readouts can be provided in a relatively short time frame.
Validated Endpoints & Translational Biomarkers
Biospective has implemented a suite of validated endpoints and Alzheimer's disease relevant biomarkers to enable clinical advancement of therapeutic programs.
To fully characterize the APP/PS1/hTau model and assess treatment outcomes, Biospective has validated a broad spectrum of endpoints – encompassing behavioral assays, neuroimaging, fluid biomarkers, and histopathology. This comprehensive approach yields robust, quantitative readouts for both efficacy and mechanism-of-action in preclinical studies. Key validated endpoints in our co-pathology model include:
Imaging, Fluid & Tissue Biomarkers
-
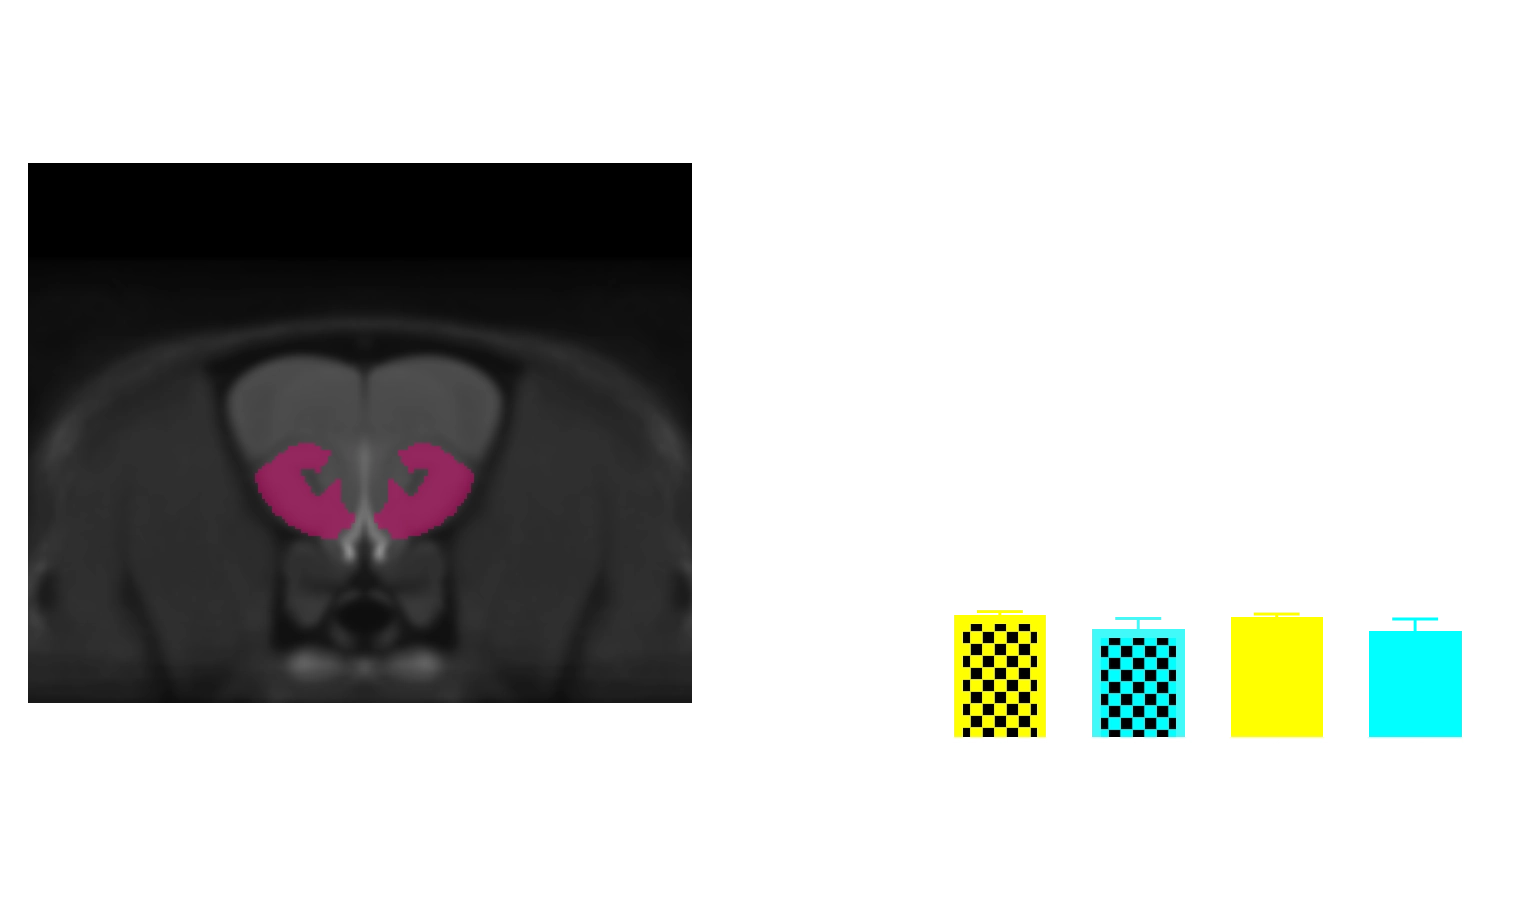
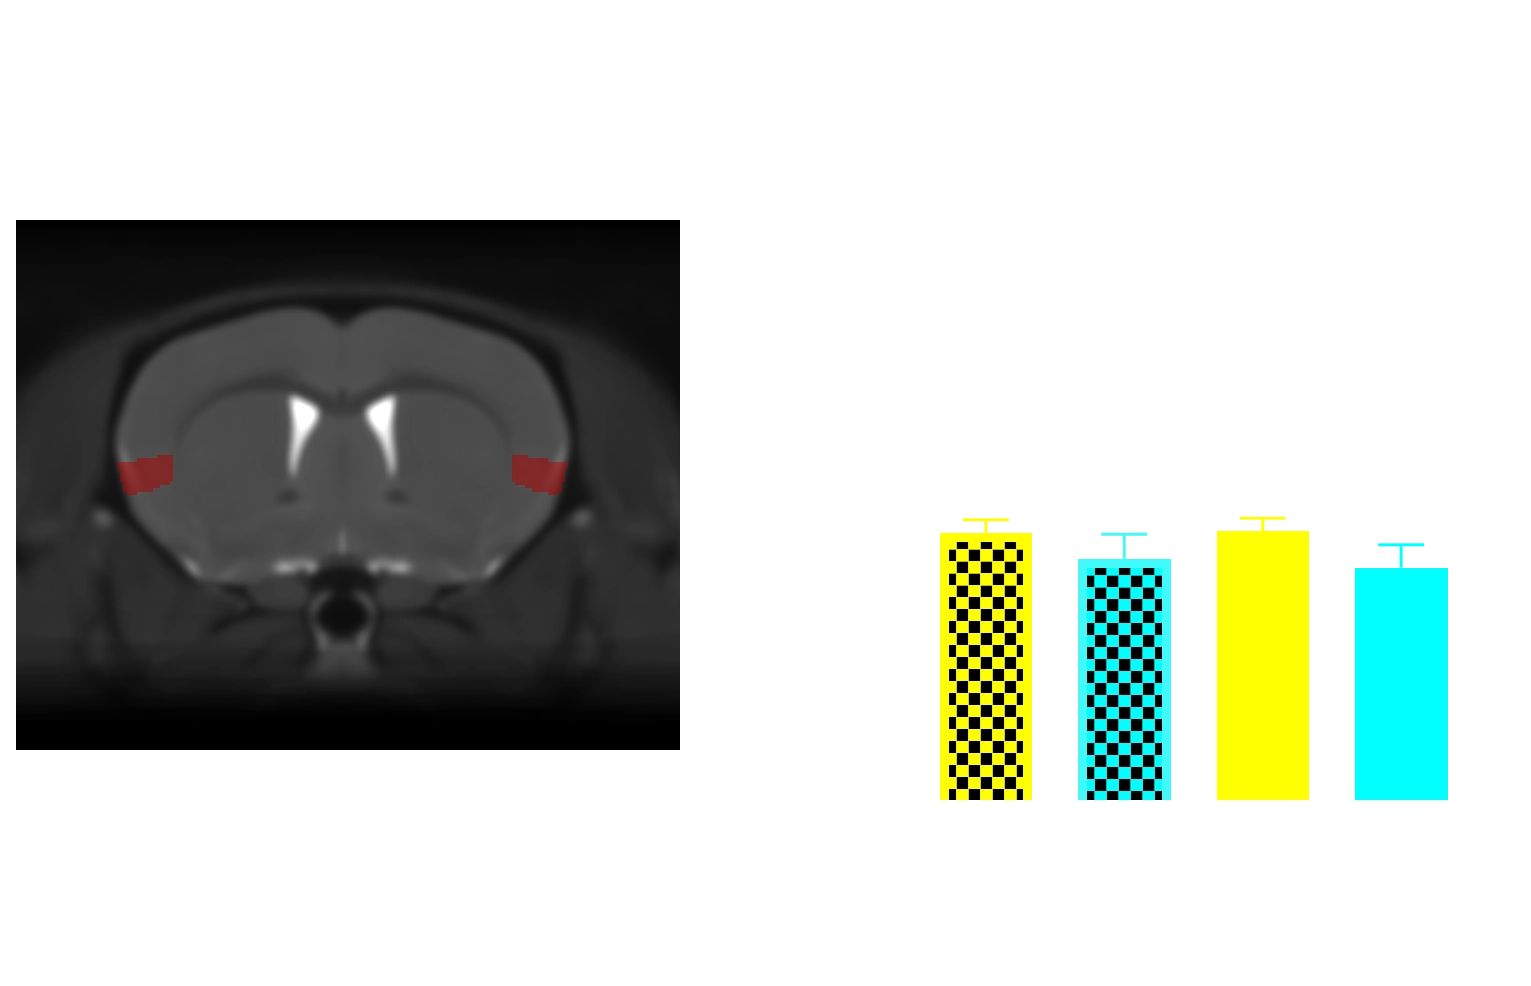
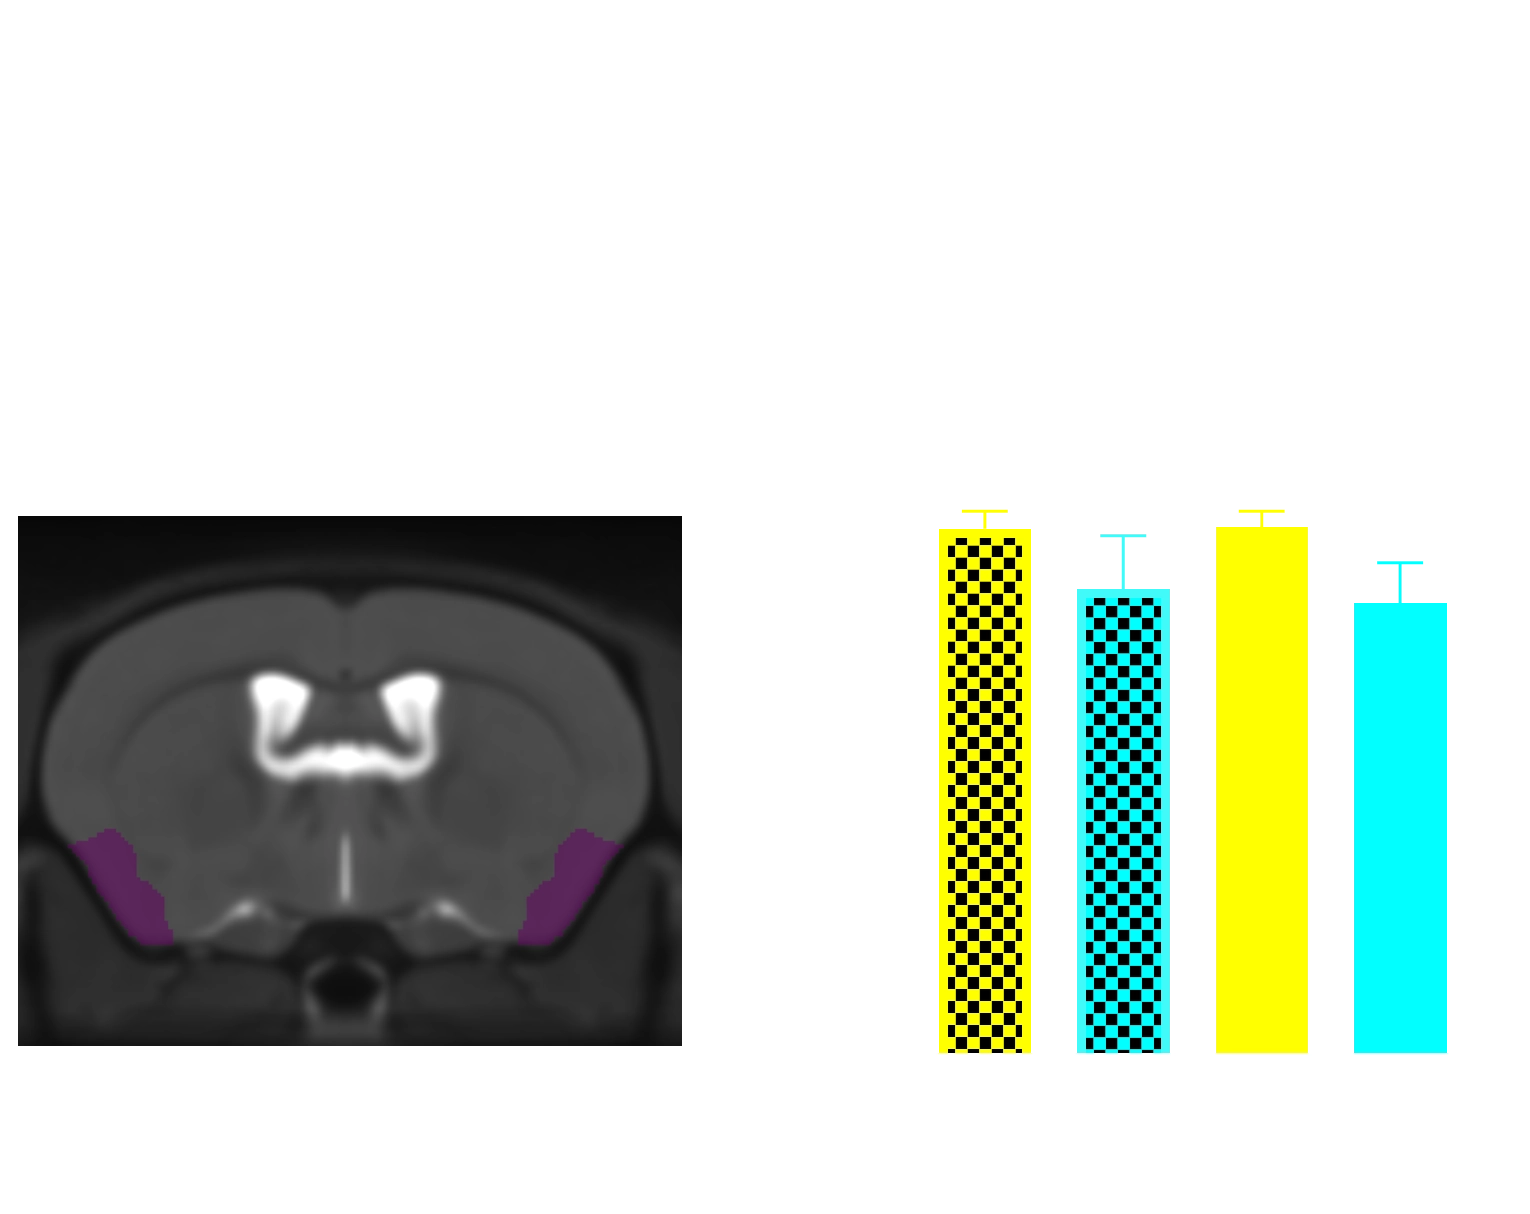
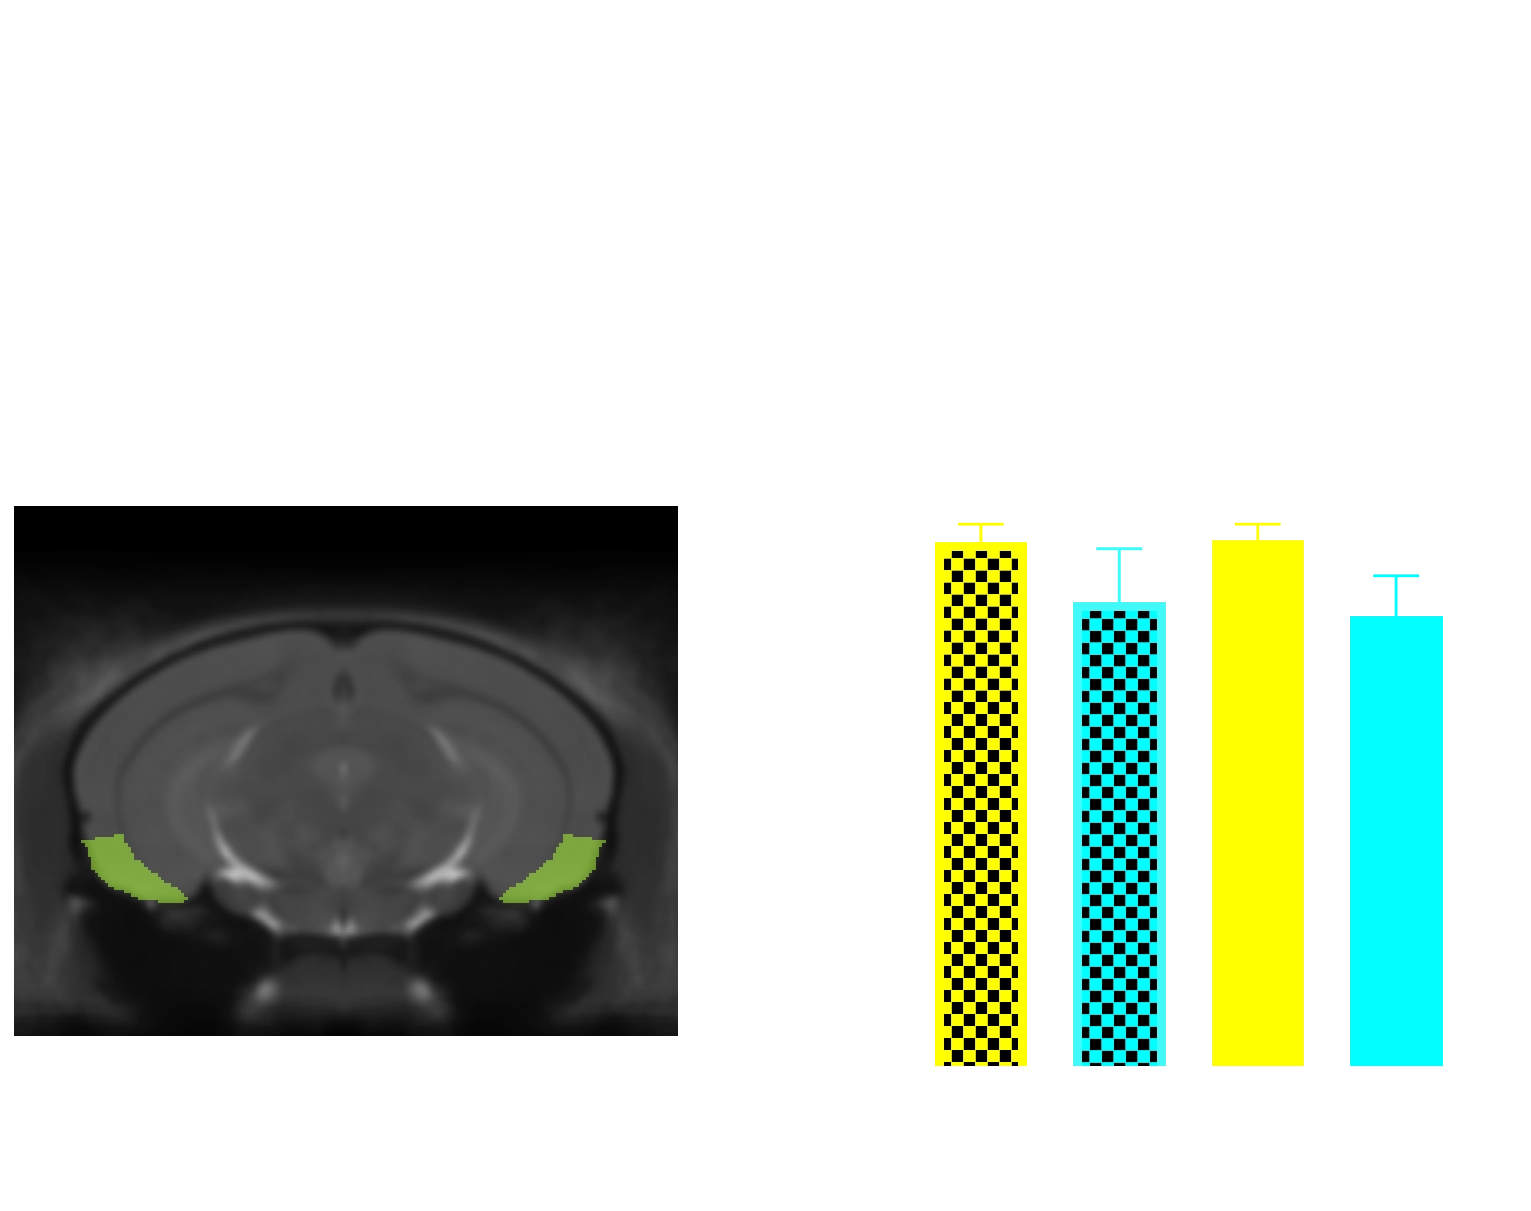
MRI Brain Atrophy: In vivo magnetic resonance imaging to quantify regional brain volume loss (neurodegeneration) over time. Progressive MRI-detected atrophy in the midbrain and connected structures serves as a translational endpoint paralleling human AD.
-
Neurofilament Light Chain (NfL): A fluid biomarker of axonal damage and neurodegeneration, measured in cerebrospinal fluid (and optionally plasma). Elevated NfL levels indicate ongoing neuronal injury; this biomarker is also used in clinical trials, making it a valuable bridge between preclinical and clinical results.
-
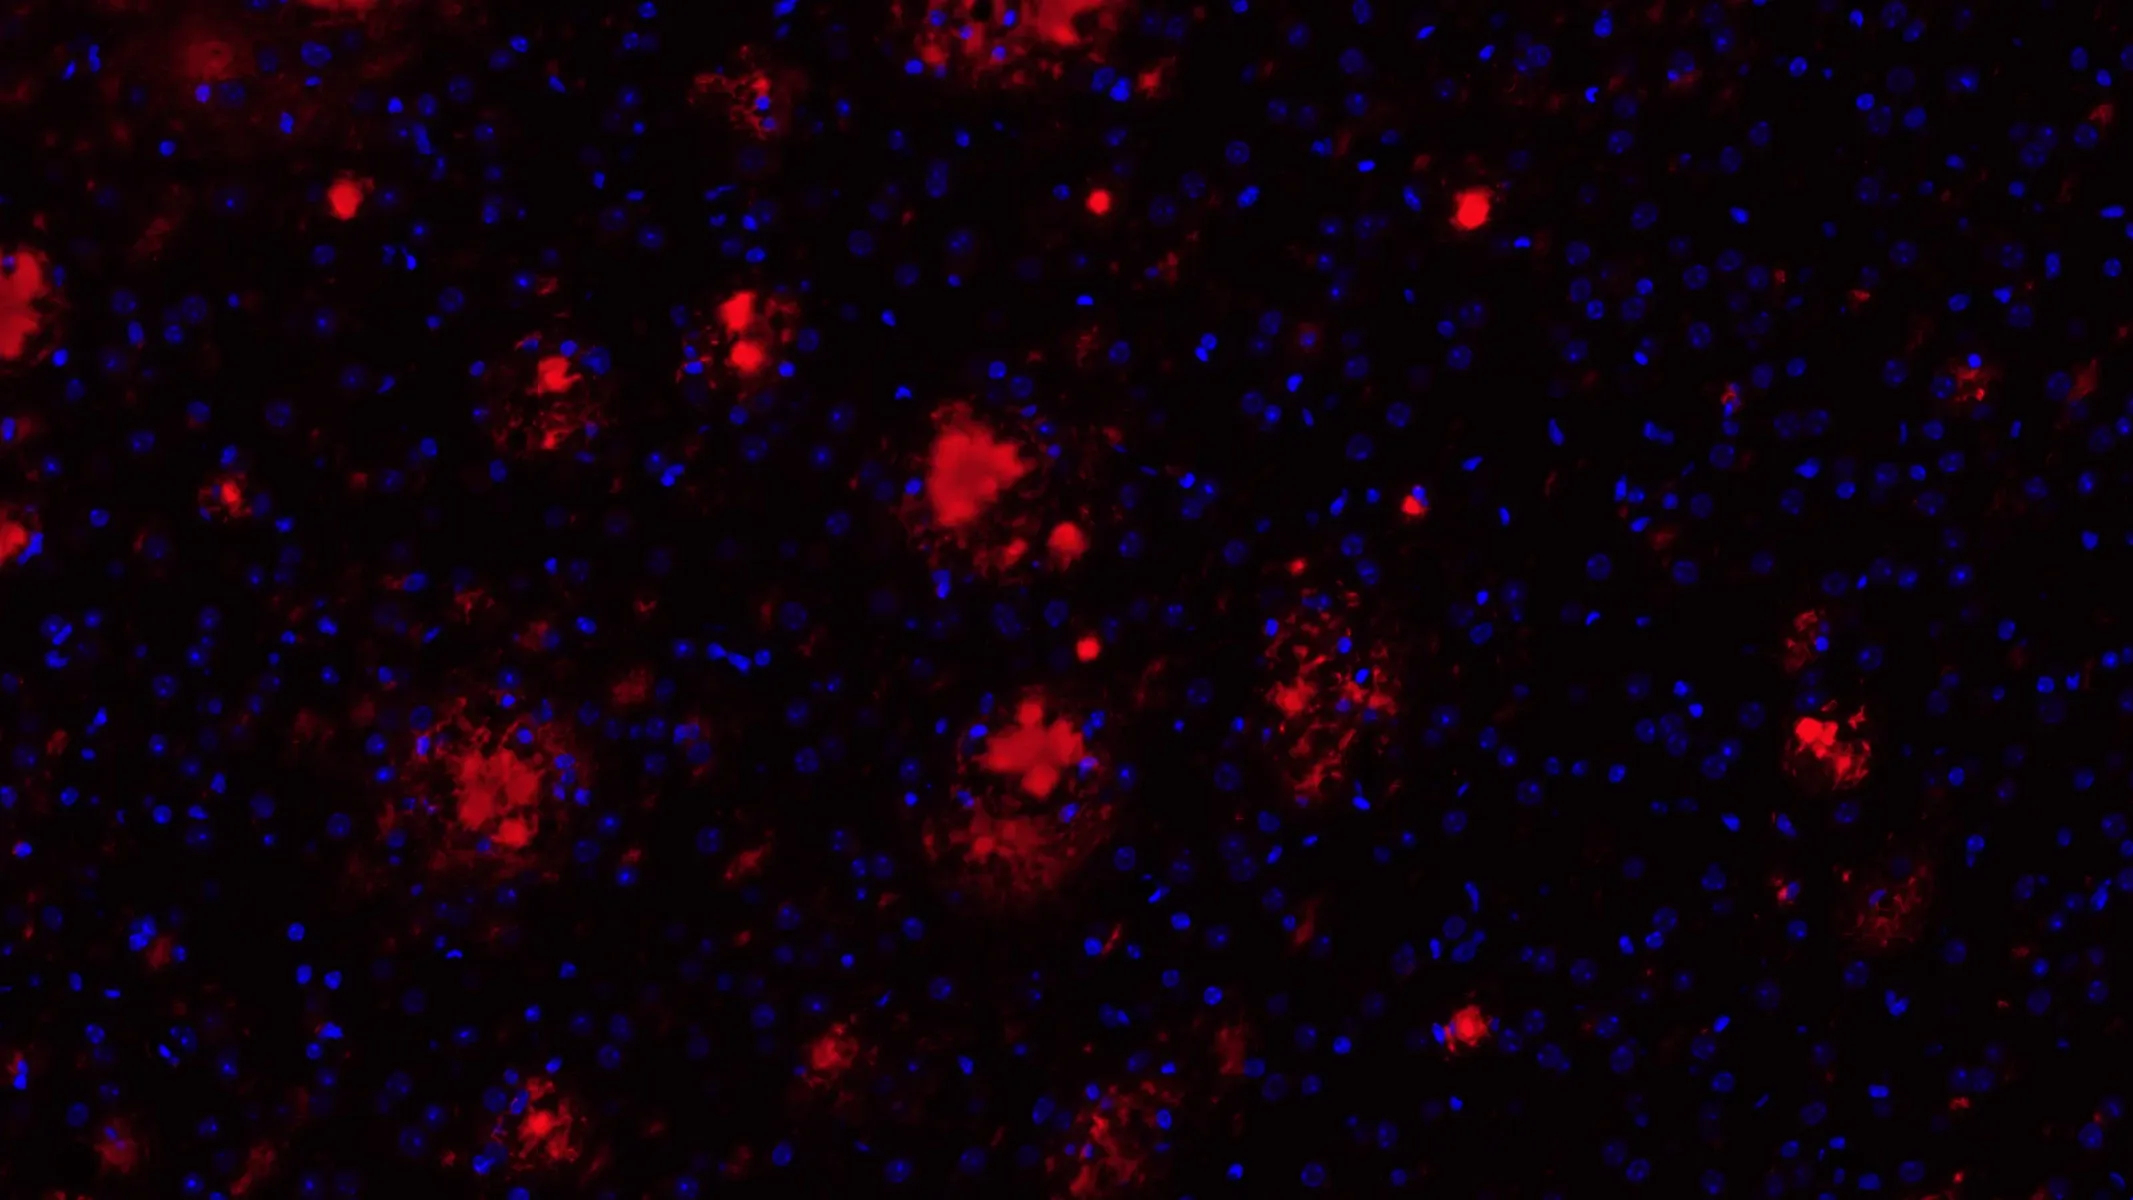
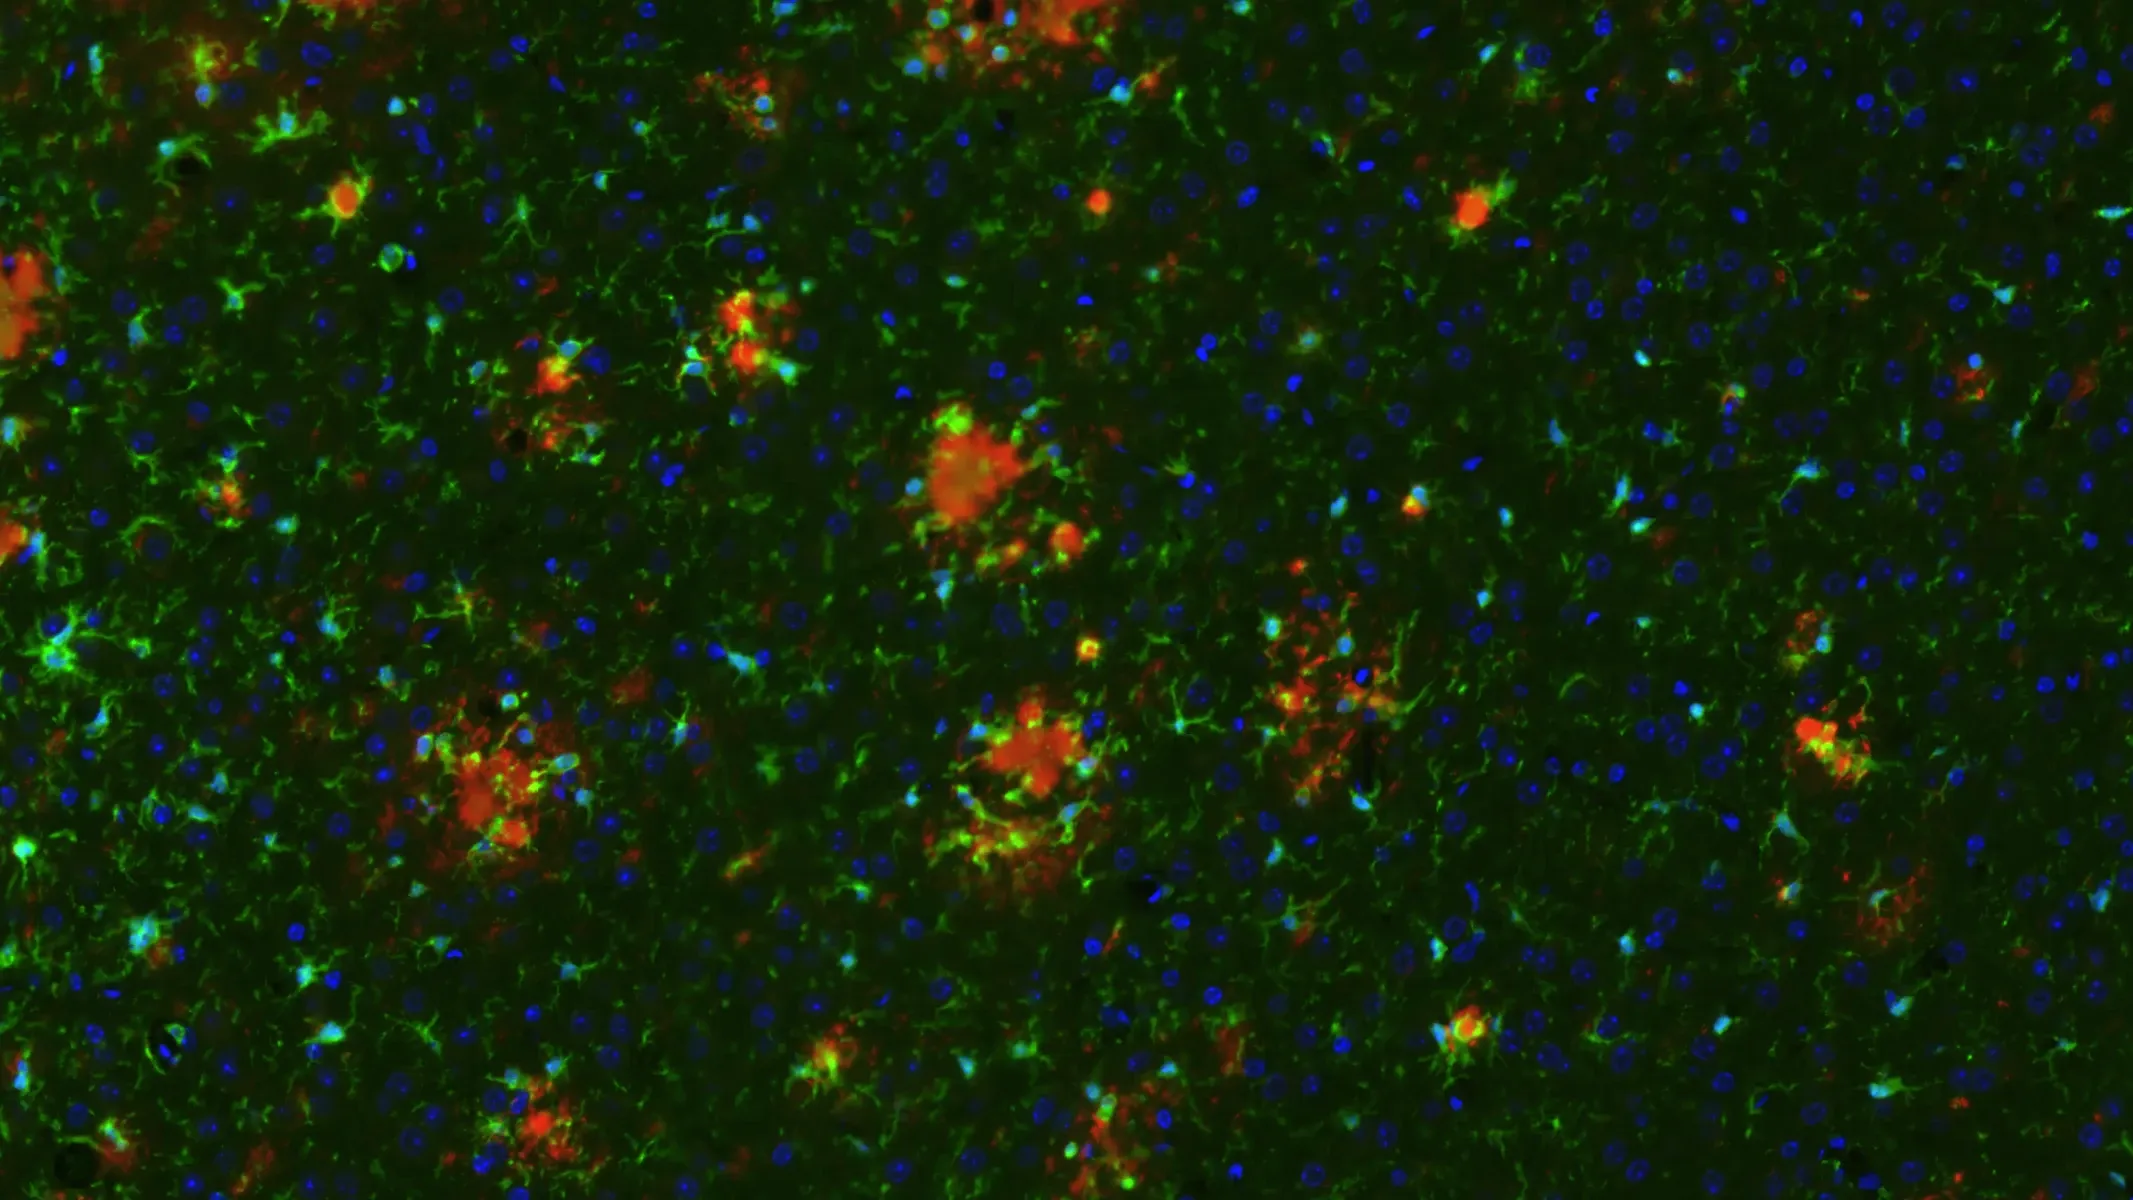
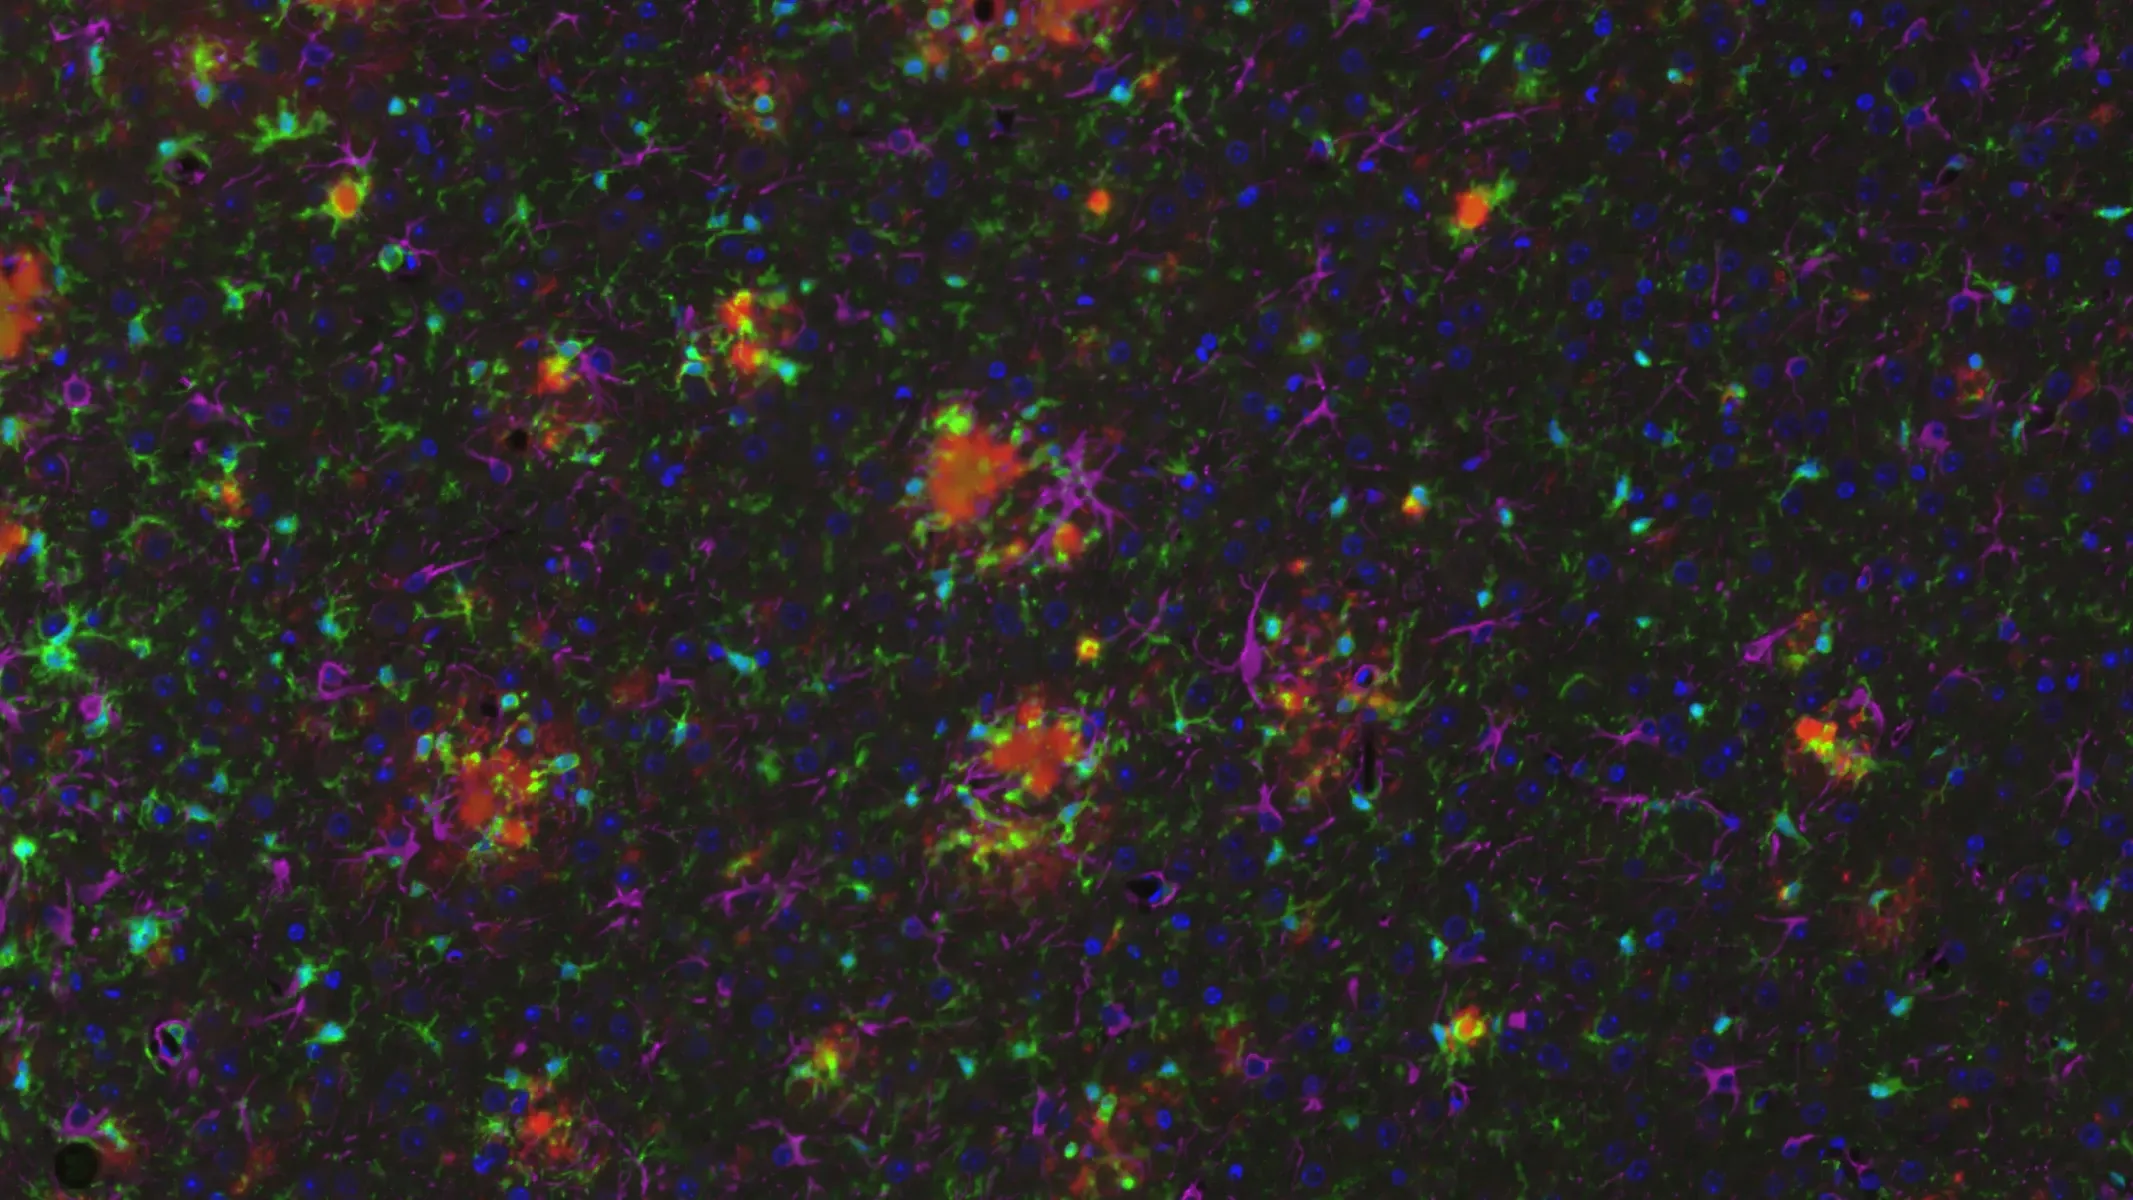
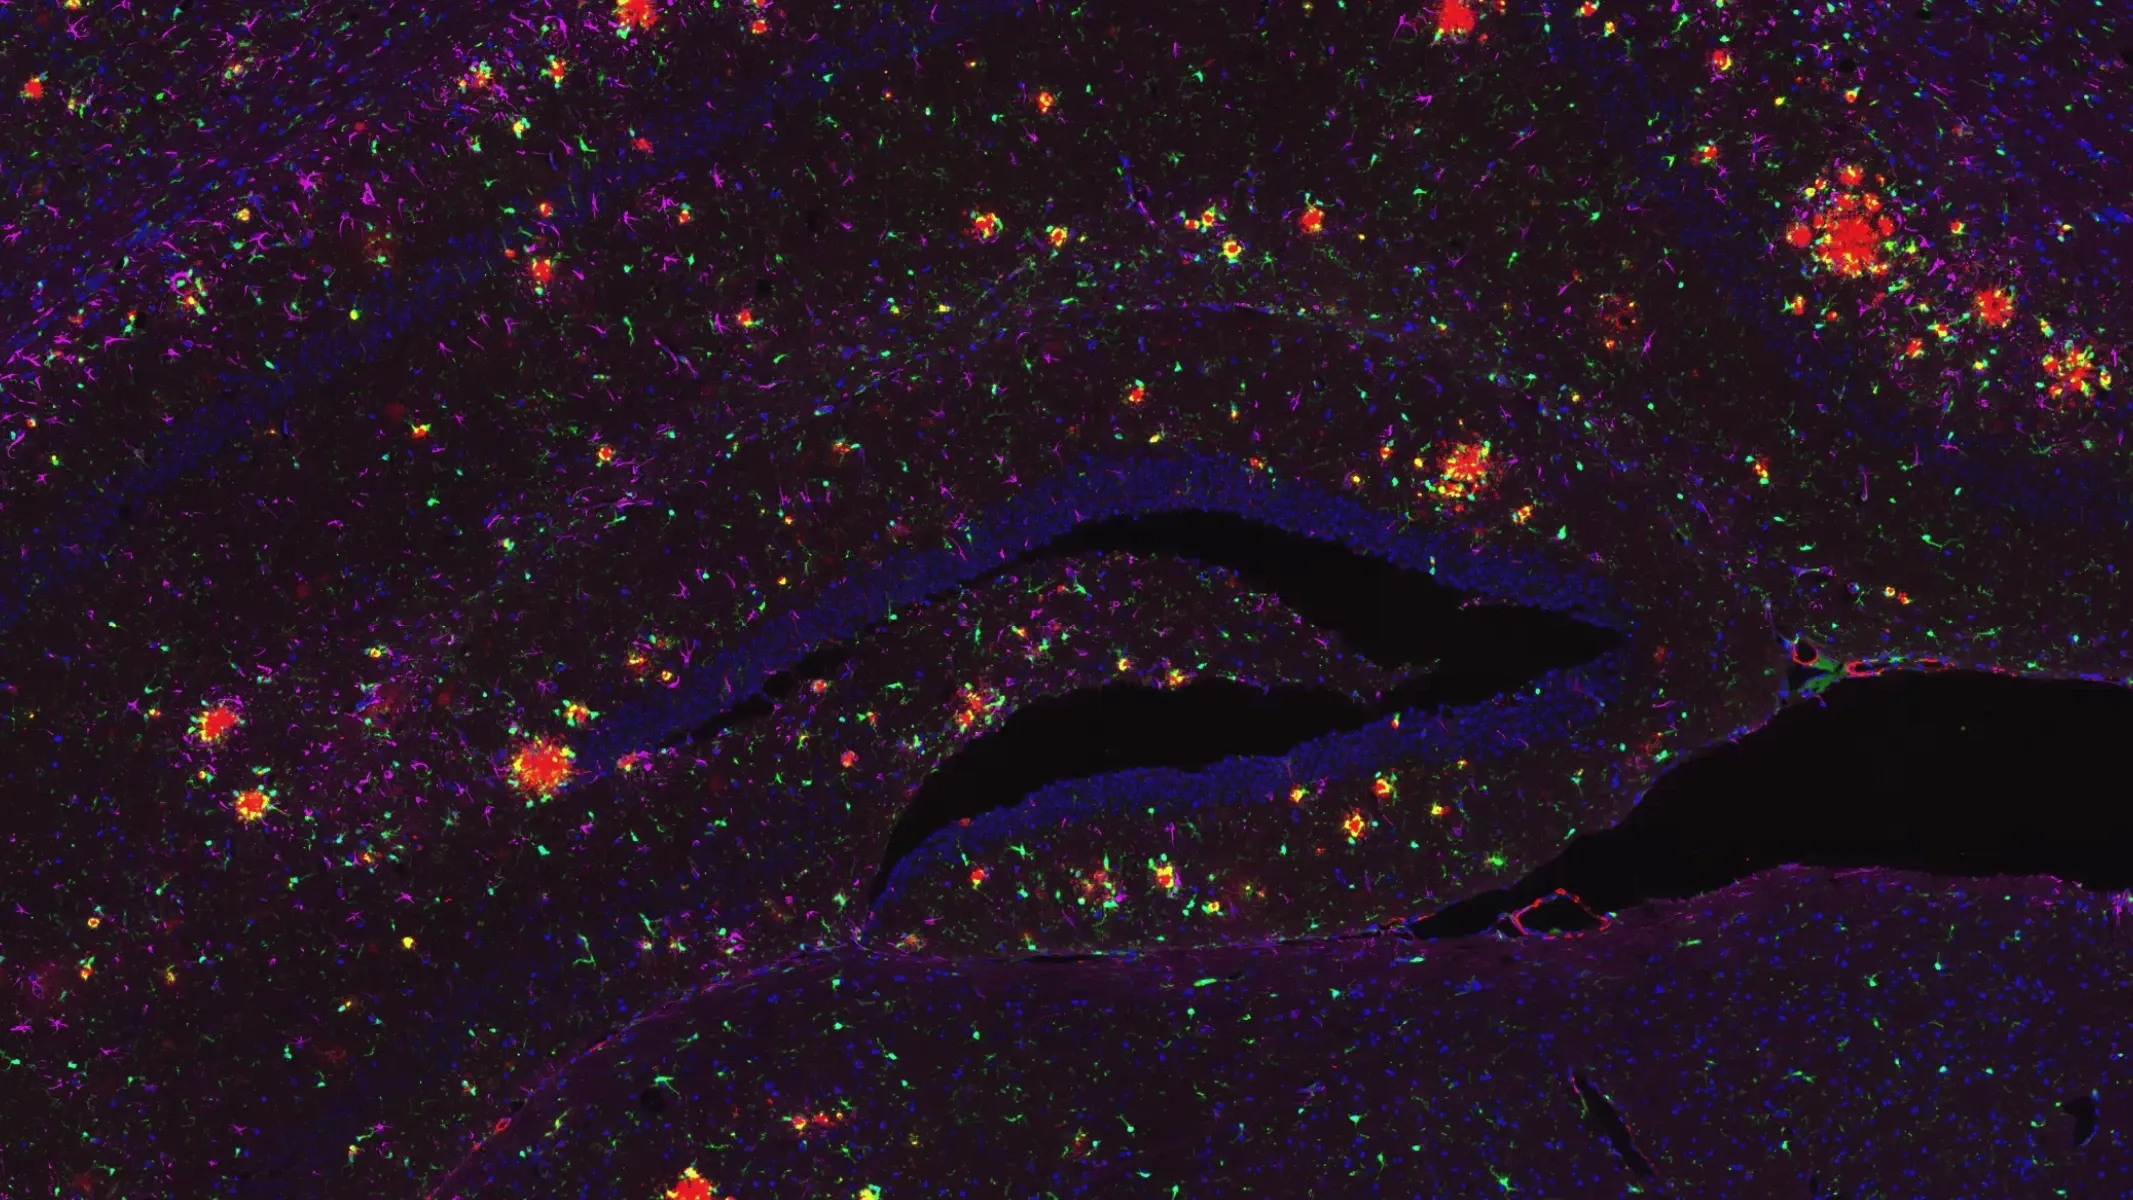
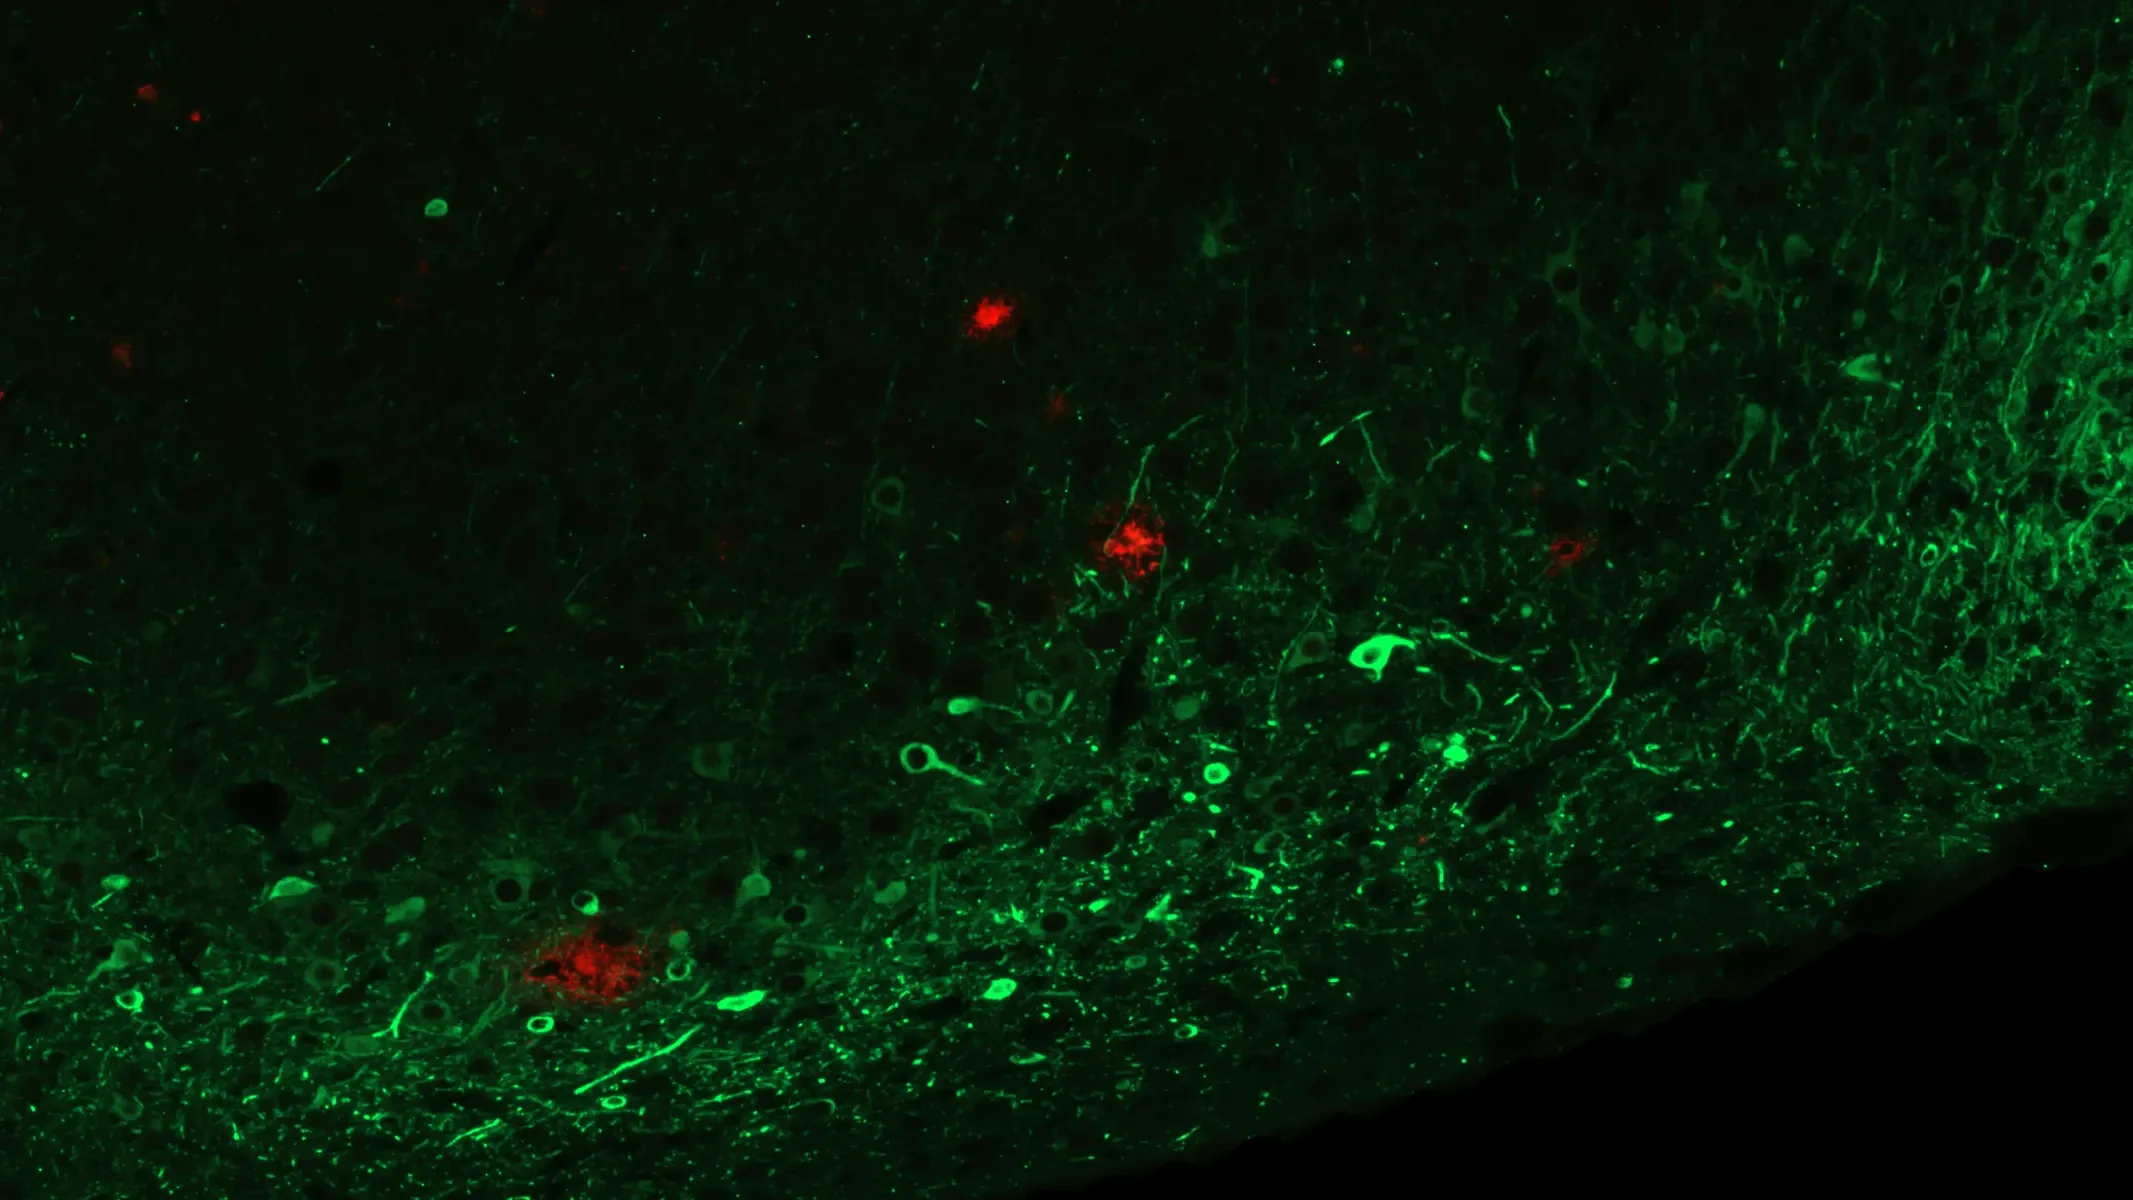
Quantitative Histopathology (IHC/mIF): High-resolution tissue analyses to quantify AD-related pathology. We perform immunohistochemistry (IHC) and multiplex immunofluorescence for markers such as amyloid-beta, phosphorylated tau inclusions (AT8 and other antibodies), neurons (NeuN), activated microglia (Iba1), and astrocytes (GFAP). Digital image analysis of these stained tissues provides quantitative measures of Aβ plaques, tangle-like aggregates, neuronal loss, and neuroinflammation in the brain.
These endpoints span multiple domains – behavioral, imaging, biochemical, and histological – providing complementary measures of disease severity and therapeutic impact. Notably, the inclusion of translational biomarkers like MRI volumetry and NfL helps bridge preclinical findings to the clinic. Neurofilament light (NfL) is a well-established marker of neurodegeneration: when neurons are damaged, NfL is released into CSF and blood, serving as a sensitive indicator of axonal injury and neurodegeneration. In clinical studies, elevated NfL levels correlate with disease progression in various neurological disorders, including Alzheimer’s disease.
In addition to these outcome measures, Biospective distinguishes itself by offering seamless end-to-end integration of all study components. We handle every aspect of the experiment – from viral vector administration, longitudinal behavioral testing, and in vivo MRI/PET imaging to biofluid collection and post-mortem tissue analysis. Our scientific team employs advanced analytics (including automated image analysis for dopaminergic terminal density and AI-driven cell morphology classification) to extract rich datasets from the model. (See our Presentation - Amyloid-Beta & Inflammatory Microenvironment in a Mouse Model of Alzheimer's Disease). All data are rigorously analyzed and integrated into an interpretable report, allowing you to make informed decisions on your therapeutic candidate’s performance.
Interactive Microscopy Images
Use the Image Viewer below to navigate through high-resolution microscopy images via the left-hand panel or the on-screen arrows. You can pan around the images with your mouse, and zoom in/out using the scroll wheel or the +/- controls. The Control Panel (top-right) allows toggling of image channels and segmentation overlays. For the best experience, we recommend switching to full-screen.


This Image Interactive Presentation allows you to explore our characterization of our amyloid-β and human tau co-pathology (APP/PS1/hTau) mouse model, including in vivo data and high-resolution images of entire multiplex immunofluorescence tissue sections.
 Click to copy link
Biospective's Alzheimer's Disease Models Expertise and Services
Biospective is a global neuroscience CRO with deep expertise in Alzheimer’s disease animal models – particularly amyloid-beta and tau models, which are a core part of our service portfolio.
We have spent over 15 years developing and executing studies in Alzheimer's disease models, giving us unrivaled insight into their nuances and optimal use in drug development. Our experienced team works as an extension of your own, ensuring rigorous study design and translational relevance at every step.
Some key advantages of partnering with Biospective for Alzheimer's disease model studies include:
-
Extensive Experience & Characterization: We have characterized our co-pathology mouse model through numerous studies, generating datasets that inform best practices and enhance reproducibility. This track record underscores our unique expertise with this Alzheimer's model.
-
Optimized AAV Vectors & Rapid Study Start: We utilize high-titer, validated AAV vectors encoding human tau to ensure robust, consistent model induction. Biospective maintains ready access to these viral vectors in-house, enabling fast study start-up without delays. Precise stereotaxic injection techniques and optimized dosing result in reliable pathology, and our on-demand vector supply accelerates project timelines.
-
End-to-End Preclinical Services: Biospective provides fully integrated services from initial study design through execution and data analysis. Our capabilities cover all aspects of the project, including surgical model induction (skilled bilateral AAV injections), comprehensive in-life assessments (behavioral testing, motor function assays, etc.), in vivo neuroimaging (MRI, PET) for longitudinal monitoring, biofluid collection (CSF, blood) for biomarker analysis, and post-mortem histopathology (immunohistochemistry and multiplex immunofluorescence). This one-stop approach ensures consistency, quality control, and efficient timelines.
- Translational Biomarkers & Readouts: We incorporate clinically relevant biomarkers that bridge preclinical findings to clinical outcomes. For example, we measure neurofilament light chain (NfL) levels in CSF as a biomarker of neurodegeneration (analogous to patient studies), and we perform MRI brain imaging to quantify neurodegenerative atrophy. We also conduct quantitative IHC/IF (e.g. Aβ, p-Tau, NeuN for neurons, Iba1 for microglia, GFAP for astrocytes) to assess pathology and neuroinflammation in tissue. These advanced readouts enhance the translatability of study results to human trials.
-
Global Collaboration & Flexibility: As a global preclinical CRO, we serve biotech and pharmaceutical clients worldwide and tailor each mouse model study to your therapeutic strategy. Our scientists collaborate closely with your team to customize protocols – from adjusting injection parameters (e.g. targeting specific brain regions, unilateral vs. bilateral injections) to incorporating novel endpoints or treatment paradigms. We offer flexibility to meet program-specific needs while maintaining scientific rigor, reproducibility, and transparent communication throughout the partnership.
By leveraging these strengths, Biospective empowers your team to efficiently generate decision-quality data in Alzheimer's disease models. We pride ourselves on fast project initiation, meticulous data analysis, and supporting our clients through all preclinical phases of Alzheimer’s therapy development.
Contact us to discuss how our APP/PS1/hTau mouse model and end-to-end preclinical services can support your Alzheimer’s disease drug development program.
Discover more of our Alzheimer's Disease & Tauopathies Models
Related Content
Up-to-date information on Alzheimer's Disease & Tauopathies and best practices related to the use of translational biomarkers for the evaluation of therapeutic agents in animal models.
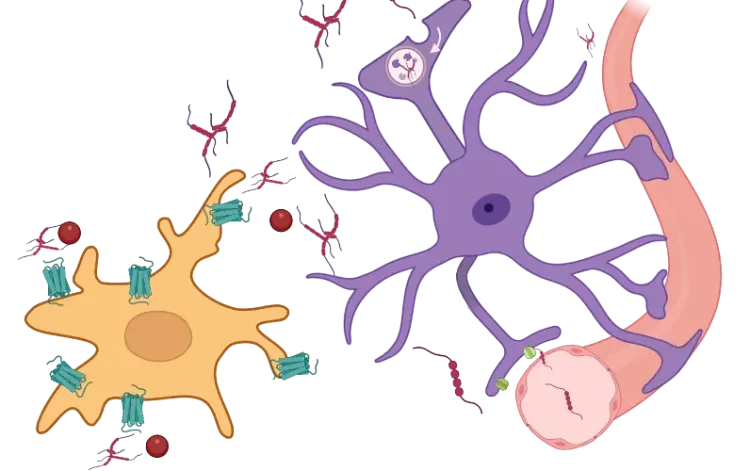
Microglia, Astrocytes & Tau in Neurodegenerative Diseases
How glial-driven neuroinflammation fuels tau aggregation, propagation, and neuronal loss in Alzheimer’s disease and other tauopathies.
Amyloid-β & Inflammatory Microenvironment in Alzheimer's Mice
We have analyzed the complex spatial relationships between β-amyloid plaques, activated & resting microglia, and astrocytes in an APP/PS1 transgenic model.
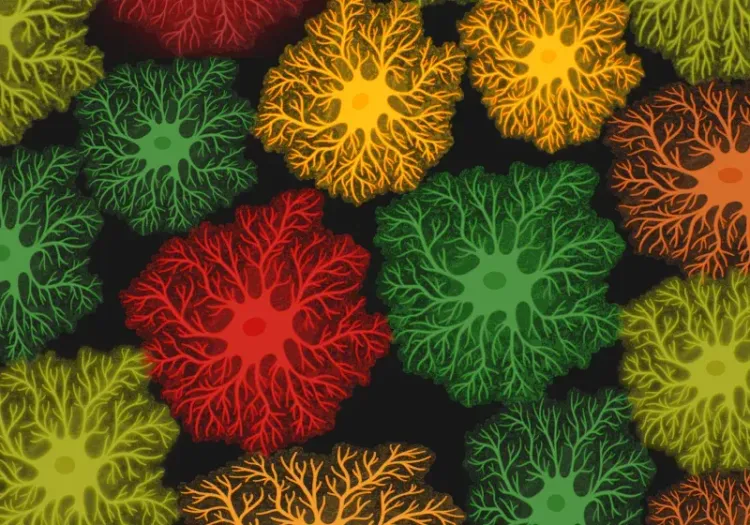
Astrocyte Morphology in Alzheimer's Disease
An overview of astrocyte morphological analysis and the applications to neurodegenerative disease research and drug discovery & development.
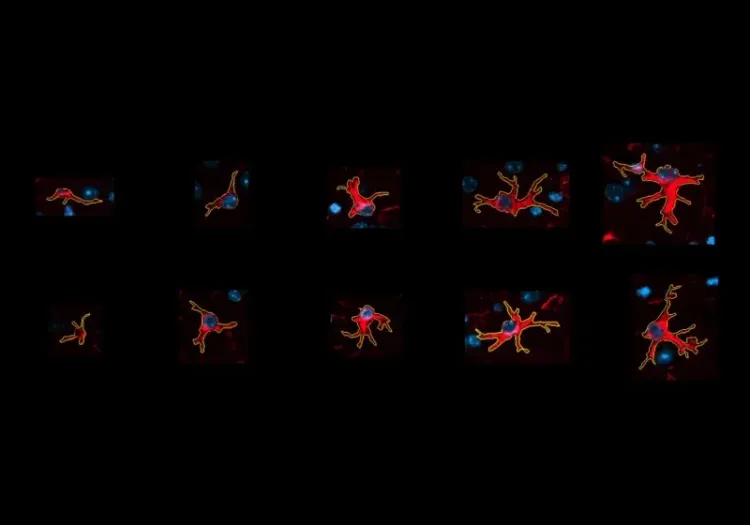
Astrocytes & Amyloid-β Mouse Models of Alzheimer's Disease
Analysis of astrocyte morphology in the amyloid-β plaque microenvironment provides a sensitive measure of disease progression in transgenic mice.
PS19 Mouse Model for Tau Targeted Drug Development
An overview of PS19 (P301S) mice as a transgenic model for preclinical evaluation of disease-modifying therapies targeting tau seeding & spreading.
Tau-related Atrophy is Independent of β-Amyloid & APOE ε4
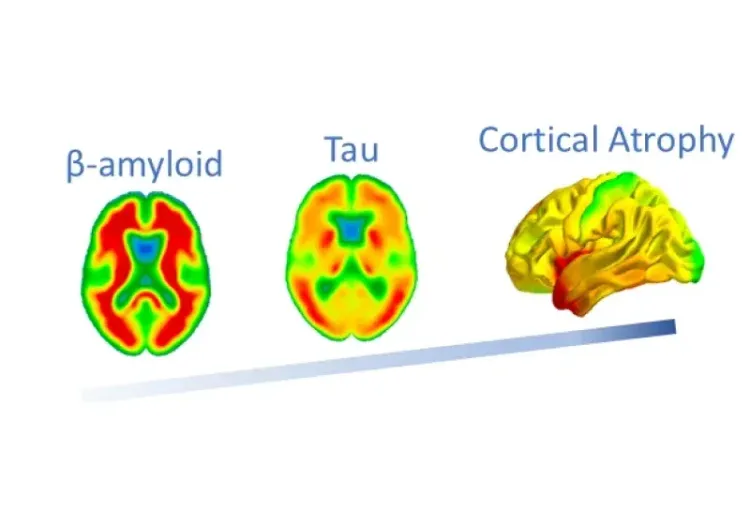
Using MRI, Tau PET, and Amyloid PET imaging biomarkers from the ADNI study, we show that Tau is more strongly linked to brain atrophy than β-amyloid or APOE ε4.
Decreased Brain Glucose Metabolism in MCI is Driven by Tau
We demonstrate a more significant role of tau than β-amyloid in the reduction of cerebral glucose metabolism by analysis of PET images from the ADNI study.
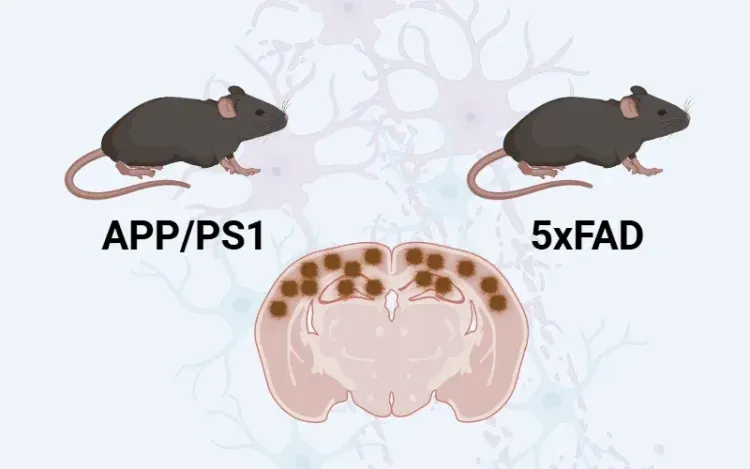
5xFAD Mice & APP/PS1 Mice – Alzheimer Disease Mouse Models
A comparison of 5xFAD and APP/PS1 mouse models of Alzheimer’s disease, including amyloid-beta pathology, neuroinflammation, and cerebrovascular disease.
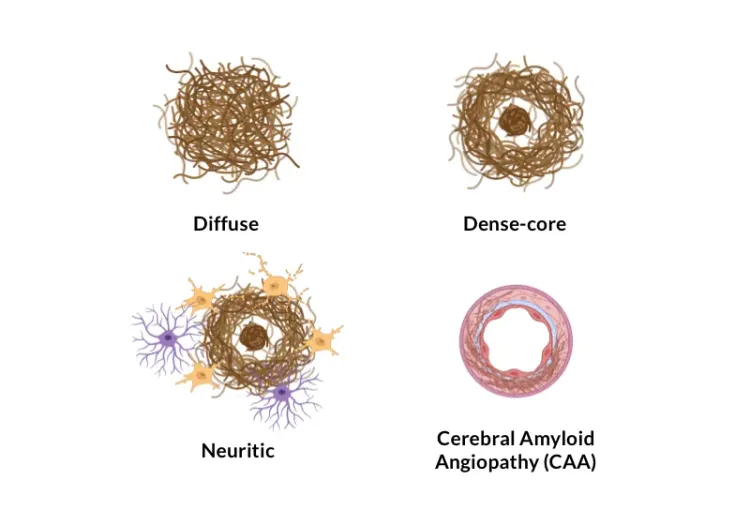
Amyloid-β Plaque Analysis in Alzheimer's Disease
Overview of methods to classify & quantify Aβ plaques in brain tissue sections from humans & Alzheimer’s disease animal models (transgenic mice & rats).
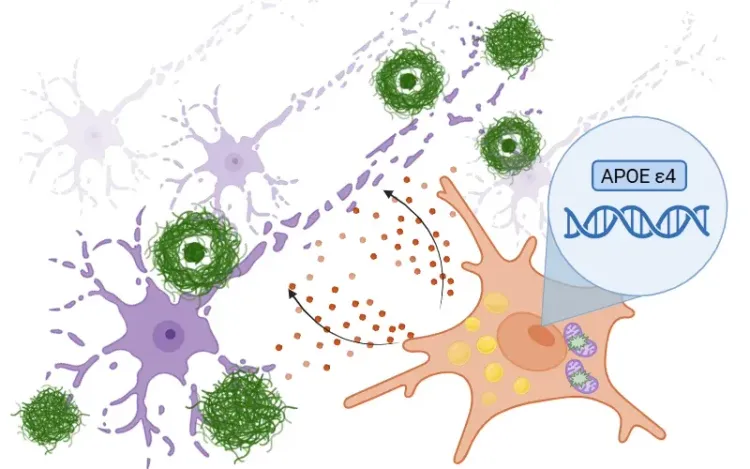
APOE4, Microglia & Alzheimer’s Disease
An overview of how ApoE4 influences microglial activity in Alzheimer's disease and the development of targeted therapeutics.
Astrocyte Morphology in Alzheimer's Disease
An overview of astrocyte morphological analysis and the applications to neurodegenerative disease research and drug discovery & development.
Autophagy & Neurodegenerative Diseases
An overview of how cellular autophagy plays a role in brain health and neurodegeneration.
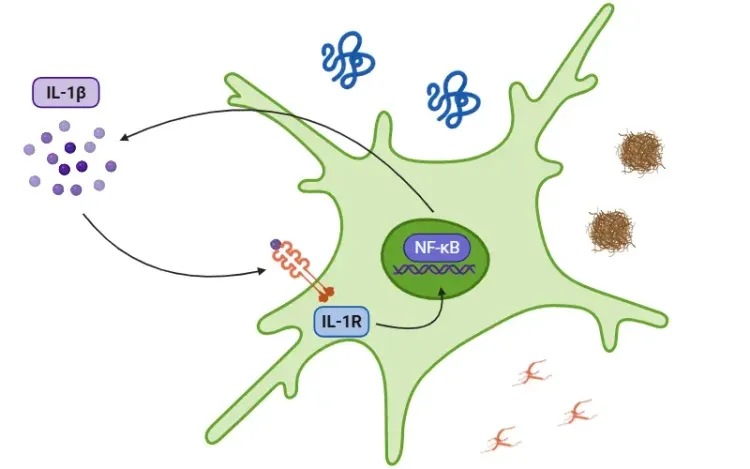
Interleukin-1 Beta (IL-1β) and Neurodegenerative Diseases
The role of IL-1beta in neurodegenerative diseases, including Alzheimer's disease (AD), Parkinson’s disease (PD), and amyotrophic lateral sclerosis (ALS).
Microglial Senescence and Neurodegenerative Diseases
An overview of microglial senescence and its role in neurodegenerative diseases, including Alzheimer’s disease (AD) and Parkinson’s disease (PD).
NLRP3 Inflammasome and Neurodegenerative Diseases
An overview of the NLRP3 inflammasome and its role in neurodegenerative diseases, including Alzheimer's disease, Parkinson’s disease, and ALS.
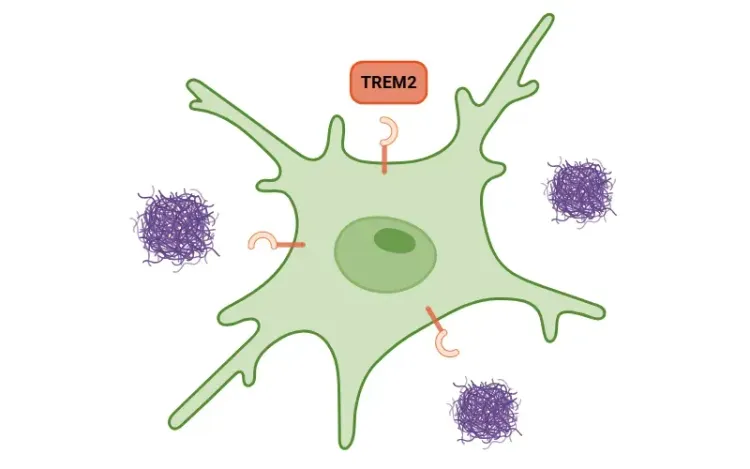
TREM2, Microglia and Neuroinflammation
An overview of TREM2, its role in microglia, links to neurodegenerative diseases, and potential treatment implications.
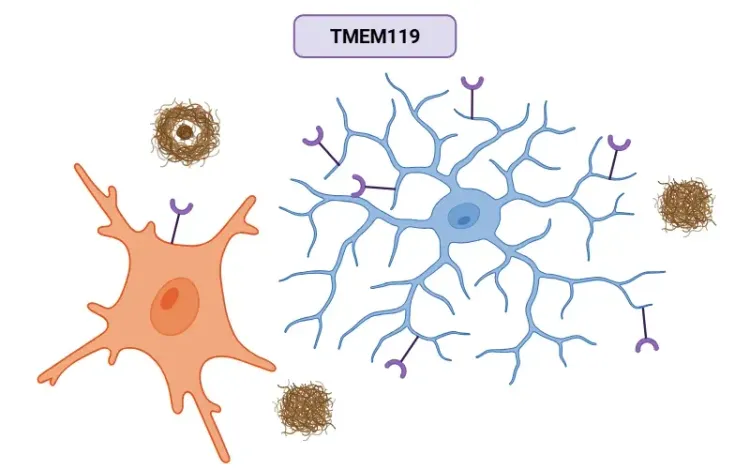
TMEM119 (transmembrane protein 119) and Microglia
An overview of the significance of TMEM119 in labeling microglia and its role in various diseases, including Alzheimer’s disease.
Inflammasome – A Therapeutic Target for Multiple Diseases
An overview of inflammasomes, including their mechanisms of action, roles in diseases, and targeting for drug development.