Quantitative Amyloid Plaque Microenvironment Analysis in the APP/PS1 Mouse Model
Beta Amyloid Plaques Histology for Mouse & Rat Models of Alzheimer's Disease
Global preclinical CRO specializing in analysis of Aβ plaques & associated neuroinflammation in animal models.
Validated multiplex immunofluorescence (IF) & advanced image analysis of plaques in brains of mice & rats.
Biospective has industry-leading expertise in providing beta amyloid plaques histology services, including multiplex immunofluorescence (mIF) staining using a variety of antibodies. We have unique capabilities for measurements of Aβ plaque features (e.g. count, size, area, type, morphometry) and spatial analysis of the complex relationships with associated neuroinflammation, including activated microglia and reactive astrocytes using our proprietary "microenvironment analysis".
Explore our Services
- What Contract Research Services does Biospective offer for Amyloid Plaque Staining & Analysis?
- What is Biospective's Process for Staining & Quantitative Analysis of Amyloid-Beta Plaques?
- Why Quantify Amyloid-β Plaques?
- How does Biospective Perform Analysis for Amyloid Plaques and the Associated Neuroinflammation?
What Contract Research Services does Biospective offer for Amyloid Plaque Staining & Analysis?
High-resolution Aβ plaque detection, spatial mapping, and neuroinflammation profiling for Alzheimer’s disease research.
Biospective provides end-to-end characterization of amyloid-beta (Aβ) plaques and the glial microenvironment responses using advanced multiplex immunofluorescence (mIF) tissue staining, high-resolution whole-slide imaging, and automated machine-learning based morphology analysis.
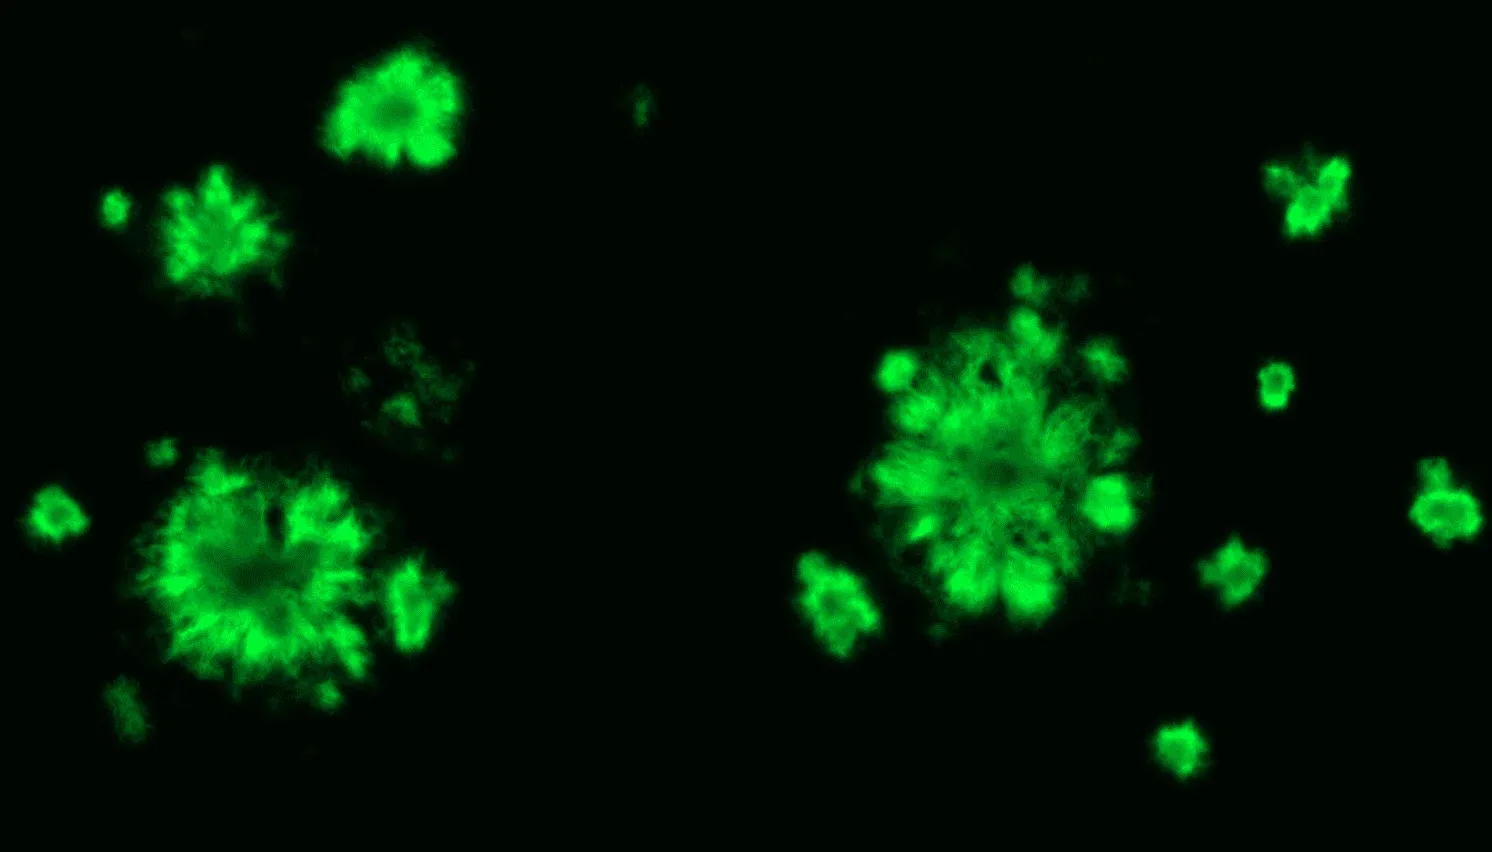
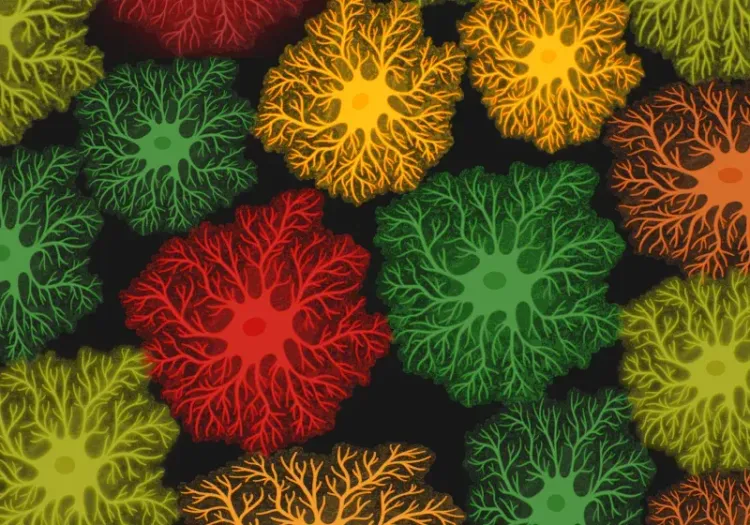
Fluorescent pFTAA staining of amyloid plaques in the cerebral cortex of APP/PS1 mice.
Our platform enables quantitative, multiparametric analysis of amyloid-beta pathology alongside microglial and astrocytic phenotypes, integrating spatially-resolved biological metrics to deliver sensitive and comprehensive assessments of therapeutic efficacy beyond conventional plaque load measurements.
Our Amyloid Plaque Staining & Image Analysis Capabilities
Amyloid Plaque Detection & Quantification
- Fibrillar amyloid detection using optimized fibrillar Amyloid OC antibody (optional pan-Aβ / Aβ40 / Aβ42 / Aβ43, 4G8, 6E10, pFTAA dye quantification).
- Plaque metrics: count, area, size distribution, and morphology metrics (e.g. circularity).
Advanced Plaque Microenvironment Profiling
- Quantification of density of relevant markers, such as microglia/Iba1 and astrocytes/GFAP, both globally and in the plaque microenvironment as a function of the distance to the plaque.
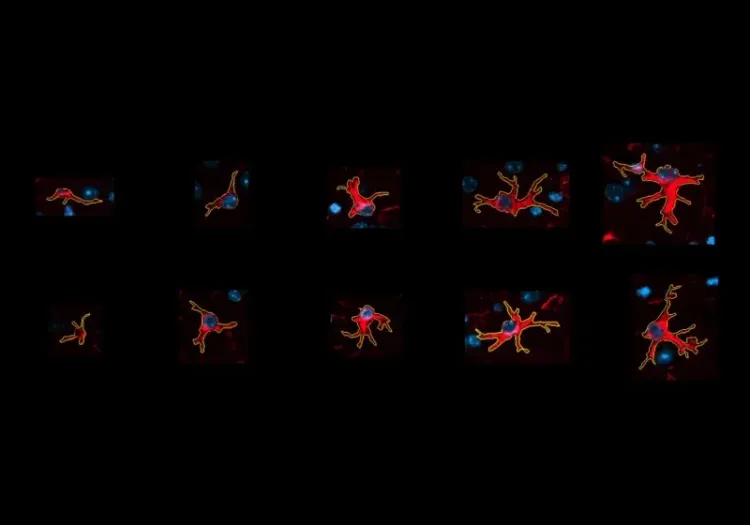
- Detection and morphological classification of microglia and astrocytes. Counts of glial cells of specific morphology can be measured both globally and locally at different distances from individual amyloid plaques.
- Microglia–astrocyte interaction metrics, such as the ratio of microglia to astrocyte in the plaque environment.
Whole-Slide Imaging & Spatial Analytics
- Whole-slide, high-resolution, multi-channel fluorescence imaging.
- Automated neuroanatomical brain segmentation — all metrics are calculated in each brain region-of-interest (ROI), such as the hippocampus, amygdala, entorhinal cortex, etc.
Translational Integration
- Accurate brain volume quantification and cortical thickness measurement using in vivo MRI.
- Cognitive and sleep assessments
- Fluid biomarkers from CSF/blood and brain tissue homogenates
- Aβ40 and Aβ42
- Cytokines (e.g. IL-1β, TNF-α)
- Neurofilament light chain (NfL)
- TREM2
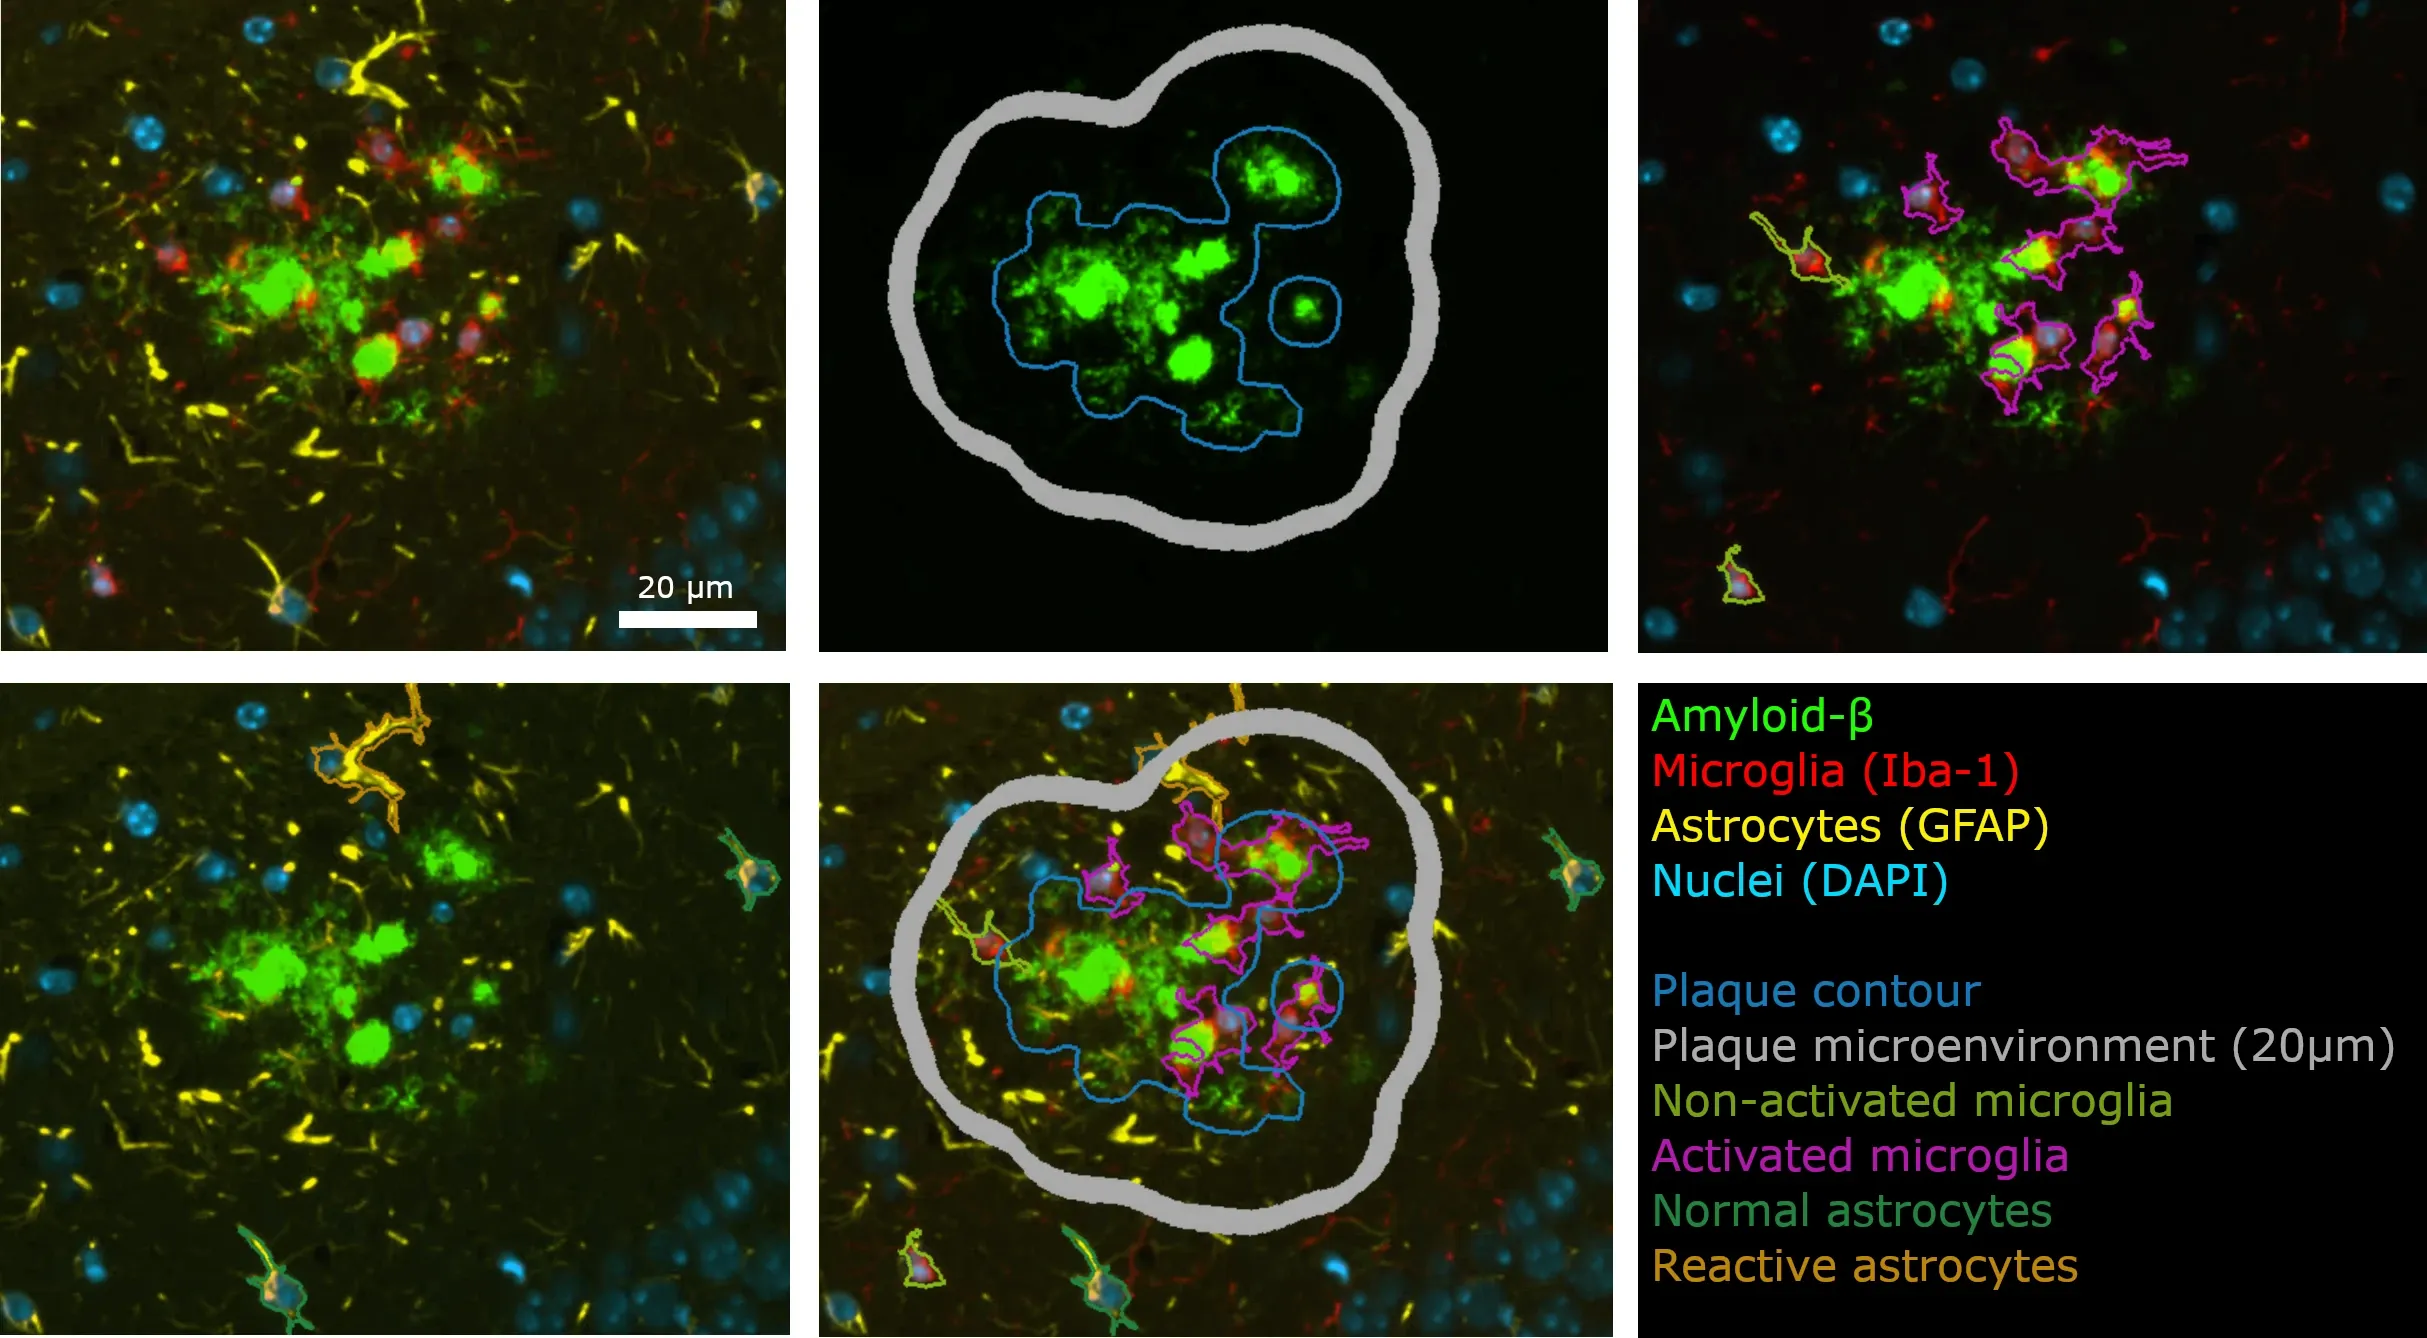
Example montage of an Aβ plaque from brain tissue sections from an APP/PS1 transgenic mouse that have undergone automated staining and image analysis using the processes developed by Biospective.
Tissue Types & Disease Models
Species
Tissue Formats
- FFPE sections: high-throughput, stable
- Fixed-frozen sections: ideal for hard-to-detect inflammatory markers
Applications
- Therapeutic efficacy studies
- Mechanistic modeling of plaque-associated neuroinflammation
What is Biospective's Workflow for Staining & Quantitative Analysis of Amyloid-Beta Plaques?
Well-established protocols for brain sample preparation, staining, slide scanning, and quantitative image analysis.
Our Process for Aβ Plaque Staining & Analysis
At Biospective, we have implemented a standardized, highly reproducible multi-step process for staining and analysis of amyloid-beta plaques from formalin-fixed brains:
- Sample Preparation
- High-precision microtomy or cryosectioning of FFPE or fixed-frozen brains.
- Custom antigen retrieval protocols optimized for OC and each Aβ isoform–specific antibody, ensuring high-affinity binding and preservation of plaque morphology. Retrieval conditions are further customized for any additional antibodies included in the multiplex panel. We routinely perform formic acid retrieval, heat-induced retrieval (HIER), enzymatic retrieval, or a combination of these methods.
- Stringent quality control (QC) of staining quality and specificity as well as tissue integrity.
- Staining (IHC or Multiplex IF)
- Amyloid Markers
- OC fibrillar amyloid (primary default marker)
- Pan- Aβ, Aβ 1–40, 1–42, 1–43, 6E10, 4G8, and MAOB-2 (or custom amyloid antibody)
- pFTAA dye
- Microenvironment Markers
- Iba1 (microglia)
- GFAP (astrocytes)
- TREM2, LAMP1, CD68, NeuN, APP, and/or custom markers
- DAPI (nuclei)
- Advantages of Multiplexing
- Multiplexing enables cell-type–specific analysis of the microenvironment on a single slide, accurately characterizing the cellular landscape surrounding individual plaques.
- Multiplexing enables cell-type–specific analysis of the microenvironment on a single slide, accurately characterizing the cellular landscape surrounding individual plaques.
- Amyloid Markers
- Imaging
- Whole-section multichannel fluorescence scanning
- Whole-section multichannel fluorescence scanning
- Quantitative Analysis
We have developed fully-automated quantitative analysis for multiplex immunofluorescence, including amyloid-beta plaque segmentation and counting, glial cell morphology analysis, and microenvironment analysis.
-
- Multiplex IF staining
- Detection, segmentation, and classification of microglia based on their morphology
- Detection, segmentation, and classification of astrocytes based on their morphology
- Detection and segmentation of amyloid (Aβ) plaques
- Microenvironment analysis: quantification of stain density and glial cell density as a function of distance from the plaque and plaque size
Illustration of Biospective's process of collecting brain tissue samples from animal models, performing tissue sectioning, multiplex immunofluorescence staining, whole slide scanning, and quantitative image analysis.
Sample Collection, Preparation, and Shipping Guidelines
We provide comprehensive support to ensure sample integrity and data reliability:
- Sample Collection: Animals should be perfused with cold PBS and/or 10% neutral-buffered formalin, and the brains should be carefully extracted.
- Sample Preparation: Brains must be briefly properly fixed in 10% neutral-buffered formalin.
- Sample Shipping: Samples must be shipped in PBS with sodium azide.
Why Quantify Amyloid-β Plaques?
A brief overview of Aβ pathology in Alzheimer’s disease and why robust quantitative analysis is important.
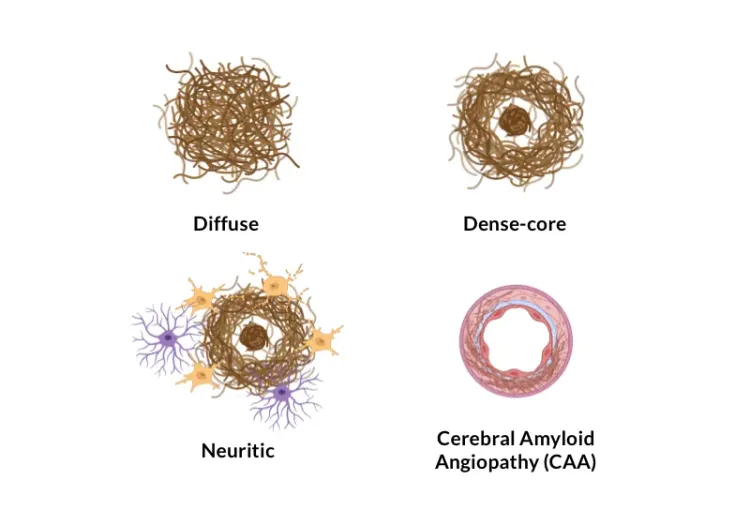
Amyloid plaques are extracellular deposits of aggregated Aβ peptides and are a neuropathological hallmark of Alzheimer’s disease (Selkoe, 2016). Aβ peptides are generated by the cleavage of the amyloid precursor protein (APP), and these peptides can have different lengths, with Aβ40 and Aβ42 being the most common in AD. The accumulation of Aβ plaques in the brain follows a distinct spatiotemporal pattern, with the first appearance in the neocortex, which then is followed by spread in subcortical regions, including the hippocampus (Braak, 1991; Braak, 2006).
Spatiotemporal pattern of β-amyloid pathology progression (adapted from Braak, 1991).
Detailed quantification of amyloid plaques and their associated neuroinflammatory microenvironment is highly valuable:
- The first approved disease-modifying therapies for AD consist of antibody treatments targeted pathological form of Aβ, aimed at the clearance of amyloid plaques (Perneczky, 2024).
- An inflammatory microenvironment is often found in the plaque proximity, which is thought to be driven mainly by microglia (Tsering, 2024).
- Specific subtypes of microglia (disease-associated microglia, DAM) and astrocytes (disease-associated astrocytes, DAA) have been found to be enriched in AD (Deczkowska, 2018; Habib, 2020). Microglia have been found to be highly localized to the plaques, while astrocytes have been found further away from the plaques (Mallach, 2024).
- Microglia-astrocyte interactions have been found to be perturbed around amyloid plaques (Mallach, 2024).
- Microglia (Savage, 2019) and astrocytes (Patani, 2023) undergo drastic morphological changes under stressful conditions and are thought to play an important role in neurodegenerative disorders (Hulshof, 2022; Gao, 2023).
In this video, we provide an overview of our amyloid plaque staining and analysis platform. It includes illustrative examples from the APP/PS1 mouse model of Alzheimer’s disease, demonstrating how our multiplex immunofluorescence and automated spatial analyses quantify plaque burden, glial activation, and plaque microenvironments to measure disease progression and support therapeutic evaluation in preclinical studies.
 Click to copy link
How does Biospective Perform Analysis for Amyloid Plaques and the Associated Neuroinflammation?
A summary of our Aβ quantification methods and an illustrative example from an Alzheimer's disease mouse model.
To demonstrate our workflow for amyloid plaque staining and microenvironment analysis, we characterized the progressive accumulation of the disease burden in an amyloid-beta mouse model of AD, the APP/PS1 (ARTE10) model. Mice were studied at 6, 9, and 12 months-of-age, and compared to control 6 month-old mice.
Animated workflow for Aβ plaque microenvironment analysis.
In this research study, we found:
- A progressive, highly significant, stepwise increase in the density of amyloid plaques in the different age groups.
- A global increase in neuroinflammation, as quantified by microglia (Iba1) and astrocyte (GFAP) stain density, in a spatiotemporal pattern that follows the amyloid pathology.
- Advanced metrics that provide more sensitive measures of the disease state:
- The density of activated microglia
- The mean astrocyte hypertrophy score
- The ratio of microglia-to-astrocytes in the plaque proximity
- The higher sensitivity of these advanced metrics would mean that, in the context of a preclinical therapeutic efficacy study, a smaller effect could be detected using the same number of animals. In addition, these metrics would be particularly relevant for therapeutics that target microglia, astrocytes, microglia-astrocyte interactions, or the interaction of glial cells with amyloid plaques.
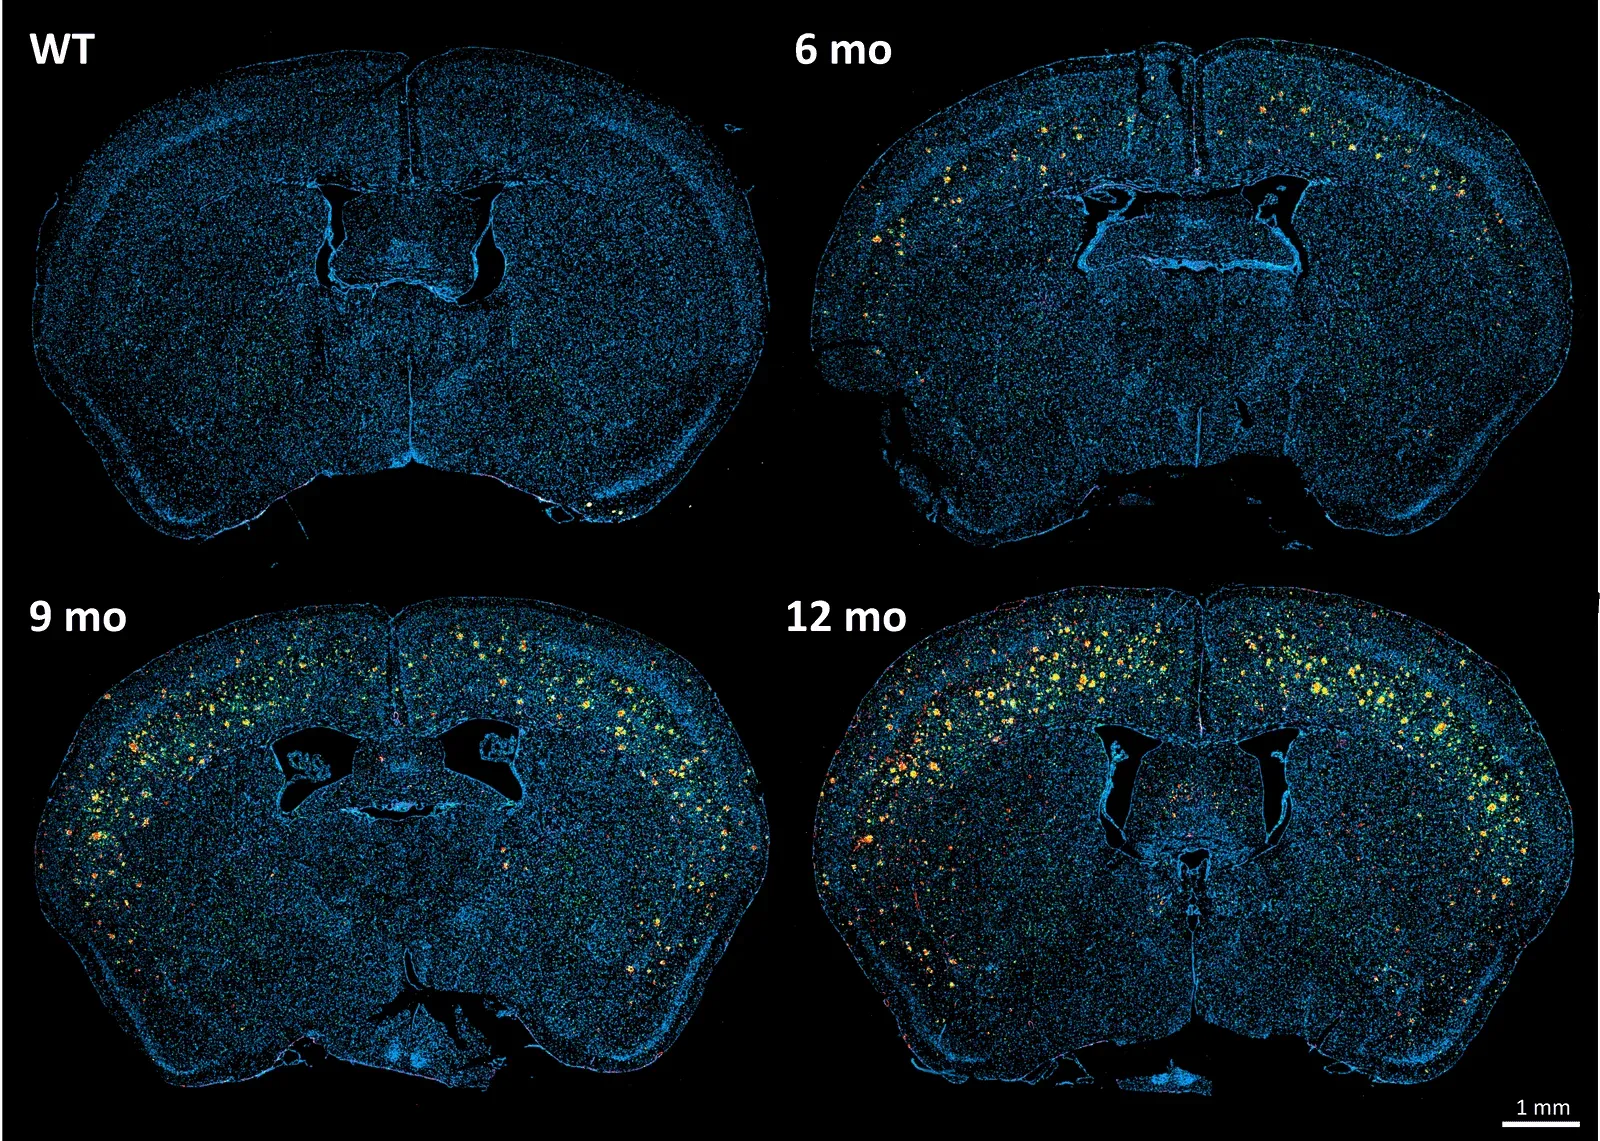
Spatiotemporal progression of amyloid-β and associated glial pathology in an APP/PS1 mouse model of Alzheimer's disease.
Interactive Presentation of Our Research Study
In the "Image Interactive" below, you can find results from our amyloid-beta plaque and inflammatory microenvironment analysis, including high-resolution Multiplex Immunofluorescence tissue sections of brains from the APP/PS1 mouse model and control mice.
How to use Our Interactive Viewer
Navigate through the “Image Story” via the left-hand panel or the on-screen arrows. You can pan around high-resolution microscopy images with your mouse, and zoom in/out using the scroll wheel or the +/- controls. The Control Panel (top-right) allows toggling of image channels and segmentation overlays. For the best experience, we recommend switching to full-screen mode. This Interactive Presentation enables you to explore the model’s neuropathology and associated functional deficits in detail, as if looking directly down the microscope.


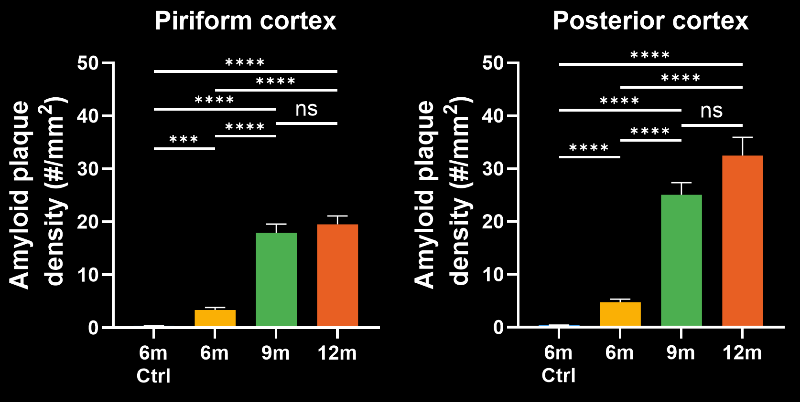
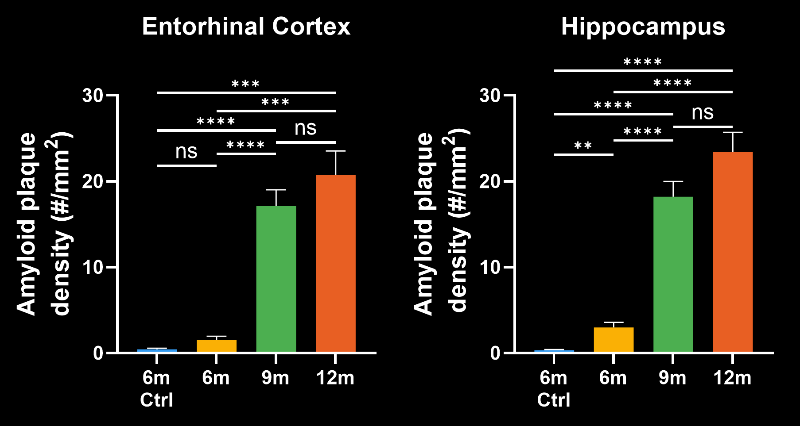
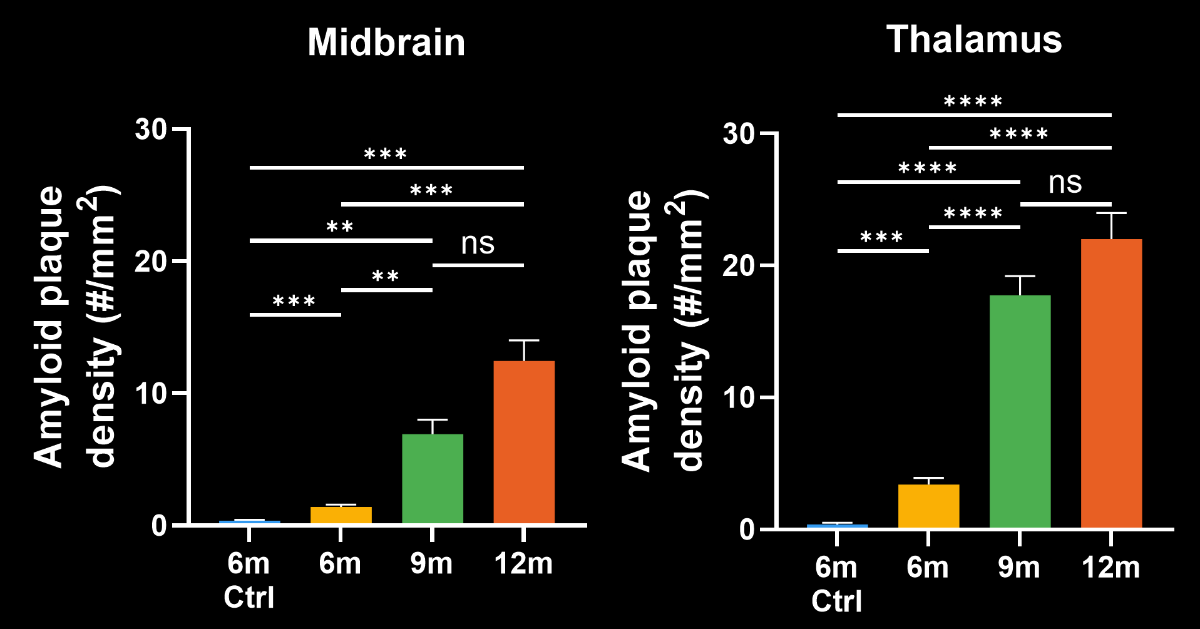
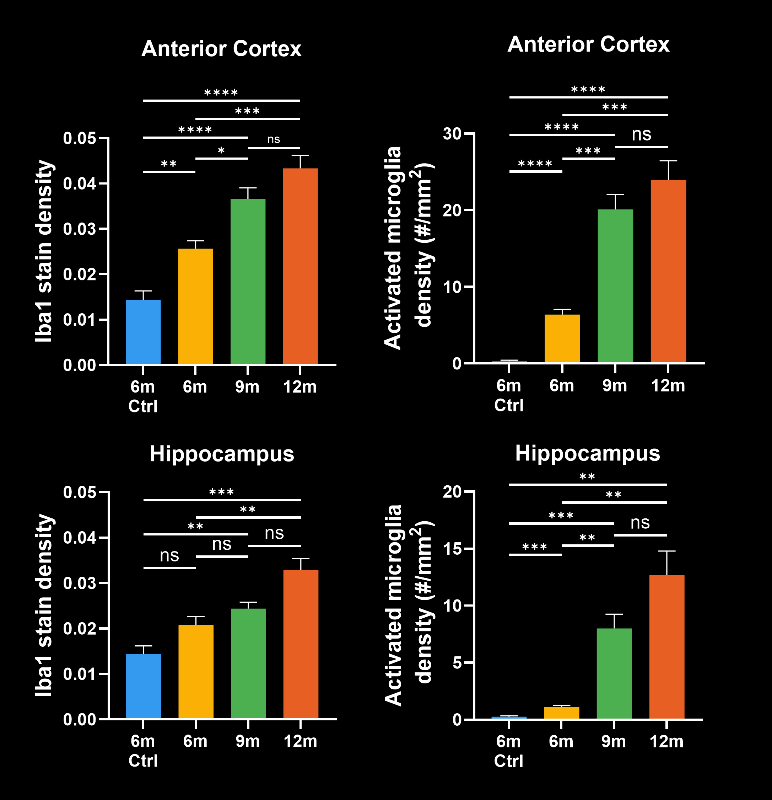
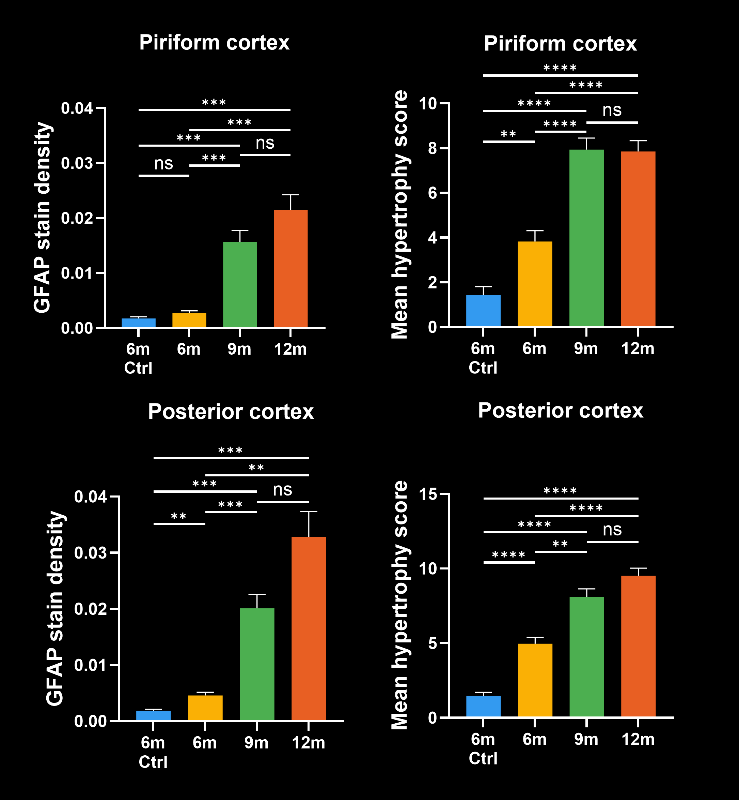
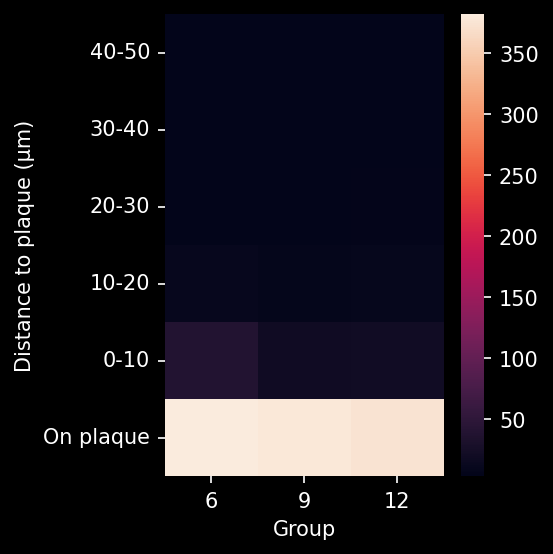
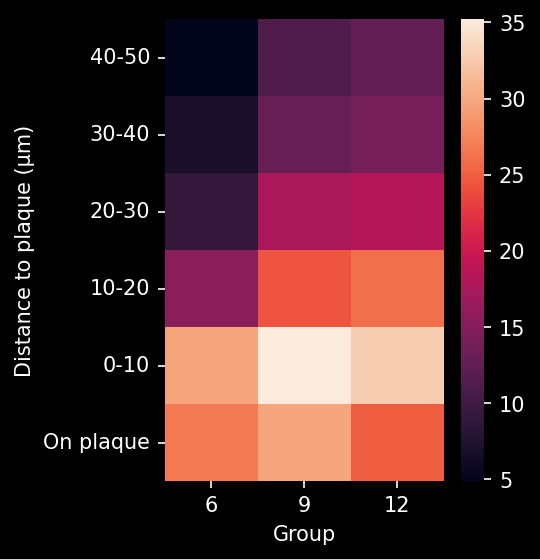
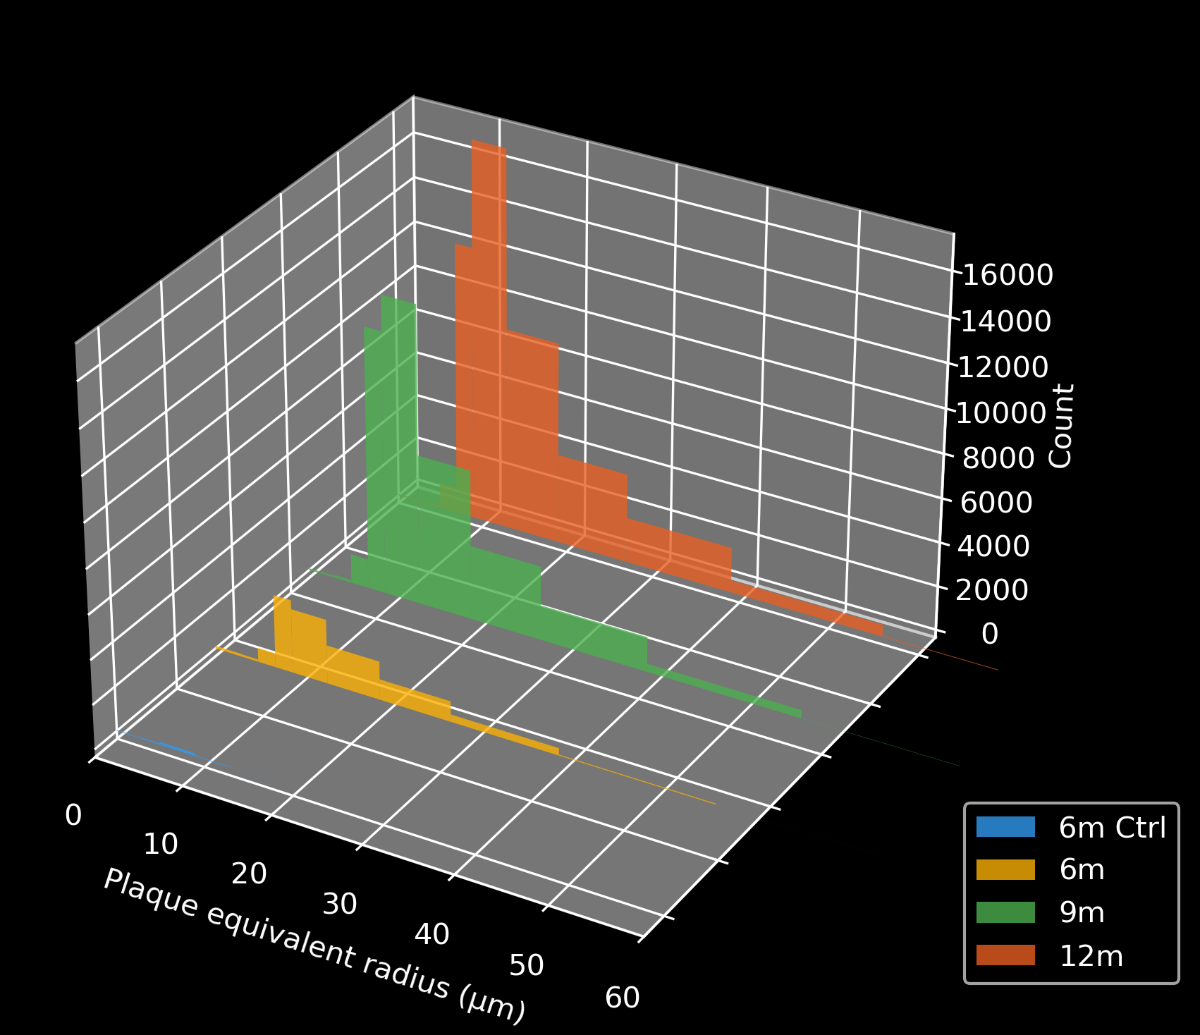
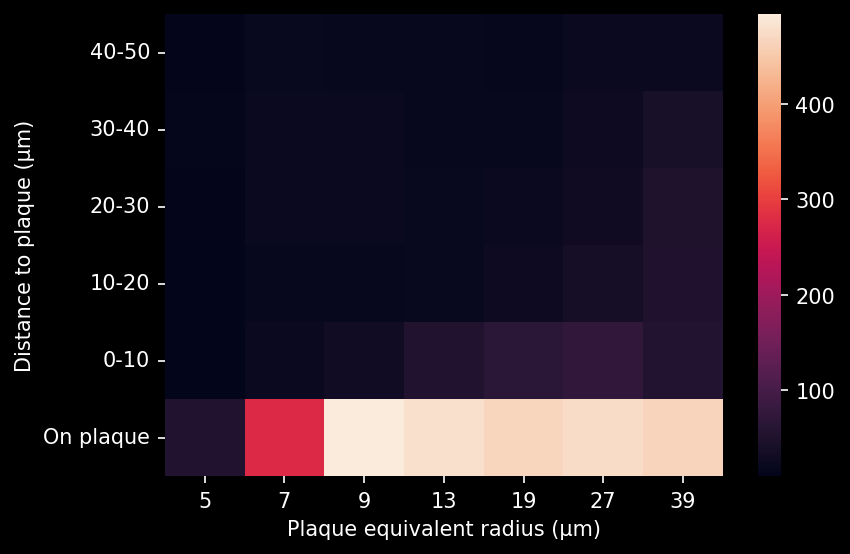
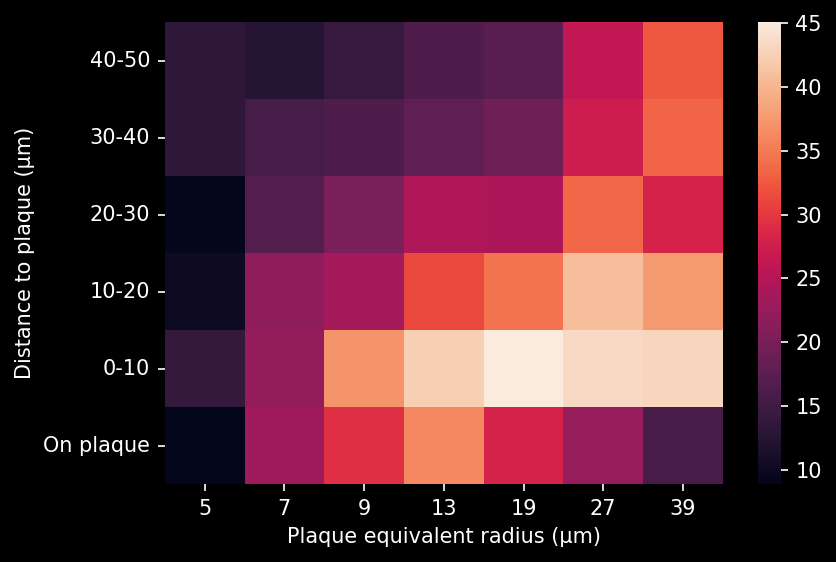
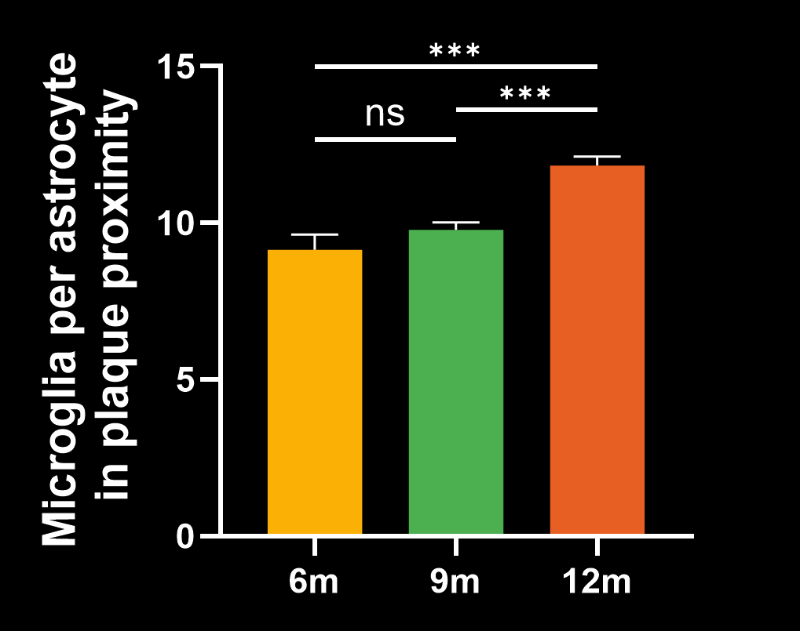
Image Interactive describing our amyloid plaque and neuroinflammatory microenvironment analysis, including high-resolution Multiplex Immunofluorescence brain tissue sections, from the APP/PS1 (ARTE10) mouse model and control mice.
- Click to copy link
Key Advantages of Biospective's Amyloid Plaque Staining & Analysis Services:
- High-sensitivity OC fibrillar amyloid detection
- Optional pan-Aβ, Aβ40, Aβ42, Aβ43 isoform analysis
- Custom antibody/marker staining
- High-throughput, automated whole slide imaging and neuroanatomical region analysis
- Amyloid plaque characterization and quantification
- Glial cell morphology and phenotype analysis
- Advanced neuroinflammation and plaque environment metrics — highly sensitive to small changes in disease progression
- Cross-species (mouse, rat) compatibility
- Complementary services (e.g. fluid biomarkers measured via immunoassays)
Selection of Amyloid Plaque Environment Metrics provided by Biospective's Platform
|
Metric |
Units |
Description |
|
Amyloid plaque density |
Counts per mm² |
Density of amyloid plaques in each anatomical ROI |
|
Stain density |
Fraction |
Fraction of pixels positive for each stain used in multiplex IF or IHC |
|
Density of activated microglia |
Counts per mm² |
Density of microglia classified to a non-ramified morphology |
|
Mean hypertrophy score of astrocytes |
Morphology score |
The average morphology score of detected astrocytes in an ROI |
|
Density of glial cells in plaque microenvironment |
Counts per mm² |
Density of microglia or astrocytes in plaque microenvironment at different distances from the amyloid plaques (e.g. up to 0 µm, 10 µm, 20 µm, 30 µm, etc. away from the plaque) |
|
Microglia-to-astrocytes ratio in plaque proximity |
Unitless |
Ratio between microglia and astrocytes in close proximity to the plaque microenvironment (e.g. up to 10 µm around the plaques). |
|
Plaque morphometrics |
Multiple |
Different morphology metrics can be extracted from the plaque detection, such as plaque size, circularity, etc. |
This table compares the various amyloid plaque environment metrics provided by Biospective's platform.
To discuss your study requirements or request a quote for Amyloid Plaques Staining and Quantitative Analysis services:
Related Content
Up-to-date information on Amyloid Plaque Staining and Quantitative Analysis services.
Amyloid-β Plaque Analysis in Alzheimer's Disease
Overview of methods to classify & quantify Aβ plaques in brain tissue sections from humans & Alzheimer’s disease animal models (transgenic mice & rats).
Amyloid-β & Inflammatory Microenvironment in Alzheimer's Mice
We have analyzed the complex spatial relationships between β-amyloid plaques, activated & resting microglia, and astrocytes in an APP/PS1 transgenic model.
Astrocytes & Amyloid-β Mouse Models of Alzheimer's Disease
Analysis of astrocyte morphology in the amyloid-β plaque microenvironment provides a sensitive measure of disease progression in transgenic mice.
Astrocyte Morphology in Alzheimer's Disease
An overview of astrocyte morphological analysis and the applications to neurodegenerative disease research and drug discovery & development.
Microglia Morphology in ALS, Alzheimer's Disease & Parkinson's Disease
An overview of microglial morphological analysis and the applications to neurodegenerative disease research and drug discovery & development.