Quantitative Amyloid Plaque Microenvironment Analysis in the APP/PS1 Mouse Model
APP/PS1 Amyloid-Beta Transgenic Mouse Model of Alzheimer's Disease
Validated APP/PS1 mouse model of Alzheimer's disease supported by translational biomarkers.
Preclinical neuroscience CRO with unique amyloid models expertise for Alzheimer's drug development.
Biospective's APP/PS1 mouse model of Alzheimer’s disease develops progressive amyloid-beta pathology with a well-defined spatiotemporal pattern. This robust amyloid model demonstrates Aβ plaques, cerebral amyloid angiopathy (CAA), neurodegeneration, and neuroinflammation (including activated microglia & reactive astrocytes). Biospective offers this validated APP transgenic mouse as part of its preclinical CRO services, supporting efficacy testing and target engagement studies using translational endpoints.
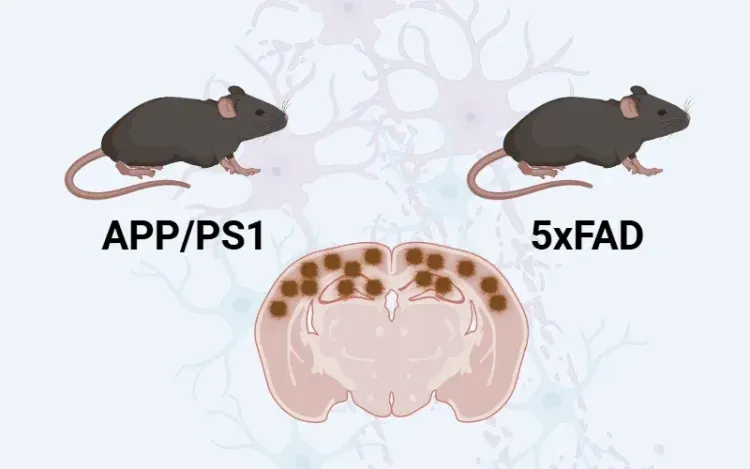
While a range of APP transgenic mouse models of Alzheimer's disease with human amyloid-beta expression exist, they each have their respective strengths and weaknesses. Our APP/PS1 transgenic mice are well-suited for preclinical studies to support drug development pipelines, including efficacy testing, mechanism-of-action studies, PK/PD, and target engagement. A comparison of the APP/PS1 model to the 5xFAD mouse model can be found in our Resource - 5xFAD Mice & APP/PS1 Mice - A Comparison of Amyloid-β Mice for Alzheimer's Drug Development.
In this model, we have rigorously validated pathologic changes in the brains of these mice, including Aβ-related pathology, activated microglia, reactive astrocytes, and the spatial relationships between plaques and the neuroinflammatory microenvironment. We are well resourced to handle large-scale studies to generate high-quality data for our global biotech and pharmaceutical partners.
Overview of the APP/PS1 Model of Alzheimer's Disease
An mouse model with APP and PS1 mutations that is well-suited for preclinical drug development.
At Biospective, we have validated the APP/PS1 (ARTE10) transgenic mouse model of Alzheimer's disease. These mice feature pathologic changes that mimic of these key hallmarks of human disease, including:
-
Amyloid-beta (Aβ) plaques: Plaques begin to form in the anterior cerebral cortex at ~3 months-of-age and then progress with a time-dependent increase in burden and spatial extent.
-
Cerebrovascular amyloid: Aβ deposits in leptomeningeal vessels and deep arterioles.
-
Robust neuroinflammation: Pronounced activation of microglia and reactive astrocytes in the "neighborhood" of the plaques.
- Predictable time course: The spatiotemporal progression of pathology is well understood and the readouts are reproducible.
These mice are readily available at Biospective at ages appropriate for preclinical therapeutic studies.
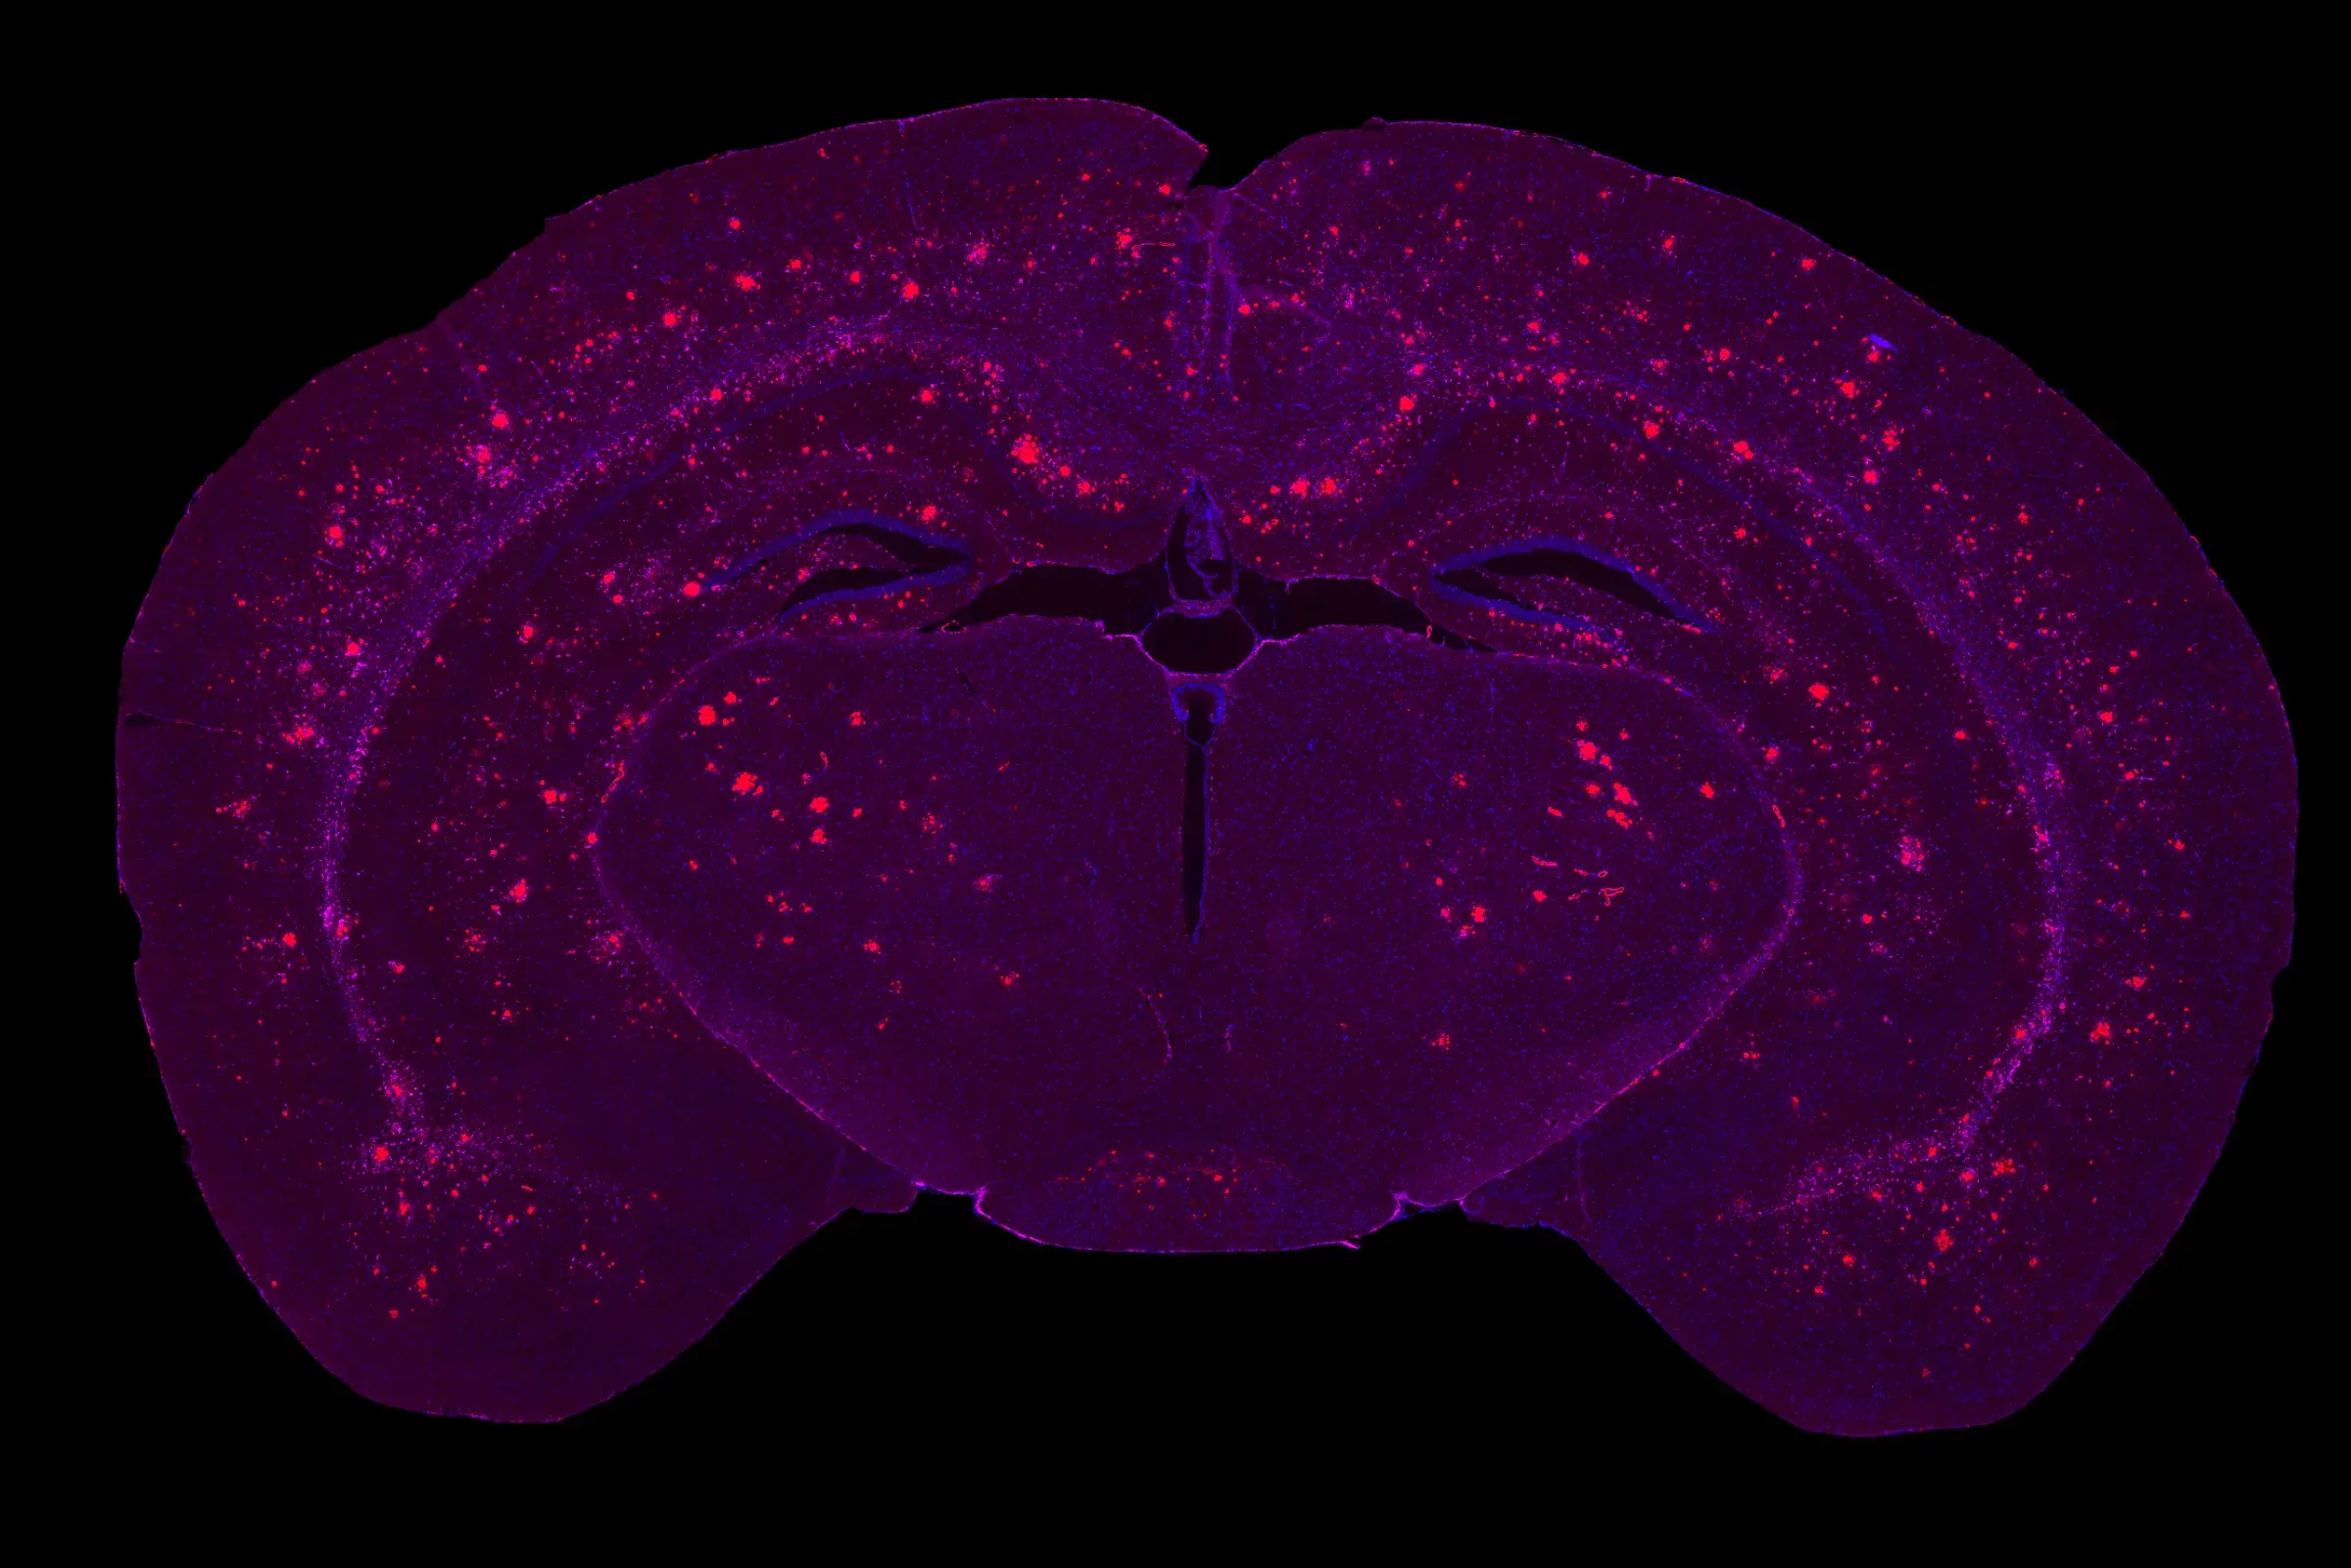
Multiplex IF of the brain of a 9 month-old APP/PS1 mouse showing a high Aβ pathology burden.

Time-dependent β-amyloid plaque formation in the frontal cortex of APP/PS1 mice.
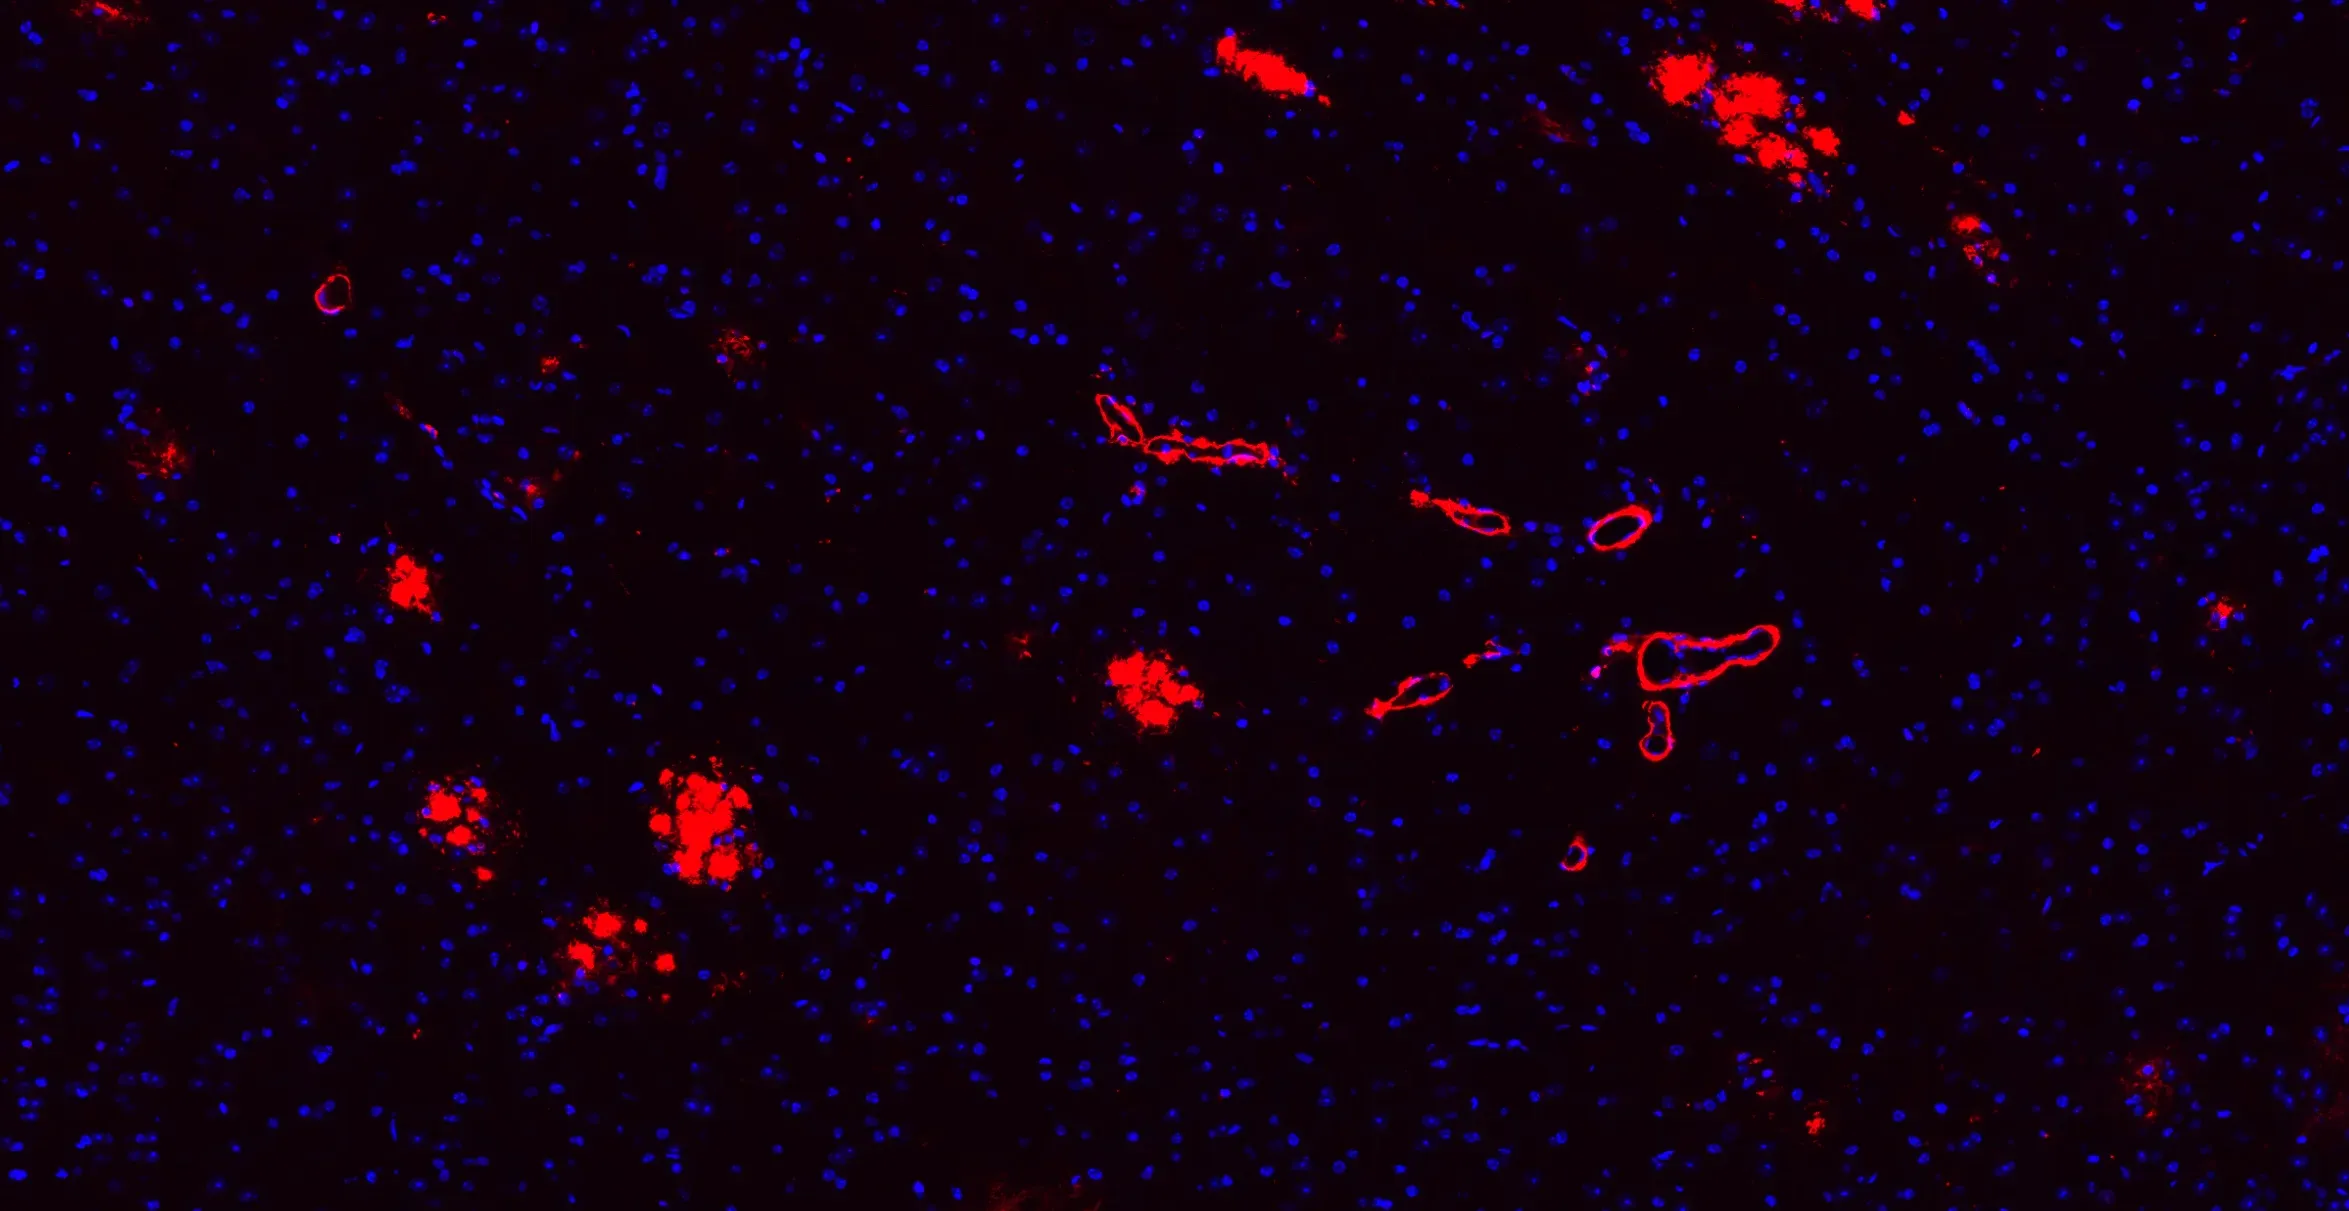
Aβ plaques & cerebrovascular amyloid angiopathy (CAA) in 9 month-old APP/PS1 mice.
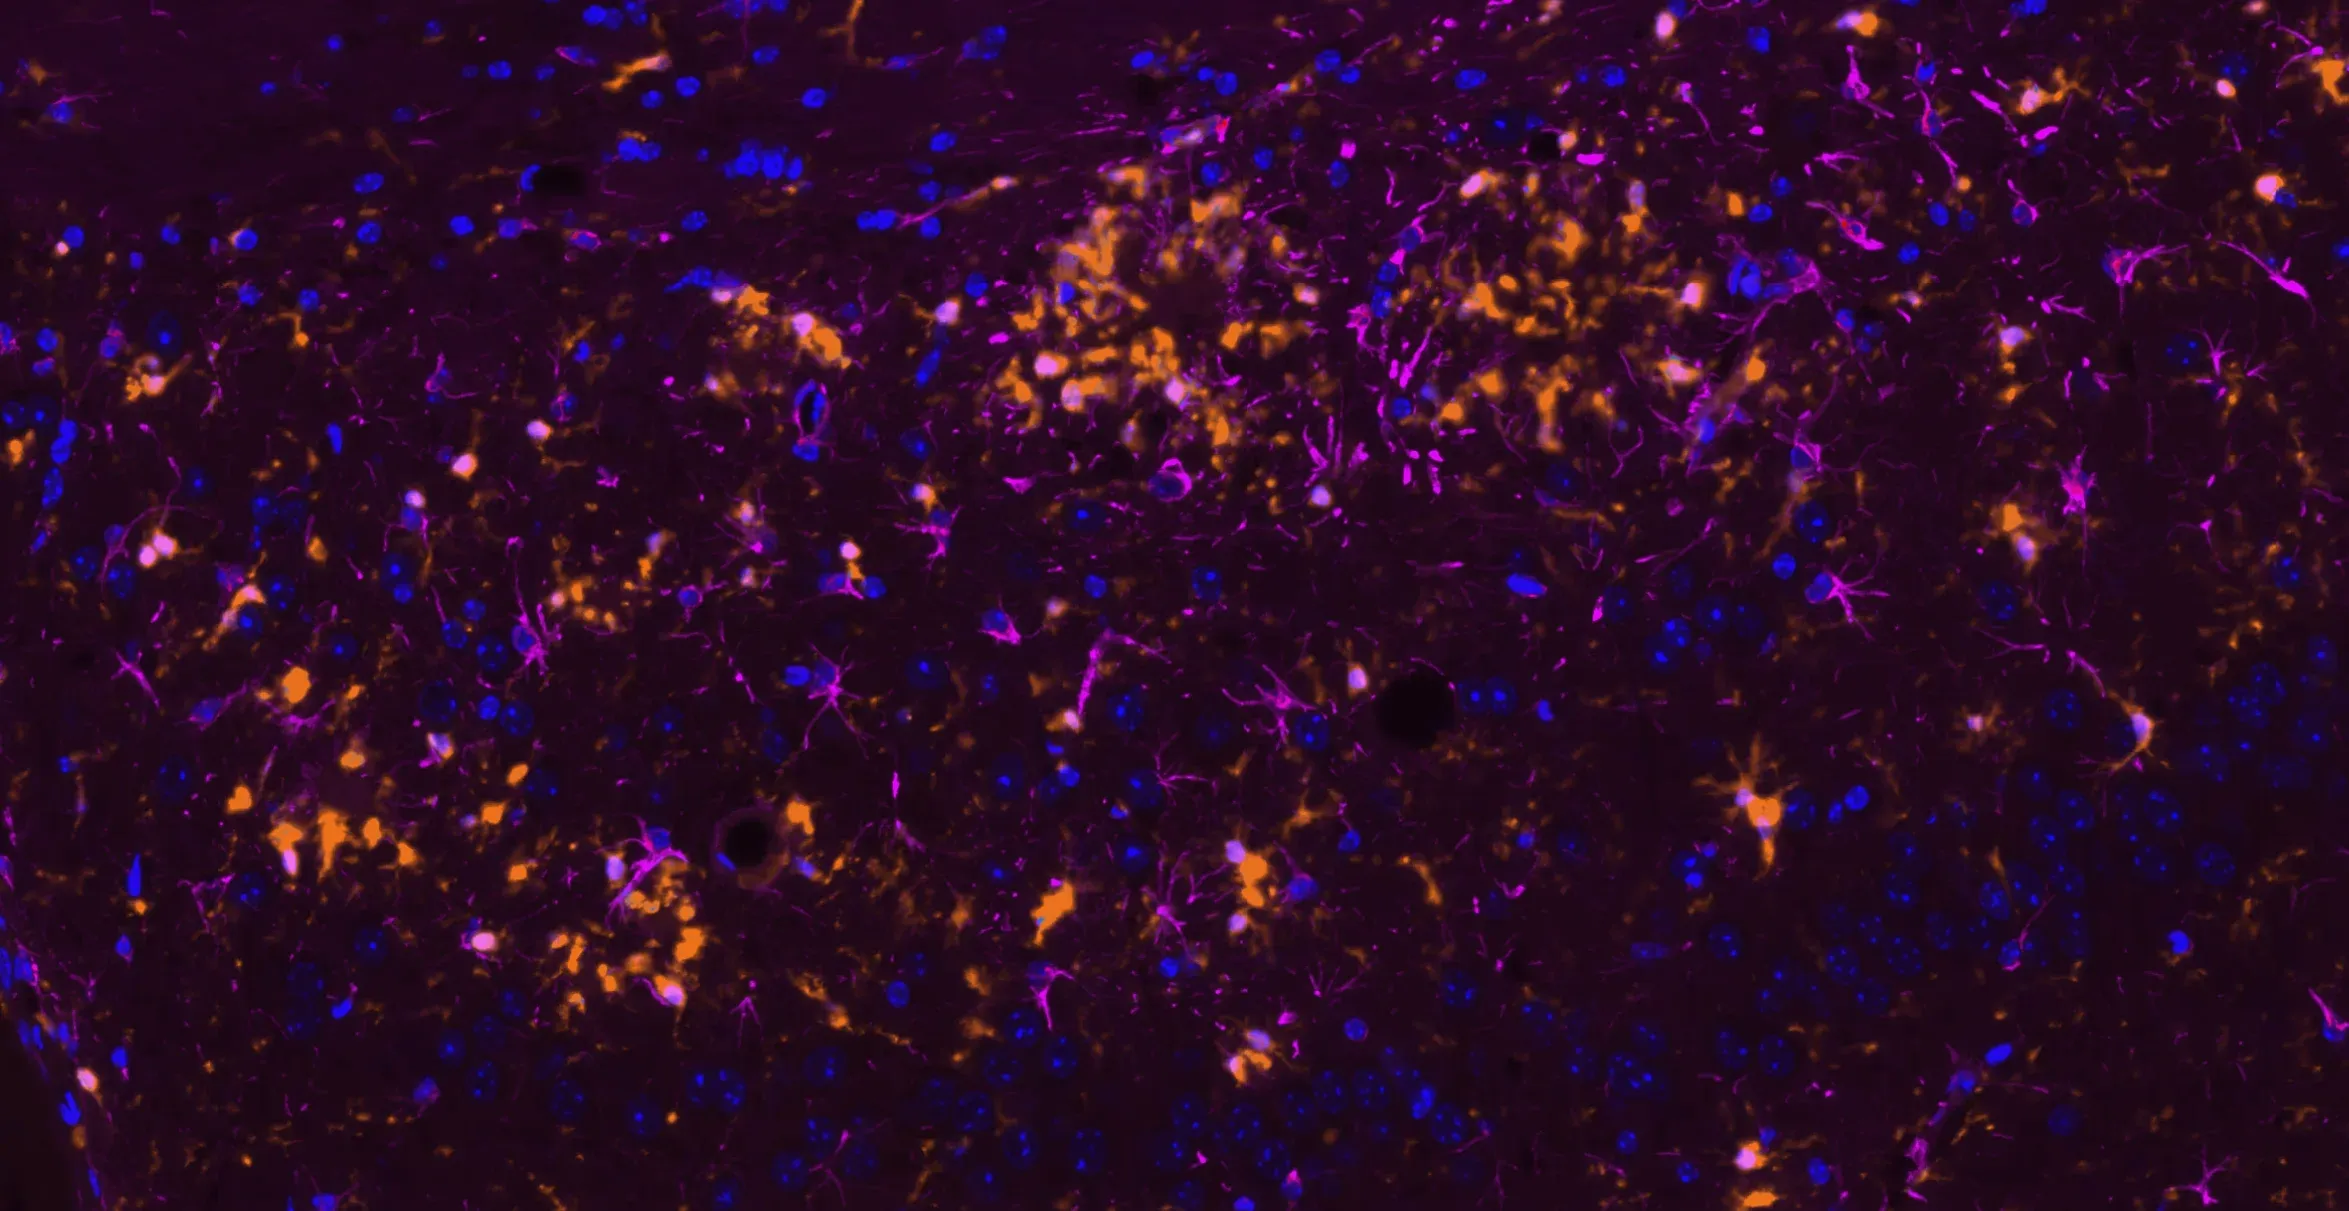
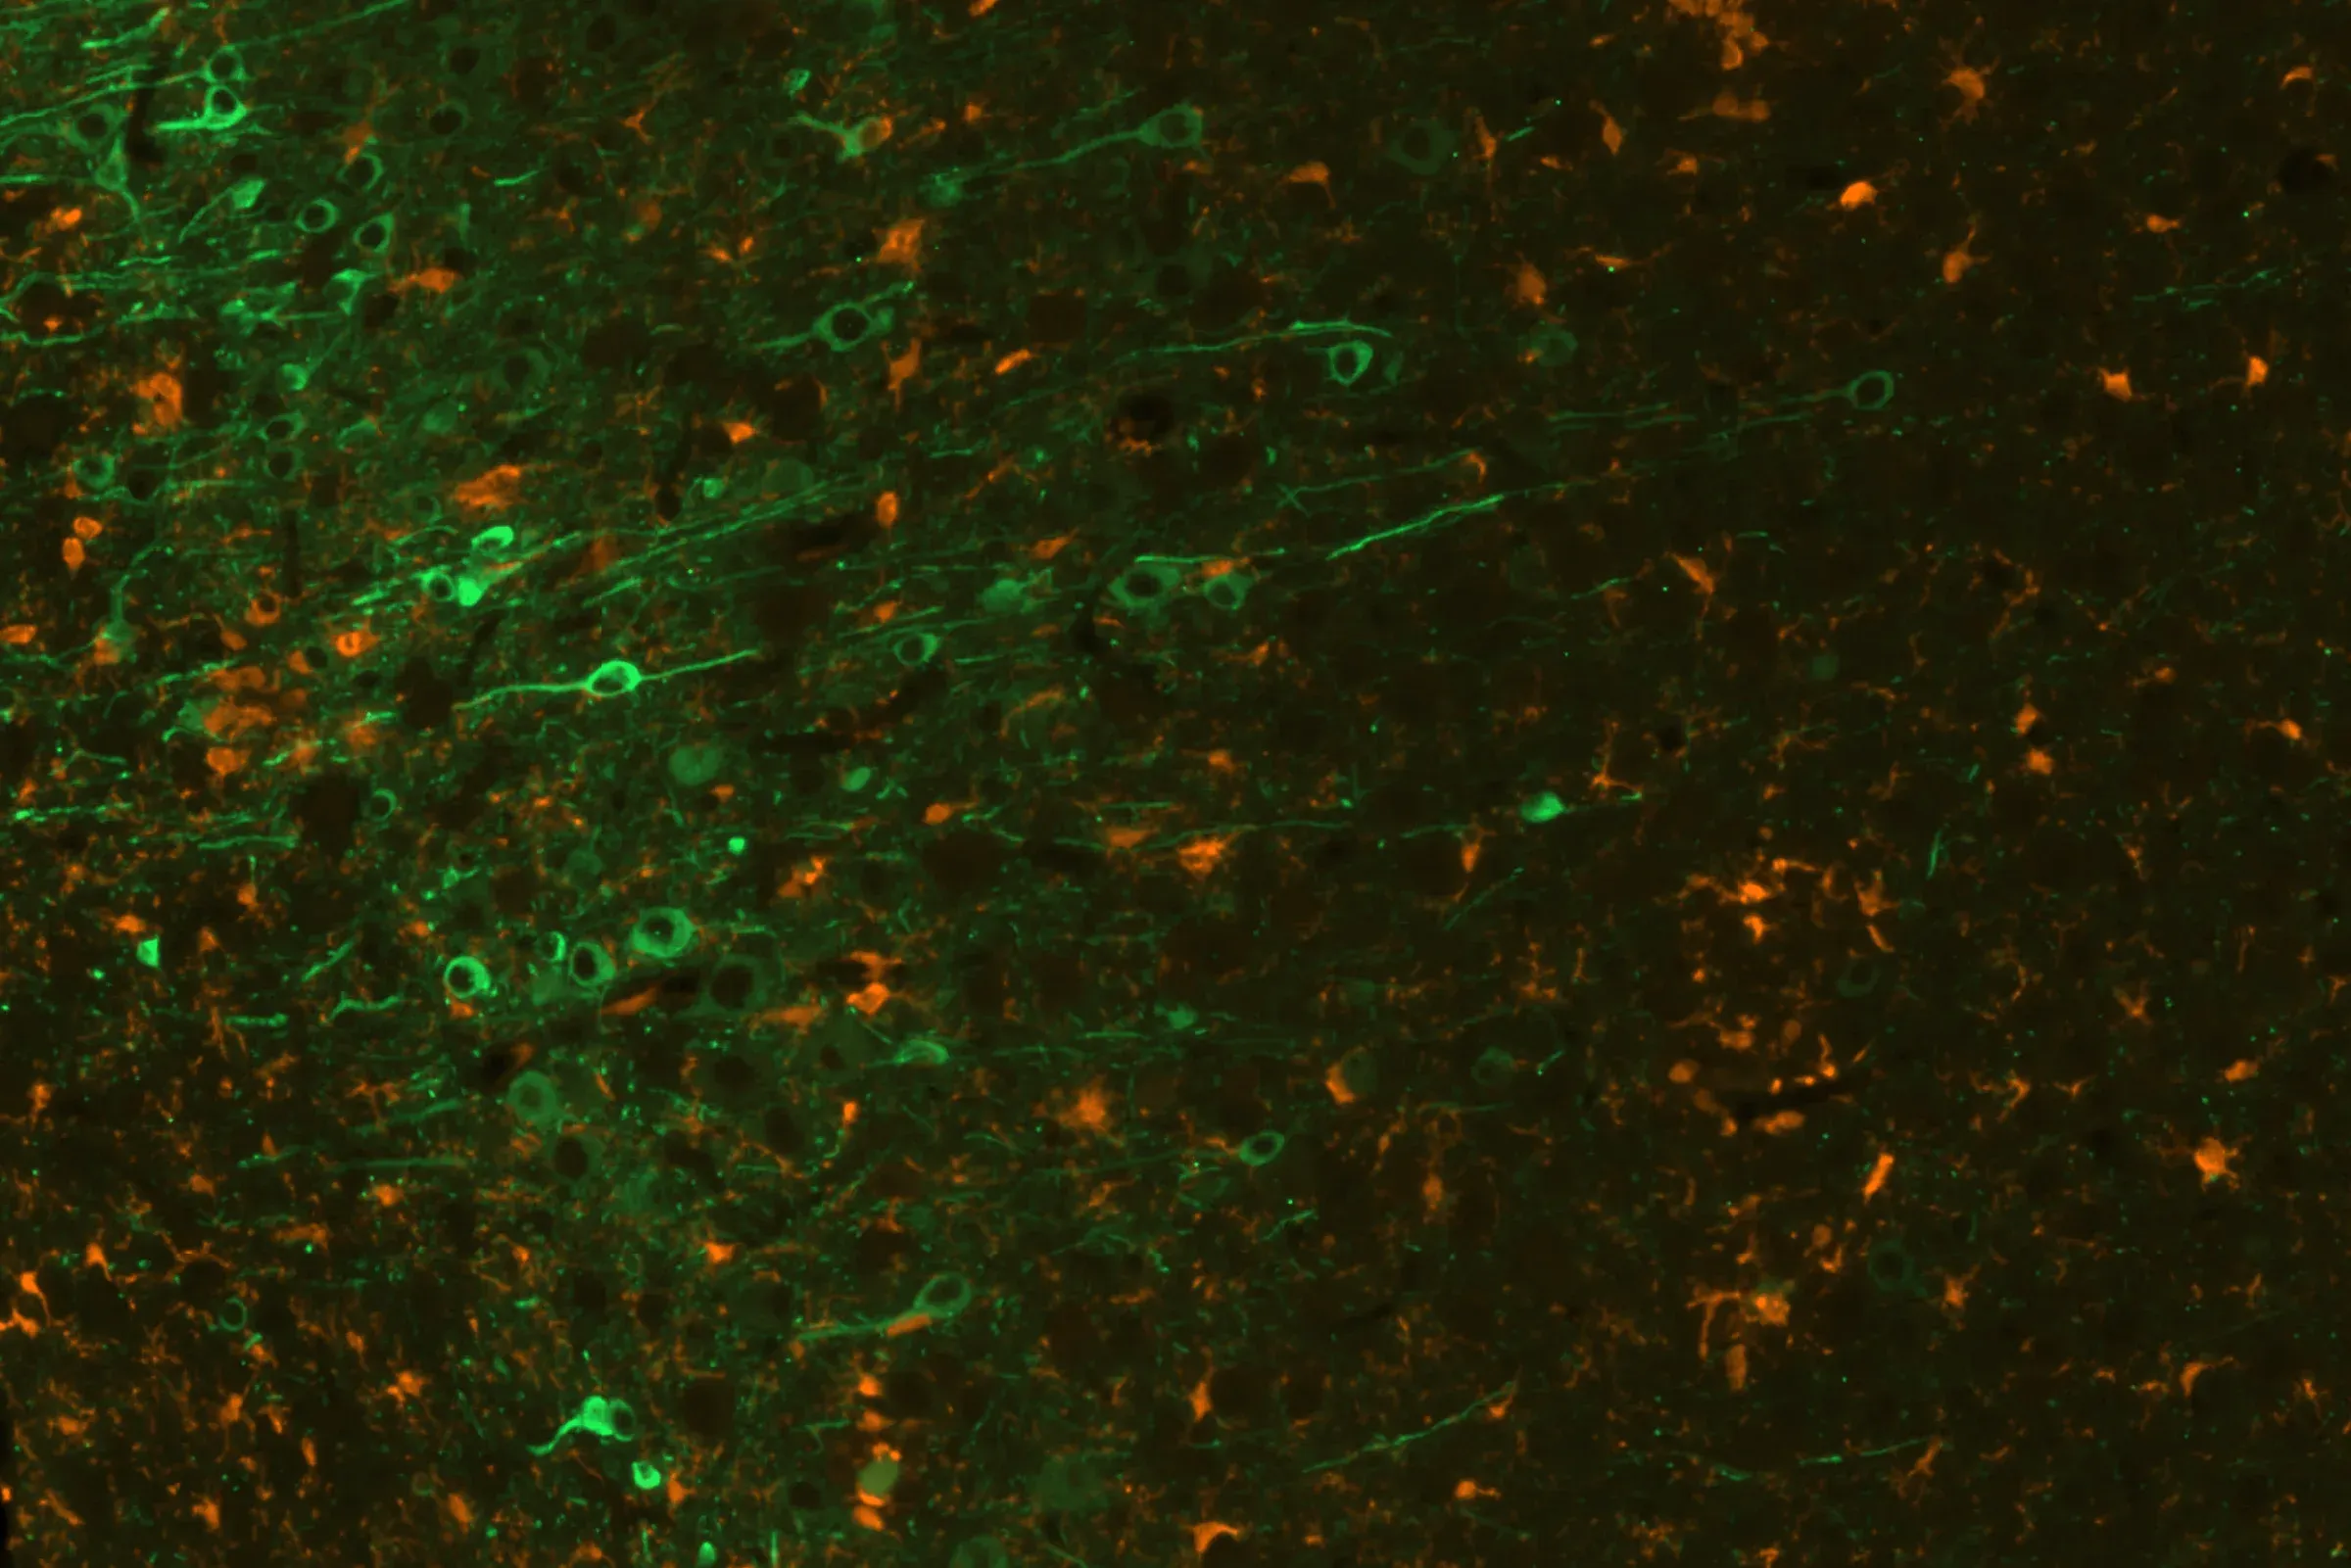
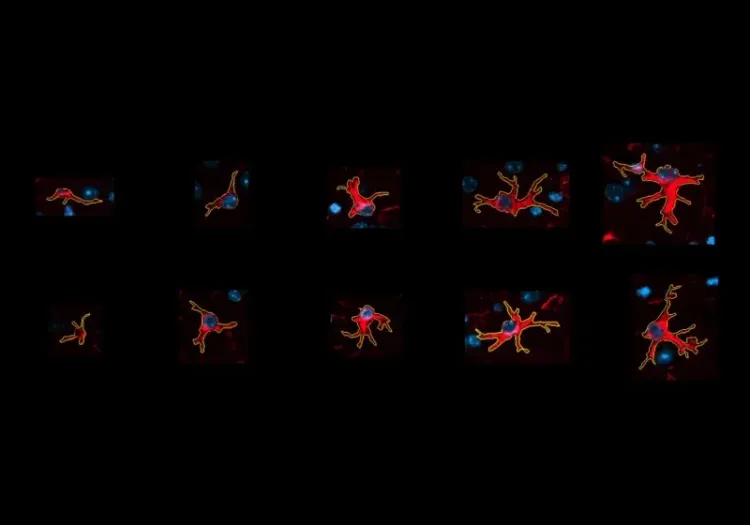
Microglia (Iba1; orange) and astrocytes (GFAP; violet) in the cerebral cortex of APP/PS1 mice.
A Novel Model of Alzheimer's Disease — Biospective's Amyloid-β and Tau Co-Pathology Mouse
An innovative mouse model based on AAV-driven expression of human tau in APP/PS1 mice.
A current limitation of many models of Alzheimer's disease is that they do not fully capture the spectrum of pathology that defines the human disease. To overcome this obstacle, our team at Biospective has developed and characterized a "co-pathology" model that combines transgenic (APP/PS1 mice) and AAV vector-based methodologies.
This co-pathology model features the Aβ pathology characteristic of the APP/PS1 mouse, as well as intracellular phosphorylated wild-type human tau. In addition, this mouse model develops marked neuroinflammation, neurodegeneration, and associated functional impairments, reflecting the complex pathological interactions relevant to human Alzheimer's disease.
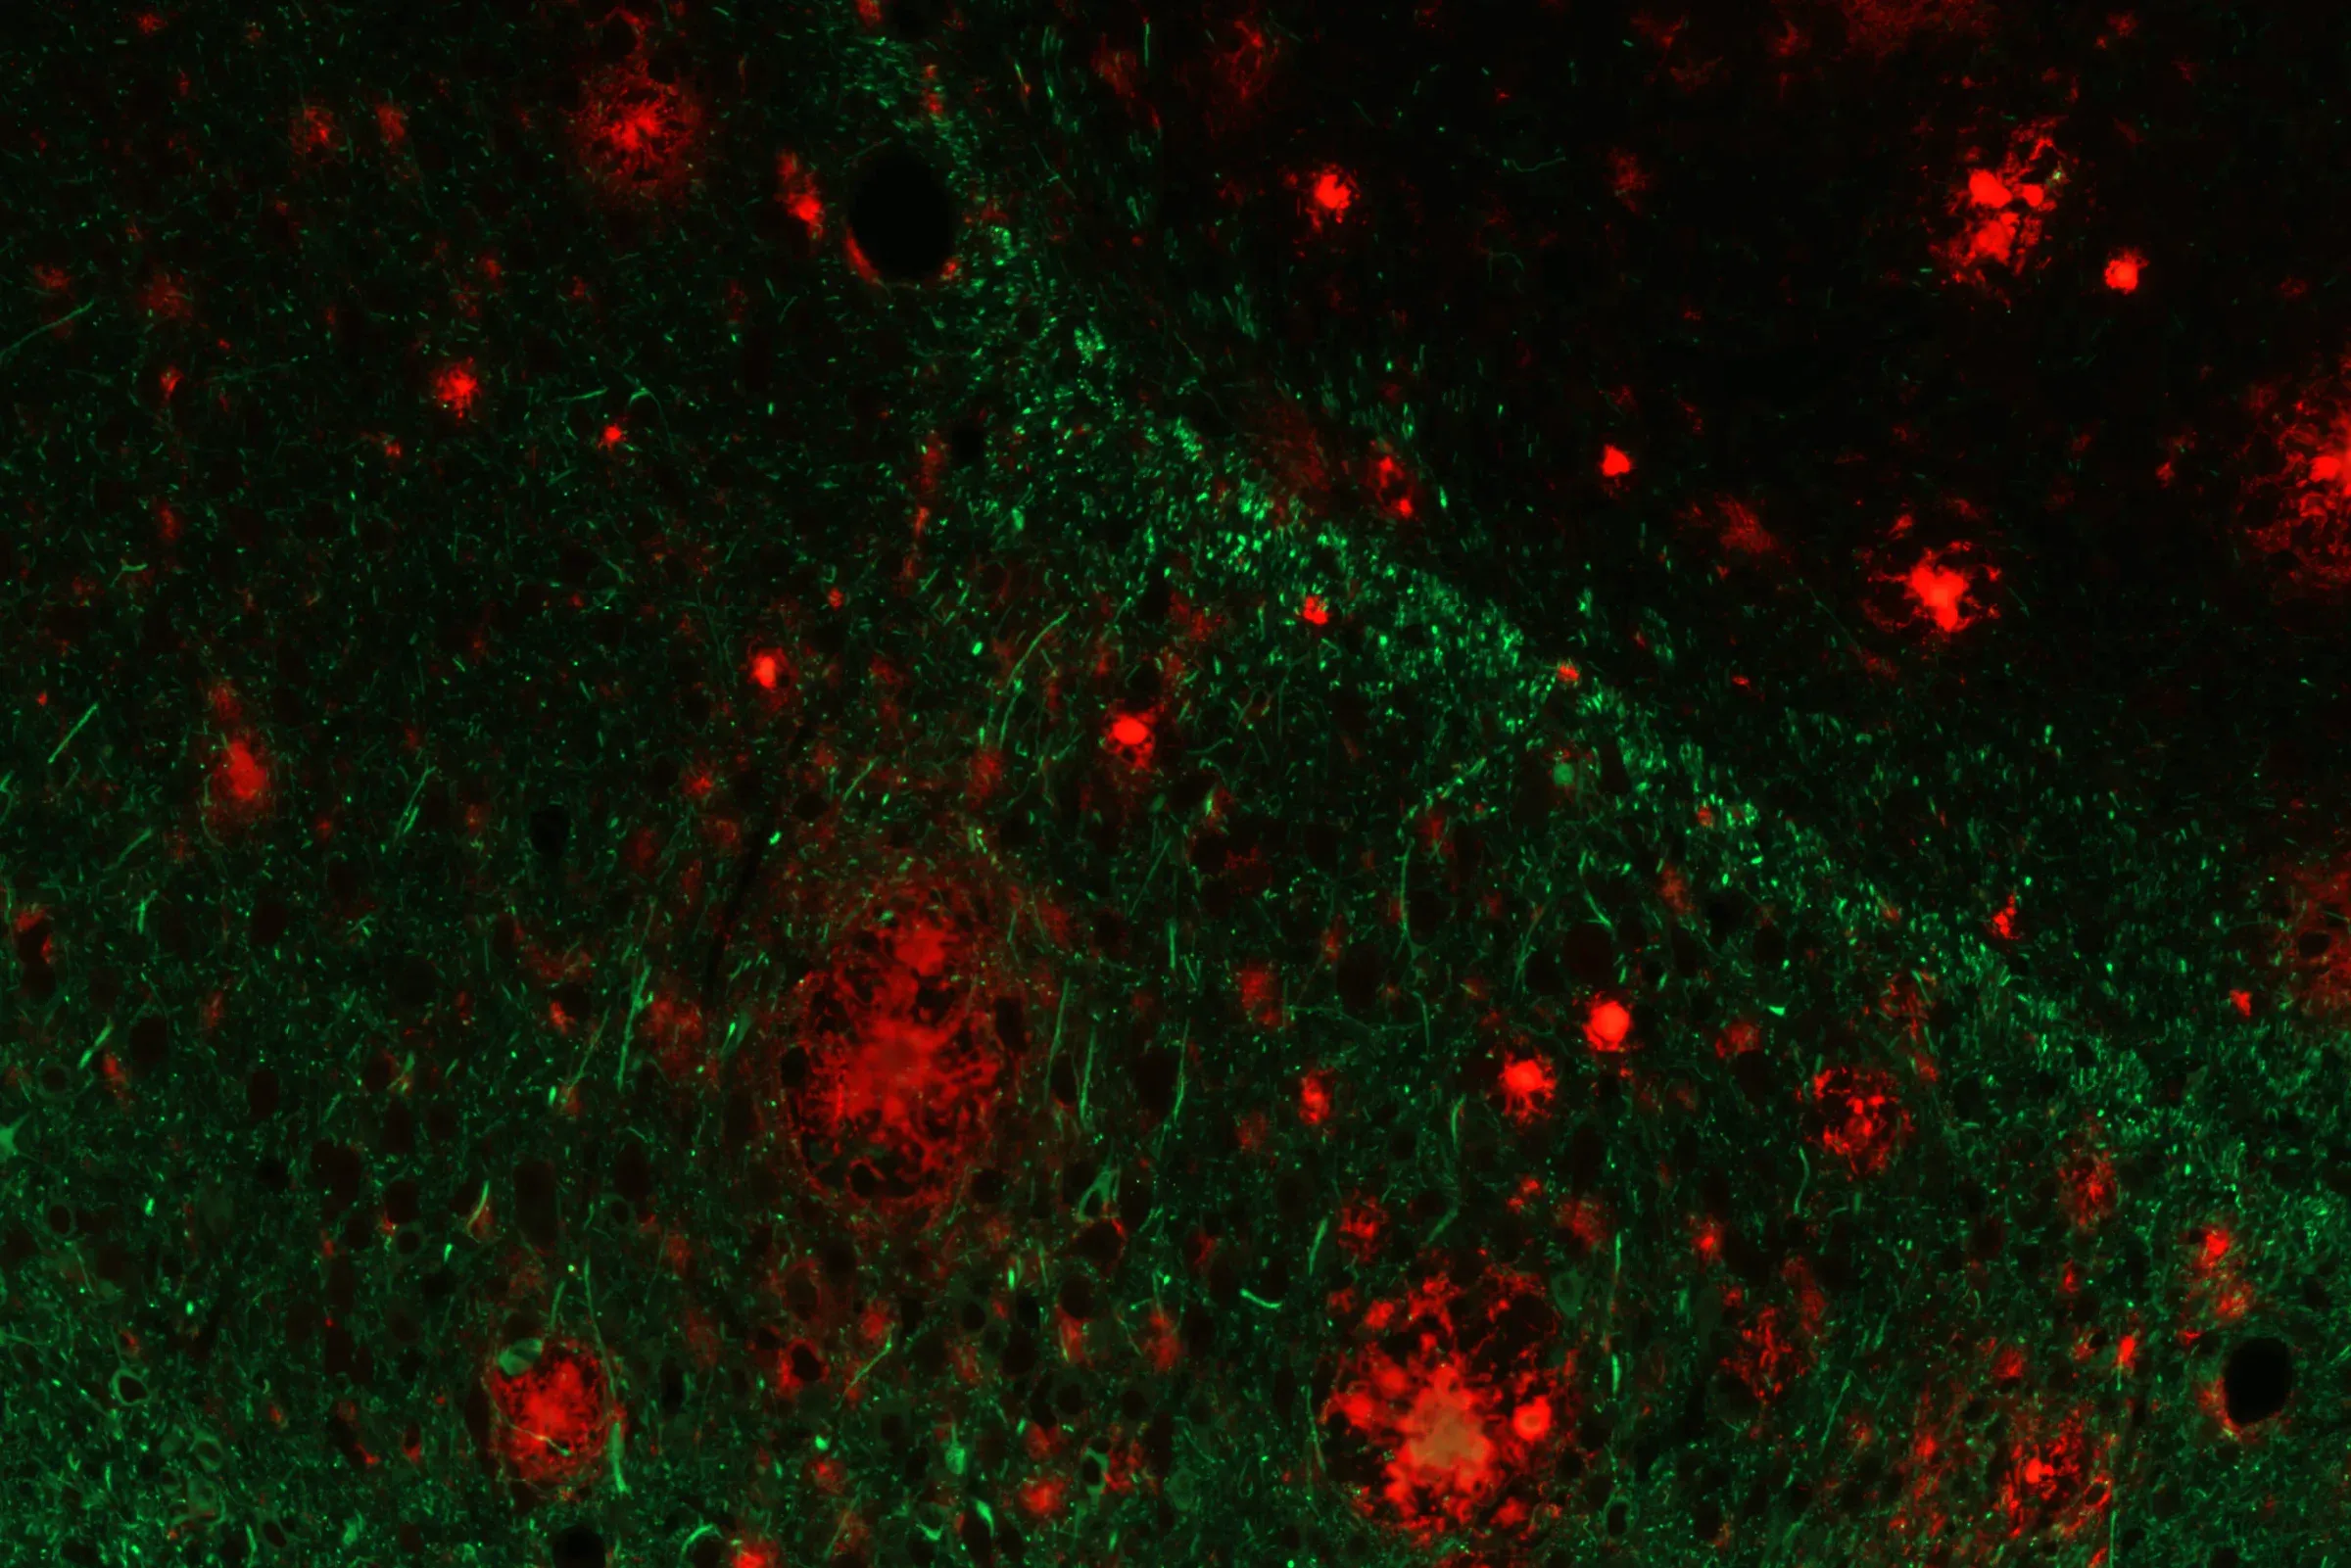
Amyloid-beta (red) and phospho-tau (green) demonstrating the co-pathology in this novel Alzheimer's disease mouse model.
Phosphorylated tau (AT8; green) & microglia (Iba1; orange) in the cerebral cortex of the Biospective's co-pathology mice.
Learn more about Biospective's novel Aβ & tau co-pathology model and its applications in Alzheimer's disease drug development.
Research Study — Spatiotemporal Evolution of Amyloid Plaques & Neuroinflammation in APP/PS1 Mice
A detailed characterization of Aβ plaques and the "inflammatory microenvironment" in the APP/PS1 Alzheimer's disease mouse model.
In this research study, the Biospective team has characterized the progression of pathology in the APP/PS1 amyloid-beta mouse model of AD. Mice were studied at 6, 9, and 12 months-of-age, and compared to control 6 month-old mice using our proprietary, automated image processing & analysis platform.
Animated workflow for Aβ plaque microenvironment analysis.
In this research study, we found:
- A progressive, highly significant, stepwise increase in the density of amyloid plaques in the different age groups.
- A global increase in neuroinflammation, as quantified by microglia (Iba1) and astrocyte (GFAP) stain density, in a spatiotemporal pattern that follows the amyloid-beta pathology.
- Advanced metrics that provide more sensitive measures of the disease state:
- The density of activated microglia
- The mean astrocyte hypertrophy score
- The ratio of microglia-to-astrocytes in the plaque proximity
- The higher sensitivity of these advanced metrics would mean that, in the context of a preclinical therapeutic efficacy study, a smaller effect could be detected using the same number of animals. In addition, these metrics would be particularly relevant for therapeutics that target microglia, astrocytes, microglia-astrocyte interactions, or the interaction of glial cells with Aβ plaques.
Interactive Presentation of our Research Study
In the "Image Interactive" below, you can find results from our amyloid-beta plaque and inflammatory microenvironment analysis, including high-resolution Multiplex Immunofluorescence tissue sections of brains from the APP/PS1 mouse model and control mice.
How to use Our Interactive Viewer
Navigate through the “Image Story” via the left-hand panel or the on-screen arrows. You can pan around high-resolution microscopy images with your mouse, and zoom in/out using the scroll wheel or the +/- controls. The Control Panel (top-right) allows toggling of image channels and segmentation overlays. For the best experience, we recommend switching to full-screen mode. This Interactive Presentation enables you to explore the model’s neuropathology and associated functional deficits in detail, as if looking directly down the microscope.


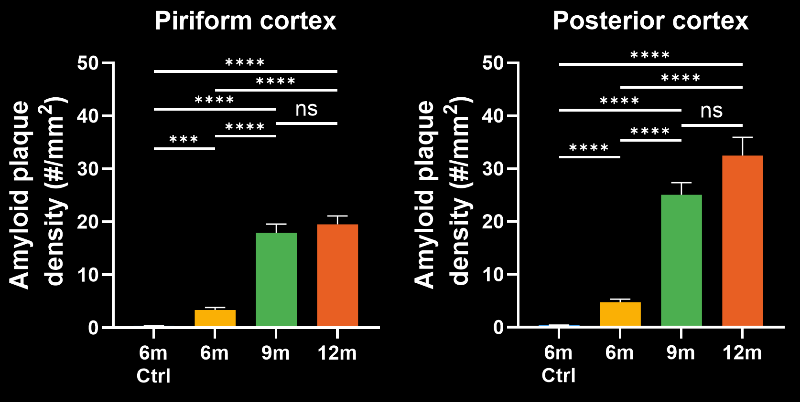
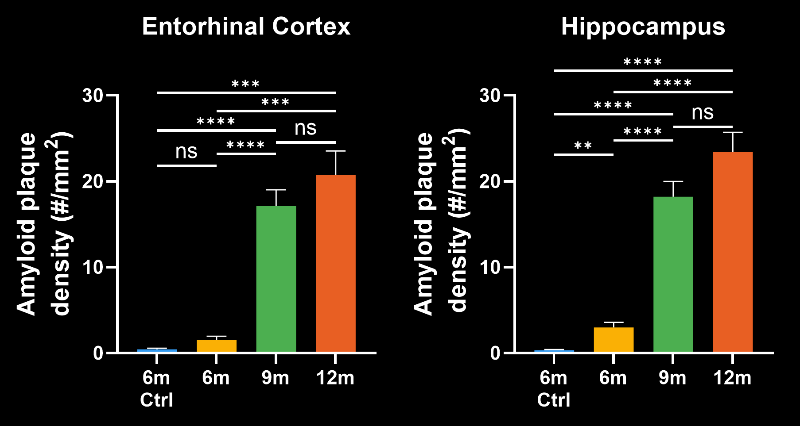
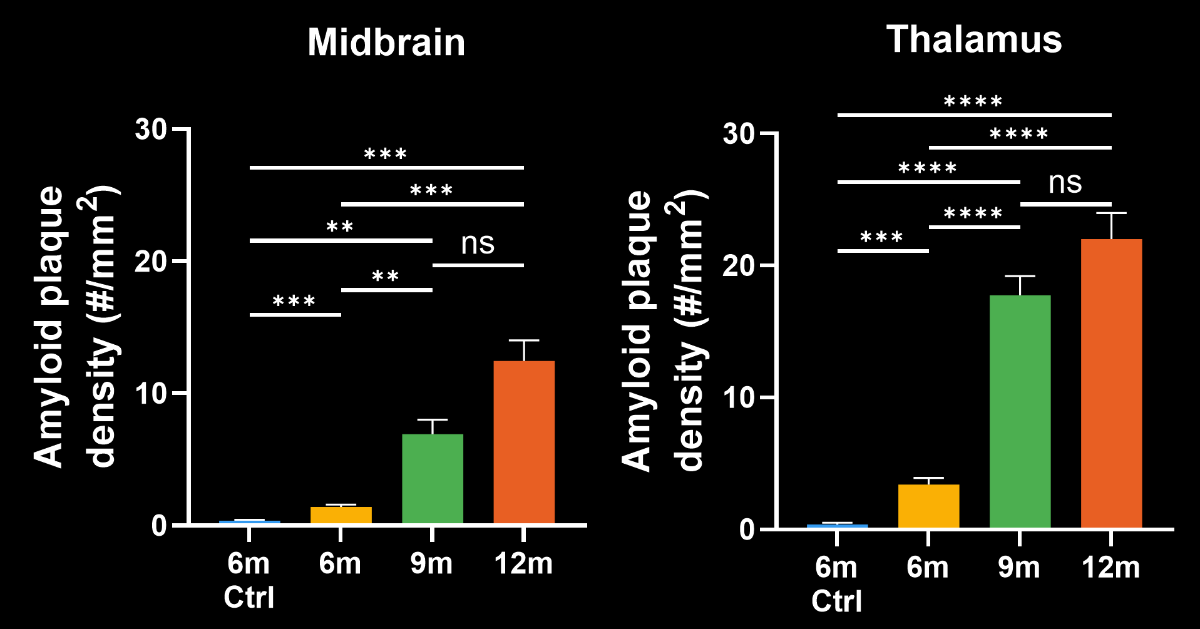
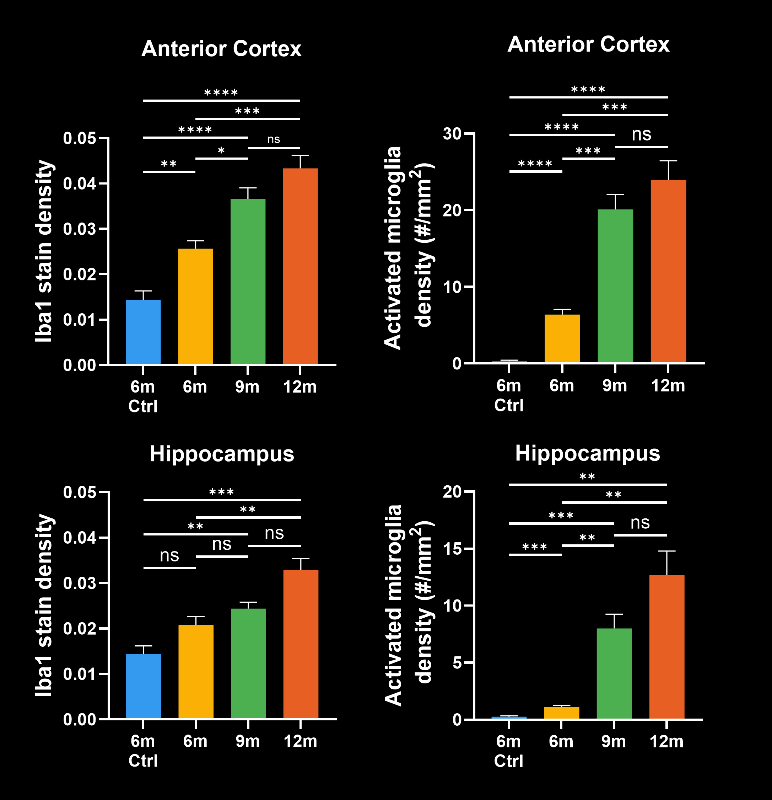
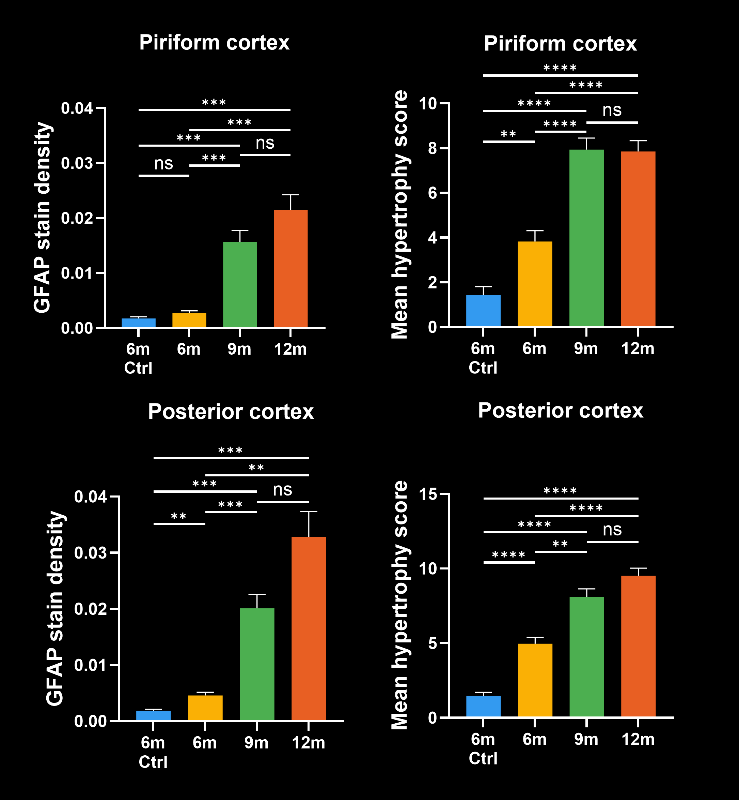
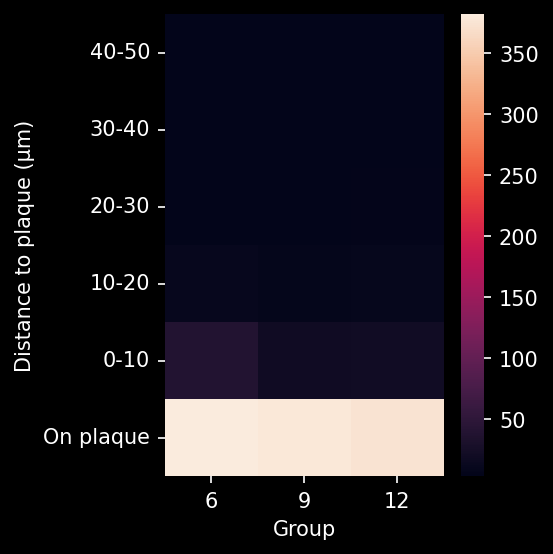
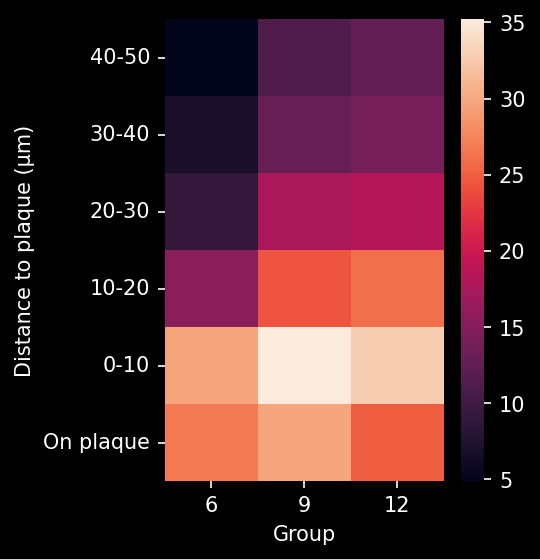
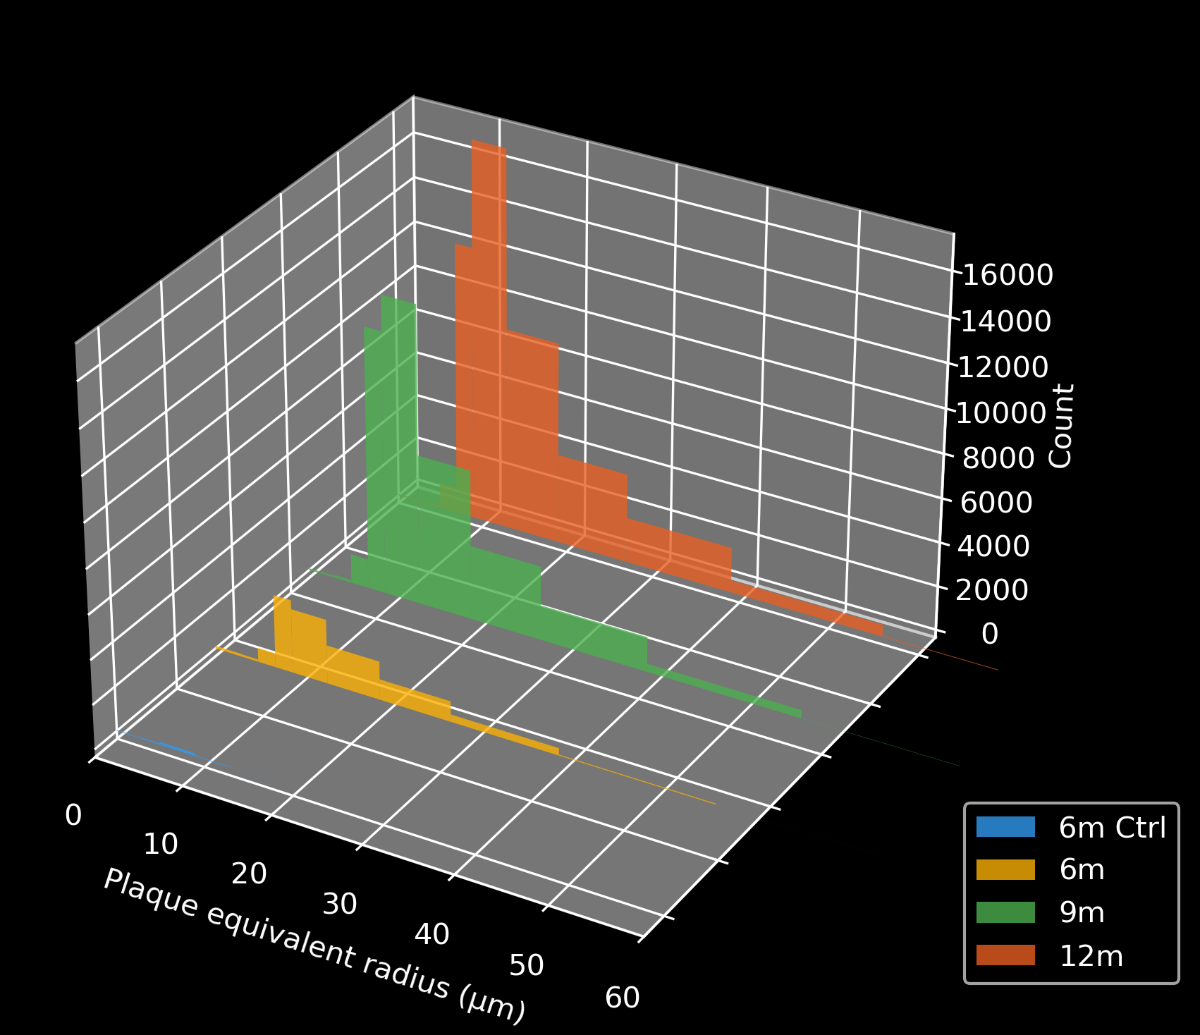
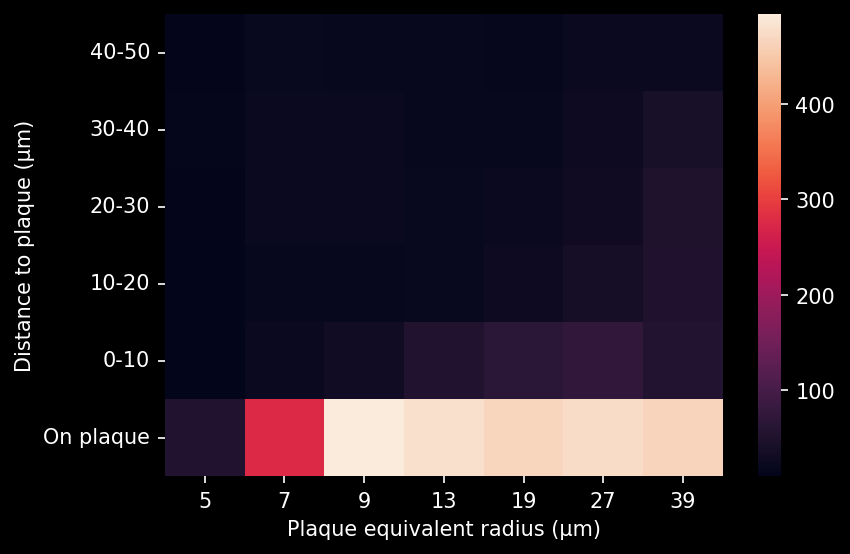
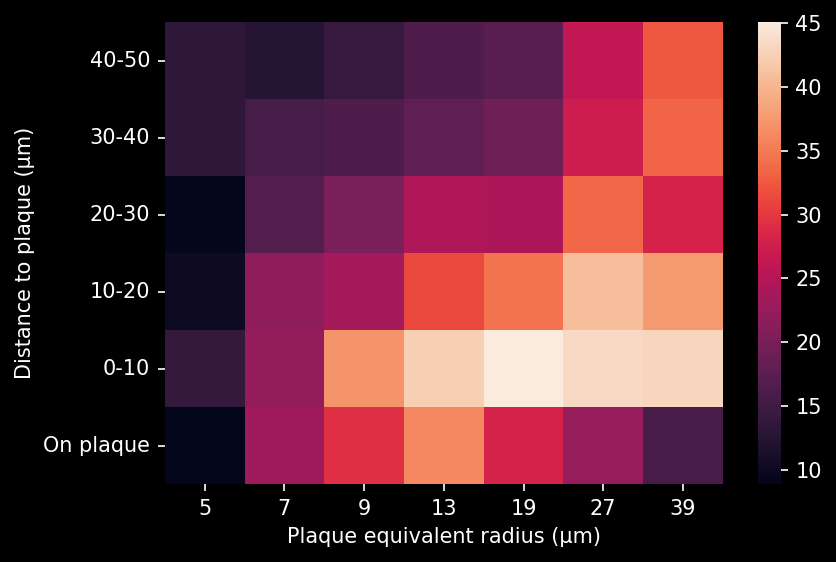
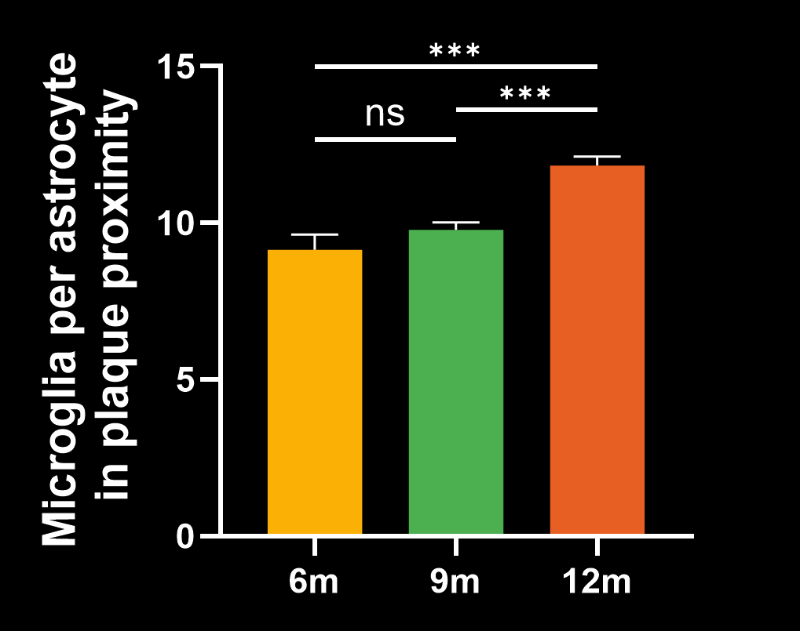
Image Interactive describing our amyloid plaque and neuroinflammatory microenvironment analysis, including high-resolution Multiplex Immunofluorescence brain tissue sections, from the APP/PS1 (ARTE10) mouse model and control mice.
 Click to copy link
Biospective's APP/PS1 Model Expertise and Services
Biospective is a global neuroscience CRO with extensive experience in Alzheimer's disease animal models.
Our team at Biospective has 15+ years of experience conducting studies in Alzheimer's disease models. As such, we have unique expertise in the best use of these mice in preclinical drug development. Some key advantages of partnering with Biospective for Alzheimer's disease model studies studies include:
-
Extensive Experience & Model Characterization: We have extensively characterized the APP/PS1 model through numerous studies. Our track record underscores our unique expertise with this AD model.
-
End-to-End Preclinical Services: Biospective provides integrated services from study design through execution and data analysis. Our capabilities include comprehensive in-life assessments (behavioral testing, motor function assays, etc.), neuroimaging (MRI, CT), bioanalysis (fluid biomarkers, IHC & multiplex immunofluorescence), and expert data interpretation. This one-stop approach ensures consistency and accelerates timelines.
-
Translational Biomarkers & Readouts: We incorporate translational endpoints that bridge preclinical findings to clinical outcomes. Our immunoassay capabilities include quantitative measures of neurofilament light chain (NfL), inflammatory cytokines, AB40/42, phosphorylated tau, and GFAP in mouse CSF, plasma, and brain homogenates. We also have core strengths in preclinical imaging, including in vivo MRI, PET/CT, and SPECT/CT for structural, functional, metabolic, and molecular imaging biomarkers. These readouts enhance the translatability of study results to human trials.
-
Global Collaboration & Flexibility: We are a global preclinical neuroscience CRO serving biotech and pharmaceutical clients internationally. Our scientists collaborate closely with sponsors to tailor studies to specific therapeutic mechanisms or targets. We can accommodate custom endpoints or novel treatment paradigms. We also offer flexibility in study design to meet your program’s needs. Importantly, we prioritize scientific rigor, reproducibility, and open communication throughout the partnership.
By leveraging our core strengths, we are able to efficiently generate pharma-grade data from this model for small proof-of-concept projects as well as large, later-stage preclinical development studies.
Contact us to learn more about our characterization of this APP/PS1 model, our validated measures, and our Alzheimer Disease Models CRO services.
Discover more of our Alzheimer's Disease and Tauopathies Models
Related Content
Up-to-date information on Alzheimer's Disease and best practices related to the evaluation of therapeutic agents in AD animal models.
Amyloid-β & Inflammatory Microenvironment in Alzheimer's Mice
We have analyzed the complex spatial relationships between β-amyloid plaques, activated & resting microglia, and astrocytes in an APP/PS1 transgenic model.
5xFAD Mice & APP/PS1 Mice – Alzheimer Disease Mouse Models
A comparison of 5xFAD and APP/PS1 mouse models of Alzheimer’s disease, including amyloid-beta pathology, neuroinflammation, and cerebrovascular disease.
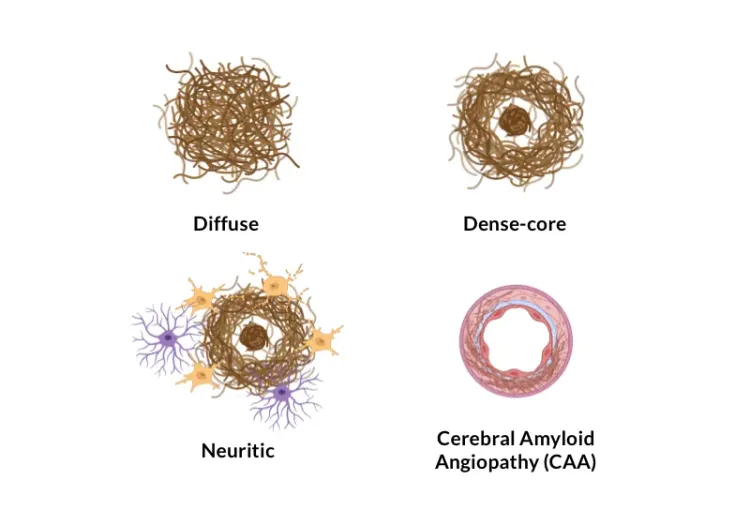
Amyloid-β Plaque Analysis in Alzheimer's Disease
Overview of methods to classify & quantify Aβ plaques in brain tissue sections from humans & Alzheimer’s disease animal models (transgenic mice & rats).
Astrocytes & Amyloid-β Mouse Models of Alzheimer's Disease
Analysis of astrocyte morphology in the amyloid-β plaque microenvironment provides a sensitive measure of disease progression in transgenic mice.
Microglia Morphology in ALS, Alzheimer's Disease & Parkinson's Disease
An overview of microglial morphological analysis and the applications to neurodegenerative disease research and drug discovery & development.
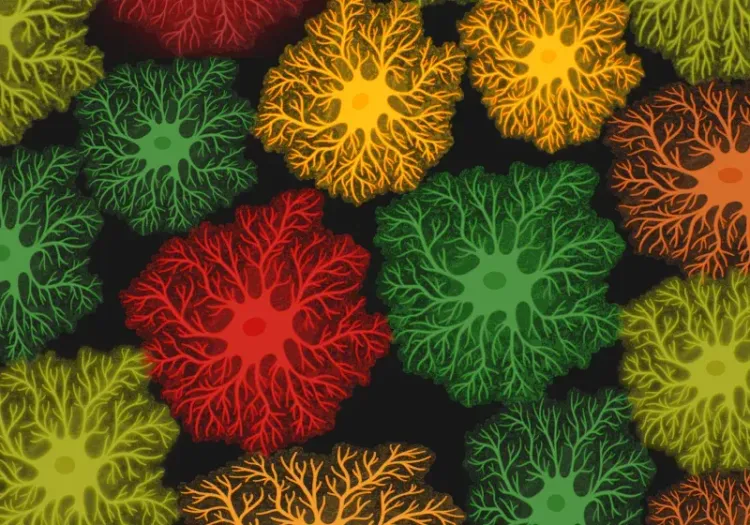
Astrocyte Morphology in Alzheimer's Disease
An overview of astrocyte morphological analysis and the applications to neurodegenerative disease research and drug discovery & development.
Autophagy and Transcription Factor EB (TFEB)
An overview of Transcription Factor EB (TFEB) and its role in autophagy and neurodegenerative diseases.
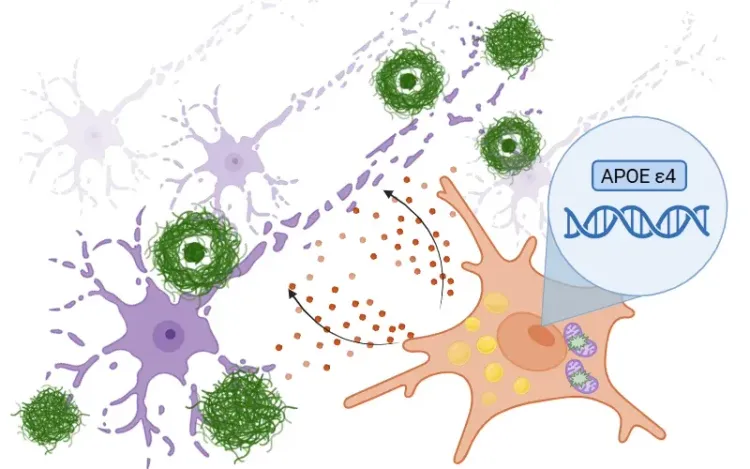
APOE4, Microglia & Alzheimer’s Disease
An overview of how ApoE4 influences microglial activity in Alzheimer's disease and the development of targeted therapeutics.
Inflammasome – A Therapeutic Target for Multiple Diseases
An overview of inflammasomes, including their mechanisms of action, roles in diseases, and targeting for drug development.
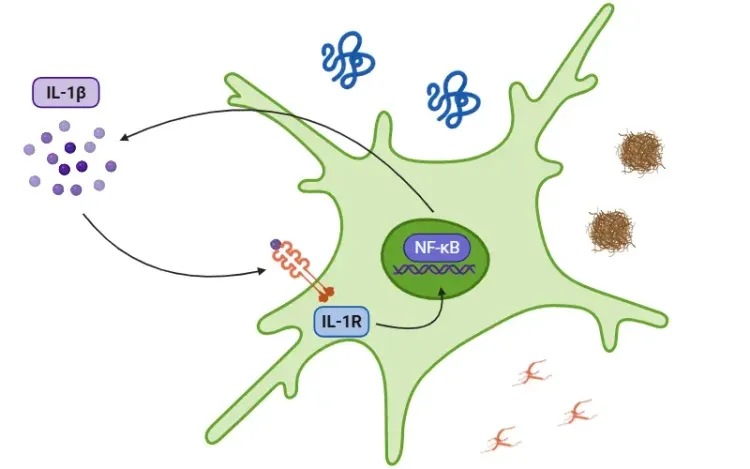
Interleukin-1 Beta (IL-1β) and Neurodegenerative Diseases
The role of IL-1beta in neurodegenerative diseases, including Alzheimer's disease (AD), Parkinson’s disease (PD), and amyotrophic lateral sclerosis (ALS).
Lysosome Dysfunction in Microglia & Astrocytes
An overview of lysosomal dysfunction in microglia & astrocytes, and its role in neurodegenerative diseases.
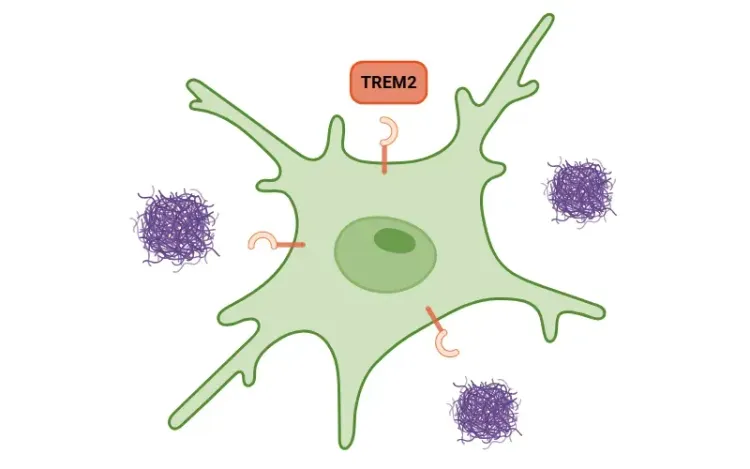
TREM2, Microglia and Neuroinflammation
An overview of TREM2, its role in microglia, links to neurodegenerative diseases, and potential treatment implications.
NLRP3 Inflammasome and Neurodegenerative Diseases
An overview of the NLRP3 inflammasome and its role in neurodegenerative diseases, including Alzheimer's disease, Parkinson’s disease, and ALS.
TNF-α & (TNF-alpha) Astrocytes in Neurodegenerative Diseases
An overview of TNF-α signaling in astrocytes, its role in neurodegeneration, and therapeutic strategies targeting this pathway..
Microglial Senescence and Neurodegenerative Diseases
An overview of microglial senescence and its role in neurodegenerative diseases, including Alzheimer’s disease (AD) and Parkinson’s disease (PD).
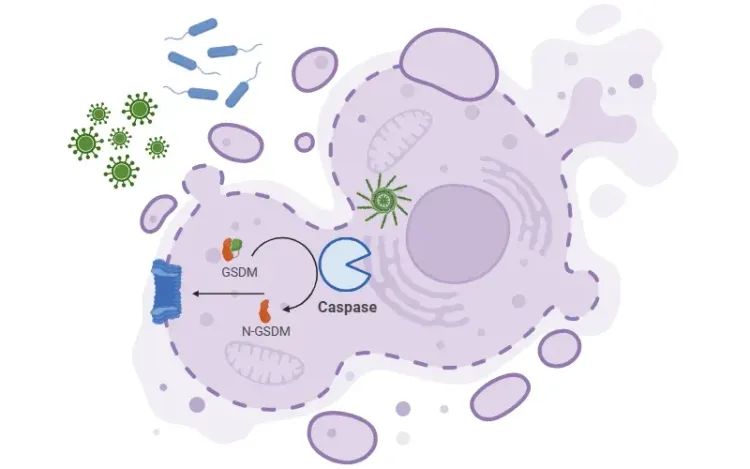
What is Pyroptosis? | A Drug Development Perspective
An overview of pyroptosis, its role in various diseases, and therapeutic strategies related to pyroptosis pathways.
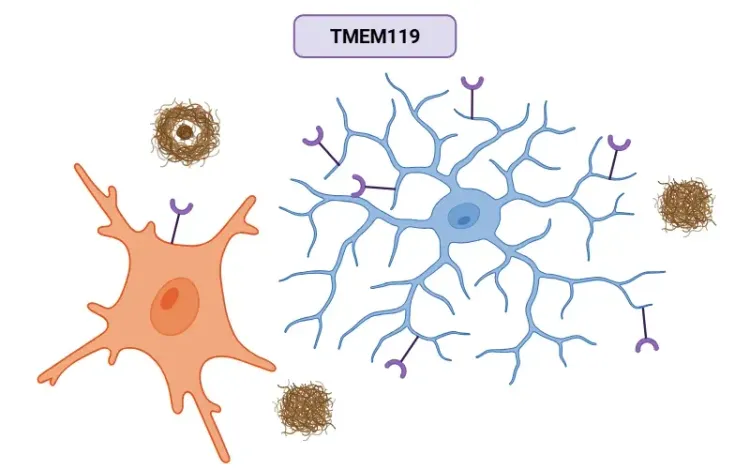
TMEM119 (transmembrane protein 119) and Microglia
An overview of the significance of TMEM119 in labeling microglia and its role in various diseases, including Alzheimer’s disease.
TNF-α (TNF-alpha) & Microglia in Neurodegenerative Diseases
An overview of the function of tumor necrosis factor-alpha (TNF-α) in microglia and its contribution to the progression of neurodegeneration.