Microglia Morphology in ALS, Alzheimer's Disease & Parkinson's Disease
An overview of microglial morphological analysis and the applications to neurodegenerative disease research and drug discovery & development.
Why quantify microglia morphology?
Microglia play a crucial role in many neurodegenerative diseases, including amyotrophic lateral sclerosis (ALS), Alzheimer's disease (AD), and Parkinson’s disease (PD) (Salter, 2017; Hickman, 2018). Many potential therapeutics for neurodegenerative diseases target microglia, for instance by modulating their phenotype or by promoting the clearance of Aβ plaques (Gao, 2023).
Microglia are highly dynamic cells, capable of assuming various phenotypes, as demonstrated by single cell ‘omics technologies. Recently, about one hundred scientists co-authored a publication (Paolicelli, 2022) aiming to clarify and build a consensus around the terminology of these phenotypes, using terms such as homeostatic signature, white matter-associated microglia, and disease-associated microglia (DAM).
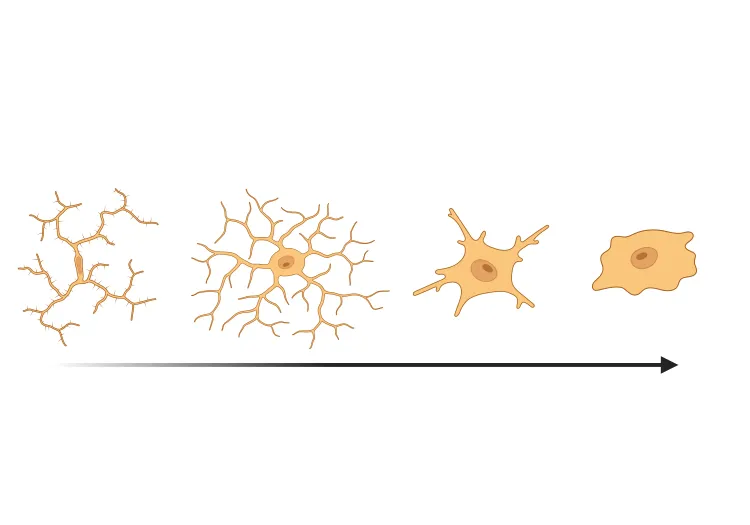
Microglia also show drastic morphological changes in reactive conditions. In this resource, we highlight commonly quantified morphological phenotypes (Savage, 2020):
- Ramified microglia, typically associated with homeostatic conditions, exhibit the ramified morphology characterized by long, thin, extended processes.
- Hypertrophic microglia, typically associated with reactive conditions, have enlarged soma with shorter, thicker, more ramified processes.
- Amoeboid microglia have enlarged soma and are almost devoid of processes, making them morphologically similar to macrophages.
- Dystrophic microglia feature beaded, spherical swellings of their processes, which can appear fragmented.
- Rod cells are highly elongated with a single orientation and minimal radial processes.
While functional phenotypes and distinct morphologies are two complementary characterizations of microglia, a mechanistic link between morphological changes (ramification) and function (cytokine release) has been identified (Madry, 2018). In addition, morphological metrics have been found to be correlated to functional markers in individual microglia (Kozlowski, 2012; Fernández-Arjona, 2019).
For more information on the role of pro-inflammatory cytokines in neurodegenerative diseases, see: Interleukin-1 Beta (IL-1β) and Neurodegenerative Diseases & TNF-α & Microglia in Neurodegenerative Diseases
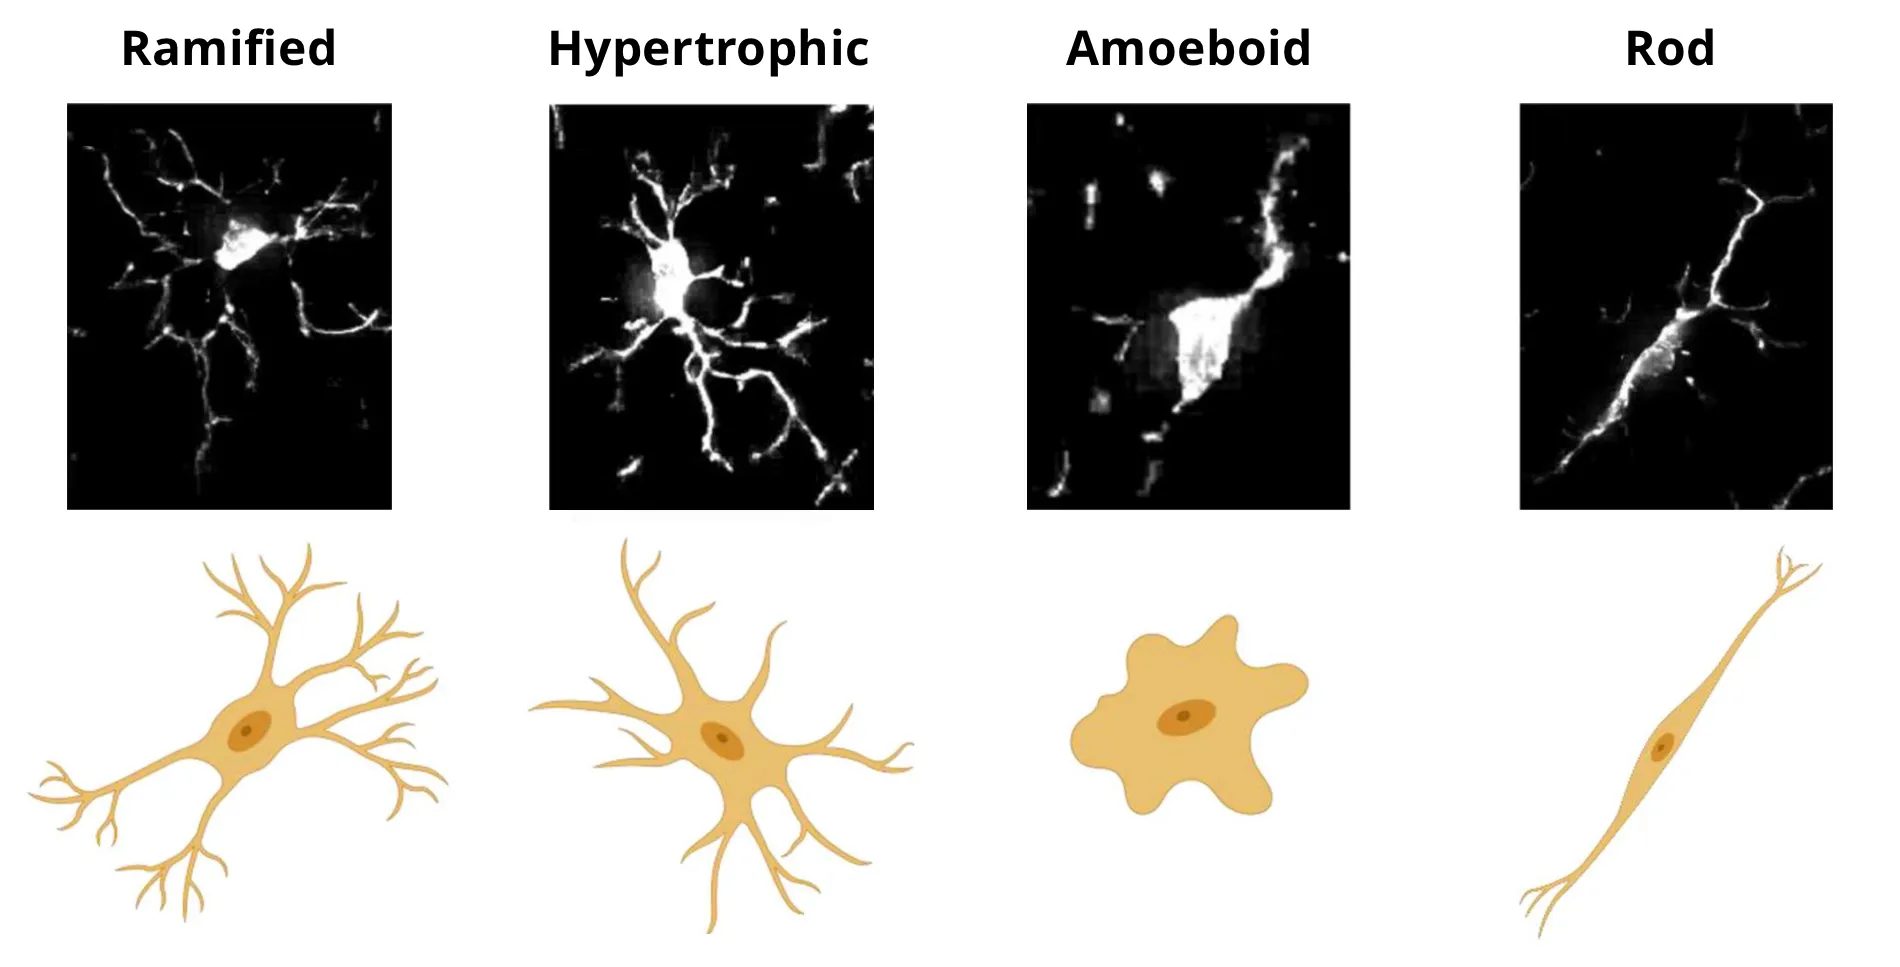
Microscopy images and schematic representations of microglial morphologies. Figure reproduced and adapted from (Reddaway, 2023), based on morphology definitions from (Savage, 2019), under the Creative Commons Attribution License.
At Biospective, we hypothesized that high-throughput quantification of microglial morphology could enhance the understanding of their state in preclinical studies. In mouse models of Alzheimer’s disease, Parkinson’s disease, and ALS, we found that analyzing microglial morphology provided a more sensitive metric of disease state than simply measuring the microgliosis by Iba-1 stain density.
How can we quantify microglia morphology in tissue sections?
Experimental Conditions: Staining, Section Thickness, and Microscopy
To quantify microglial morphology, microglia need to be labeled with a stain that is specific and sensitive to both their processes and soma, and is expressed in all phenotypes (typically Iba-1). Thick tissue sections up to 150 µm can be imaged as a z-stack using confocal microscopy for a full 3D characterization of microglia morphology. For high-throughput quantification in 2D, thinner sections (5-20 µm) can be imaged with a digital slice scanner (Franco-Bocanegra, 2021; Leyh, 2021). The trade-off between throughput and 3D imaging depends on the study’s objective. For example, high throughput 2D imaging is suitable for preclinical therapeutic efficacy studies and can scale to millions of cells. A simple metric, such as soma size, which consistently changes in reactive conditions (Kozlowski, 2012; Verdonk, 2016; Davis, 2017; Fletcher, 2020; Silburt, 2022), can be accurately quantified in 2D. For instance, one study focused solely on the soma morphology and found a shift from ramified to hypertrophic microglia in the retina of aged mice (Choi, 2022).
Steps for Morphological Quantification
The necessary steps for automated quantification common to most approaches are depicted in the figure below.
- Microglia are individually detected and separated - the object detection task in computer vision.
- The cell and soma of each cell are segmented from the background.
- The skeleton of the processes is algorithmically obtained.
- Morphological metrics (i.e. morphometrics), such as the cell area, perimeter, soma area, number of branches in the skeleton, etc. are measured in each cell.
Various approaches have been reviewed by Reddaway et al. (Reddaway, 2023).
Schematic representation of the process for the analysis of microglia morphology. Microglia are identified on an immunohistochemistry or immunofluorescence tissue section. For each identified cell, the soma and processes are segmented, and the skeleton of the processes is obtained. Morphological metrics, such as the cell and soma size, are obtained. The cell can be classified as a specific morphology using a machine learning model. In the example shown, the blue boxes represent ramified morphology, and the red boxes represent non-ramified morphology. Statistics can then be aggregated by region-of-interest (ROI), subject, and group. Morphology metric schematic reproduced and adapted from (Leyh, 2021) under the Creative Commons Attribution License.
Quantitative Analysis Between Groups
The cell morphometrics are aggregated by region-of-interest (ROI), by animal, and by group. To compare the groups, there are three main approaches:
1. Compare group morphometric distribution. The simplest approach is simply to compare the distribution of a particular metric, such as the soma size, across groups. Examples: (Kozlowski, 2012; Heindl, 2018).
2. Compare the distribution of cells across distinct clusters. Machine learning methods can identify clusters of cells with similar morphologies. The distribution of cell across these clusters can then be compared across groups. Examples: (Fernández-Arjona, 2017; Heindl, 2018; Salamanca, 2019).
3. Compare the distribution of cells across classified morphologies. Machine learning models can be trained to recognize user-specified morphologies (e.g. ramified, hypertrophic, amoeboid, etc.). The distribution and the number of cells with these morphologies can then be compared across groups. Examples: (Leyh, 2021; Choi, 2022).
What changes in microglia morphology have been observed in neurodegenerative diseases?
In this section, we highlight common findings in three neurodegenerative diseases, namely ALS, AD, and PD.
Amyotrophic Lateral Sclerosis (ALS)
Morphological changes in microglia have been observed in three different mouse model of ALS.
- SOD1-G93A model: a progressive shift to a morphology akin to hypertrophy (larger cell body, shorter processes) was observed during the disease progression (Ohgomori, 2016).
- Inducible hTDP43ΔNLS model: a similar shift was observed during the disease “recovery” after expression of pathological TDP-43 was stopped (Spiller, 2018).
- C9orf72 model (GA-repeats): an increase in the number of microglia was observed and a shift toward hypertrophy . This effect was largely eliminated when the mice were immunized to the GA-repeats (Zhou, 2020).
At Biospective, using the TDP-43 ΔNLS mouse model, we have found morphological changes in both “Off Dox” and “Low Dox” models. The density of non-ramified microglia was highly correlated with the clinical composite motor scores.
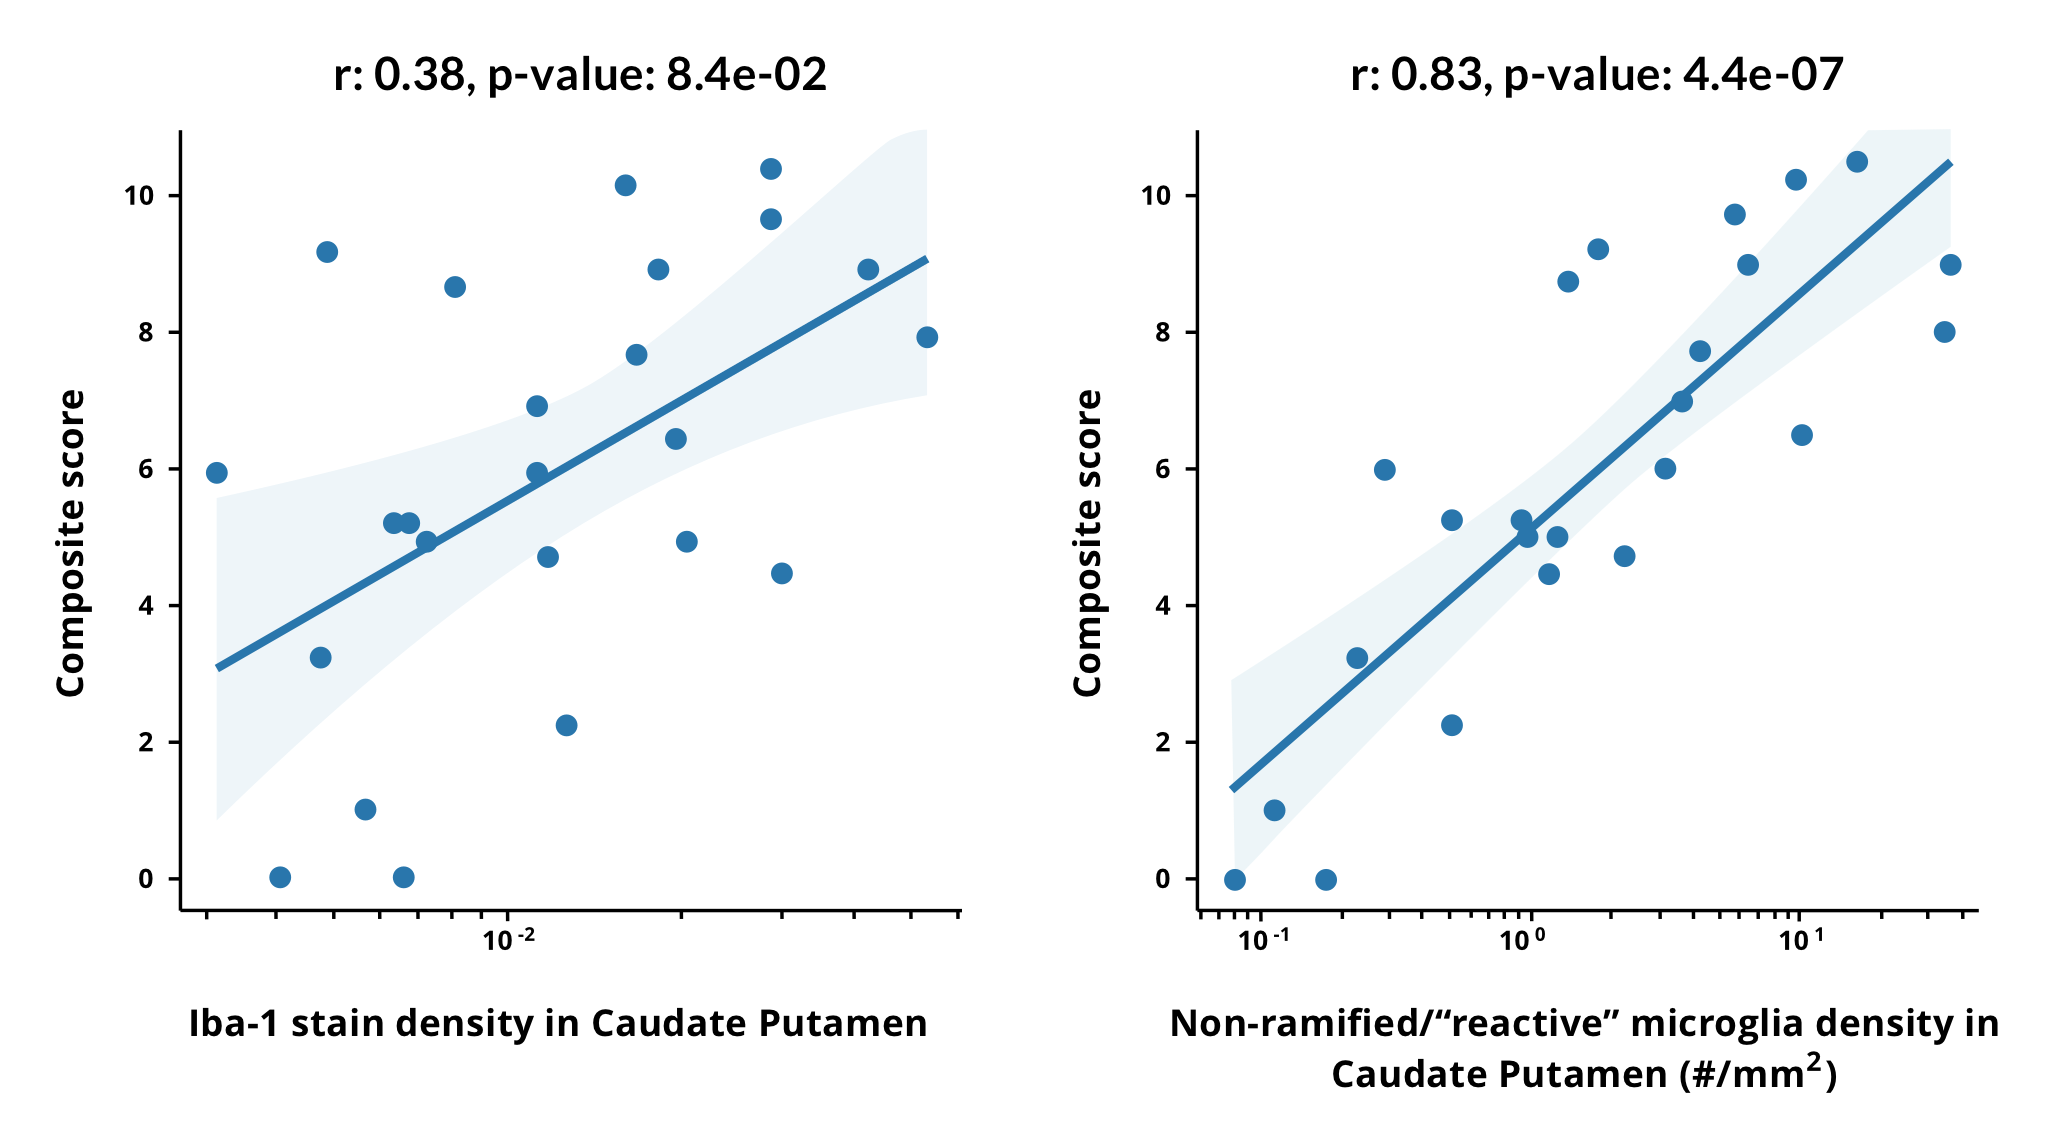
Microglia morphological changes are highly correlated with clinical motor score in a mouse TDP-43 ΔNLS model. The composite motor score is shown as a function of the Iba-1 stain density (fraction of segmented pixels, left) and the density of microglia with non-ramified (“reactive”) morphology (right) in the caudate putamen (CP) across groups with different levels of disease severity. A linear fit to the log of the x-axis is shown, and the Pearson correlation coefficient increases from 0.38 with the Iba-1 stain density to 0.83 for the density of non-ramified microglia. Different disease severity groups are shown in the linear fit, such as “On Dox (control)", “4 weeks Low Dox”, “6 weeks Low Dox”, and “3 weeks Off Dox”. A linear fit combining the log-density of non-ramified microglia in four ROIs (caudate putamen, motor cortex, non-motor cortex, and corticospinal tract) results in a correlation coefficient of 0.93 +/- 0.06 (range obtained from standard deviation of a 5-fold cross-validation).
Alzheimer’s Disease
Studies in human tissue have generally shown no significant changes in the total number of microglia in AD versus aged-matched control (Davies, 2017; Heindl, 2018; Paasila, 2019; Martini, 2020; Franco-Bocanegra, 2021). However, a shift away from the homeostatic ramified morphology has been observed. An increase in the number of microglia with dystrophic morphology has been reported (Bachstetter, 2015; Davies, 2017; Martini, 2020). Multiple morphological metrics, such as the total process length, have been found to be correlated to the Aβ and/or tau pathological load (Heindl, 2018; Paasila, 2019; Franco-Bocanegra, 2021). Interestingly, Franco-Bocanegra et al. (Franco-Bocanegra, 2021) observed a treatment effect - patients immunized against Aβ42 had increased fraction of microglia with ramified morphology as compared to non-treated AD patients and healthy controls.
Our studies in an APP/PS1 mouse model of AD have found morphological changes in microglia that were highly localized in proximity to the Aβ plaques, and were more sensitive than the Iba-1 stain density at assessing disease progression.
Parkinson’s Disease & Synucleinopathies
In rat and marmoset models of PD, a shift from the ramified morphology to hypertrophic and amoeboid form has been observed (Sanchez-Guajardo, 2010; Barkholt, 2012). Similarly, in a mouse model of multiple system atrophy (MSA; PLP-alpha-synuclein), a shift from the ramified morphology to the hypertrophic morphology was observed without an increase in overall microglia number (Refolo, 2018). A treatment effect was observed in a rat model of PD - changes typical of a transition to the hypertrophic morphology (increase in soma size, density, etc.) were observed in the striatum of levodopa-treated rats, but not in the saline-treated rats (Fletcher, 2020).
Using Biospective’s mouse model of PD (injection of human preformed fibrils into the anterior olfactory nucleus of hemizygous M83 mice), we found an increase in total microglia and a shift towards hypertrophic morphology, correlating with disease progression. The density of non-ramified microglia was a more sensitive metric of the disease state than the Iba-1 stain density.
Our team would be happy to answer any questions about Microglia Morphology in ALS, Alzheimer's Disease, and Parkinson's Disease or provide specific information about the models that we use for therapeutic efficacy studies.
Discover more about our Neurodegenerative Diseases Models
Related Content
Up-to-date information on neurodegenerative diseases and best practices related to the evaluation of therapeutic agents in neurodegenerative disease models.
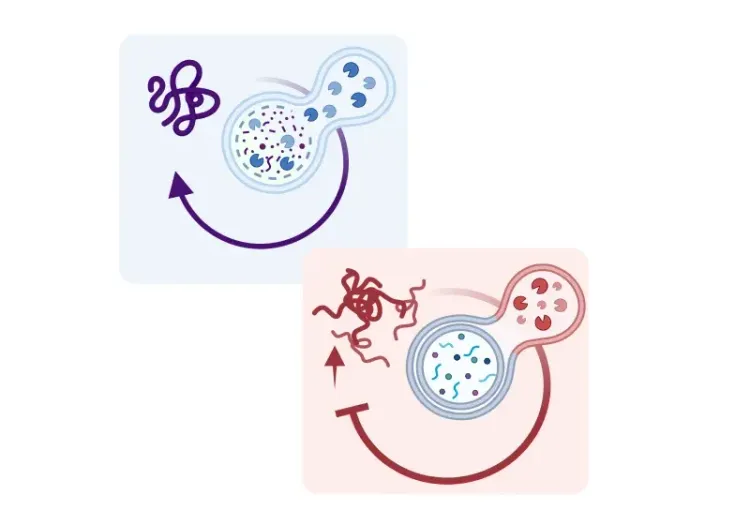
Microglia-Neuron Interactions & Neurodegenerative Diseases
A concise review of the direct interactions between microglia & neurons, and how these cell-to-cell interactions may be affected in neurodegenerative diseases.
TNF-α (TNF-alpha) & Microglia in Neurodegenerative Diseases
An overview of the function of tumor necrosis factor-alpha (TNF-α) in microglia and its contribution to the progression of neurodegeneration.
Microglial Senescence and Neurodegenerative Diseases
An overview of microglial senescence and its role in neurodegenerative diseases, including Alzheimer’s disease (AD) and Parkinson’s disease (PD).
Autophagy, Parkinson's Disease, and Dopaminergic Neurons
An overview of how impaired autophagy can lead to pathologic changes and neurodegeneration in dopaminergic neurons in Parkinson’s disease.
Autophagy & Neurodegenerative Diseases
An overview of how cellular autophagy plays a role in brain health and neurodegeneration.
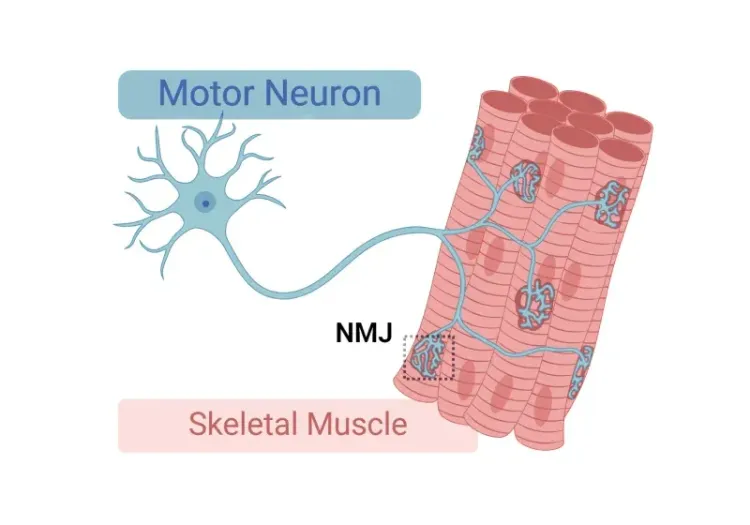
Neuromuscular Junction (NMJ) Morphology & ALS Models
Insights into neuromuscular junction (NMJ), its role in amyotrophic lateral sclerosis (ALS), and tools & methods used to study morphological changes in NMJs.
Astrocyte Morphology in Alzheimer's Disease
An overview of astrocyte morphological analysis and the applications to neurodegenerative disease research and drug discovery & development.
ALS Mouse Models & Spinal Motor Neurons
An overview of the involvement of spinal motor neurons in disease progression in mouse models of Amyotrophic Lateral Sclerosis (ALS).
Amyloid-β Plaque Analysis in Alzheimer's Disease
Overview of methods to classify & quantify Aβ plaques in brain tissue sections from humans & Alzheimer’s disease animal models (transgenic mice & rats).
Microglial Activation in an α-Synuclein PFF Mouse Model
We have quantified microglial activation, based on morphology, in an α-synuclein preformed fibril (PFF) seeding & spreading mouse model of Parkinson’s disease.
Amyloid-β & Inflammatory Microenvironment in Alzheimer's Mice
We have analyzed the complex spatial relationships between β-amyloid plaques, activated & resting microglia, and astrocytes in an APP/PS1 transgenic model.
TDP-43 ΔNLS (rNLS8) Mice for ALS Drug Development
This resource provides information about the use of the ΔNLS (deltaNLS, hTDP-43ΔNLS, hTDP-43DeltaNLS, dNLS, TDP43 NLS, rNLS8) TDP-43 transgenic mouse model of ALS for preclinical therapeutic studies.