Why quantify astrocyte morphology?
Astrocytes are glial cells that represent about 20-40% of the cells in the brain and play important roles in many processes, including synapse regulation, lipid and ion homeostasis, and neurotransmitter clearance (Baldwin, 2024). The main branches of their processes create a star-like morphology which is the basis for their name. These main branches divide further into smaller branchlets and then into leaflets that contact synapses. The territories covered by astrocytes completely tesselate the central nervous system with almost no overlap between adjacent cells.
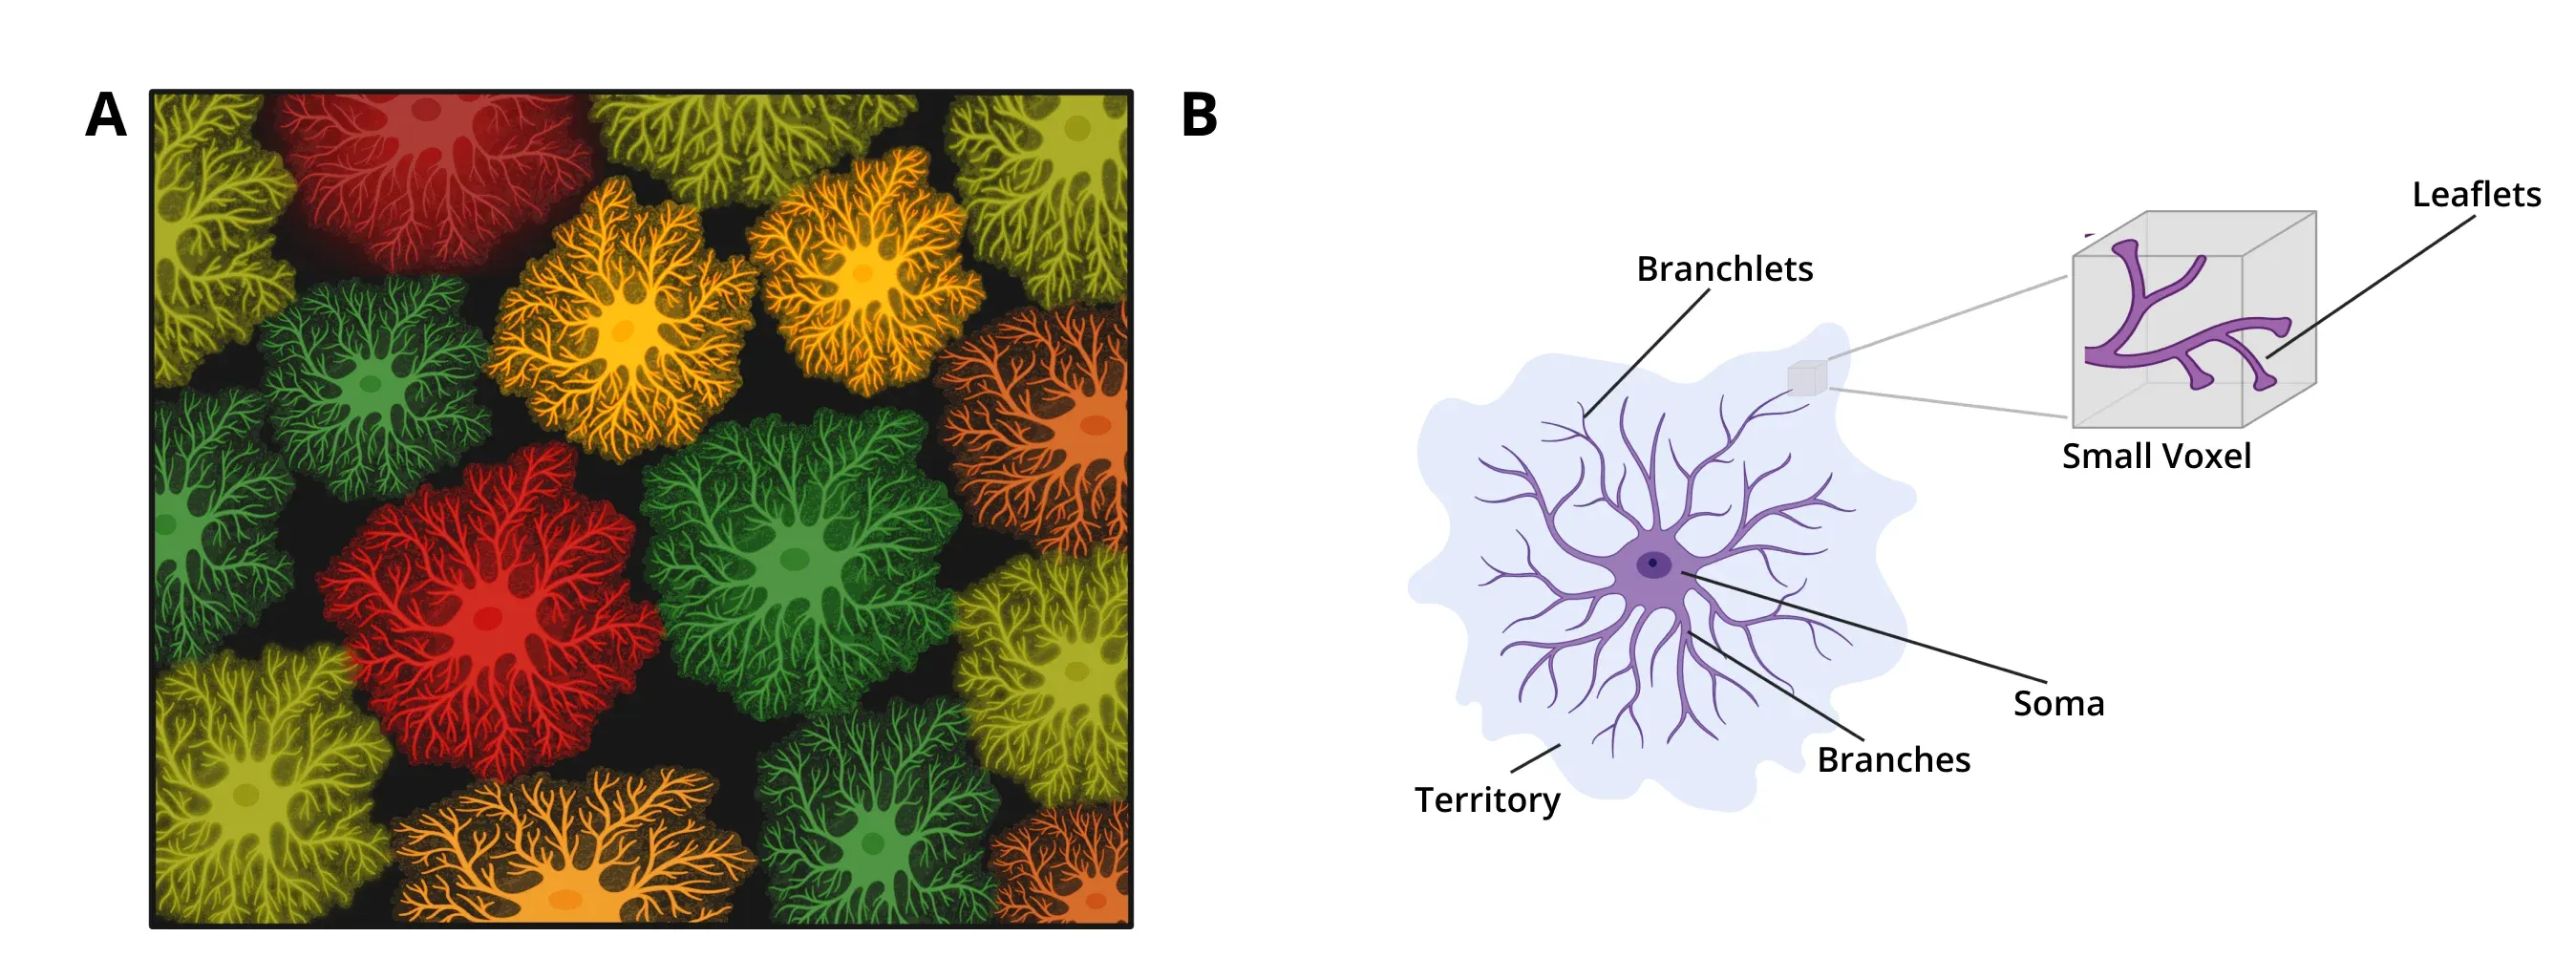
Morphology of astrocytes. (A) Astrocytes entirely tile the CNS, separating into distinct three-dimensional territories with almost no overlap. (B) Schematic representing the morphology of an astrocyte. The processes emanate from the soma in main branches, which get further divided into branchlets and then into leaflets. The complete 3D extent of the astrocytic processes is referred to as the territory.
Astrocytes are thought to play important roles in many neurological disorders, including Alzheimer's disease (AD), amyotrophic lateral sclerosis (ALS), Huntington’s disease (HD), and Parkinson’s disease (PD) (Pekny, 2016; Booth, 2017; Yun, 2018; Lee, 2022; Lawrence, 2023). Under many stress conditions, astrocytes can become ‘reactive’ (Pekny, 2014; Escartin, 2021; Patani, 2023) with different gene expression profiles and drastic morphological changes that were observed early by neuroanatomists (Andriezen, 1893). ‘Hypertrophy’ of the morphology in this context is often observed, with the main branches and branchlets becoming thicker, shorter, and more branched.
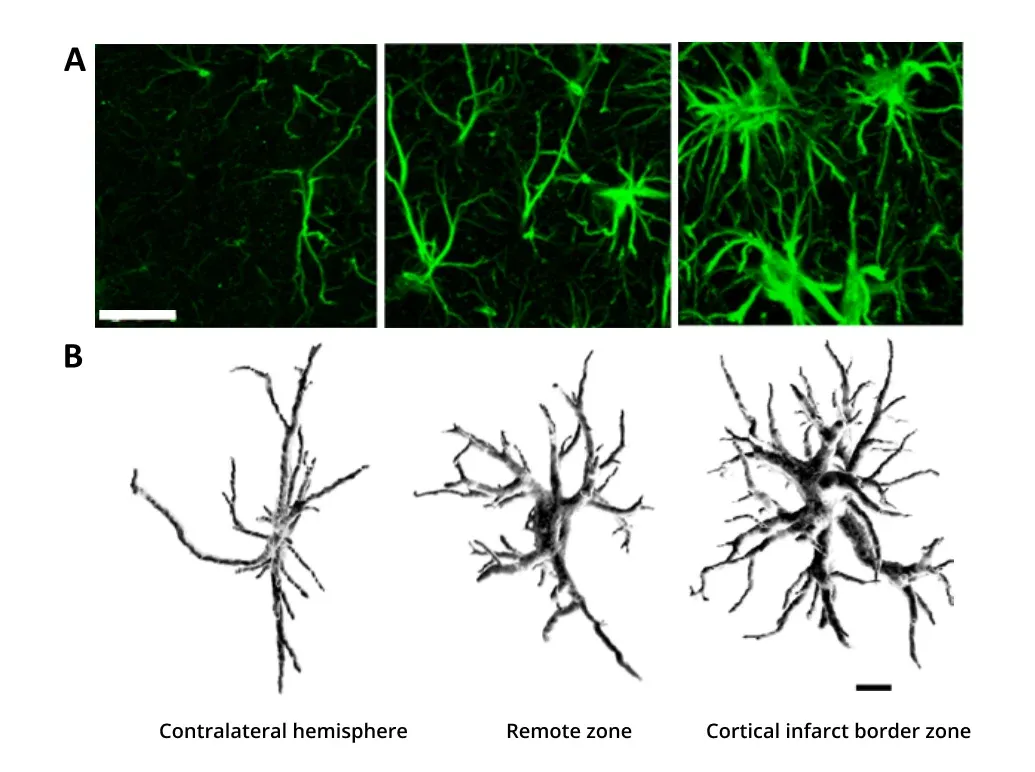
Hypertrophy of astrocytes due to brain ischemia. Astrocytes are shown in 3 regions: in the contralateral hemisphere unaffected by the stroke, in the affected hemisphere but remote to the injury, and in the cortical infarct border zone. (A) Reactive astrogliosis is observed using GFAP immunostaining, with higher stain density and intensity closer to the injury. Scale bar = 20 μm. (B) 3D reconstruction of GFAP-labeled astrocytes imaged using confocal microscopy showing the increase in branching points, the thickening of the processes, and the increase in volume. Scale bar = 10 μm. Figures reproduced from Wagner et al. (Wagner, 2013) under the Creative Commons Attribution License.
Astrocyte morphology-related genes were found to be enriched in many neurological diseases, including AD, ALS, and multiple sclerosis (MS) (Endo, 2022). In AD mouse models, morphological changes have been detected before significant amyloid-beta plaque deposition (Yeh, 2011; Beauquis, 2013). At Biospective, we have hypothesized that quantifying the morphology of astrocytes in preclinical studies could serve as an early and sensitive indicator of disease progression. Our studies using an APP/PS1 transgenic mouse model have shown that quantifying astrocyte morphology was more sensitive than the GFAP stain density in measuring disease states.
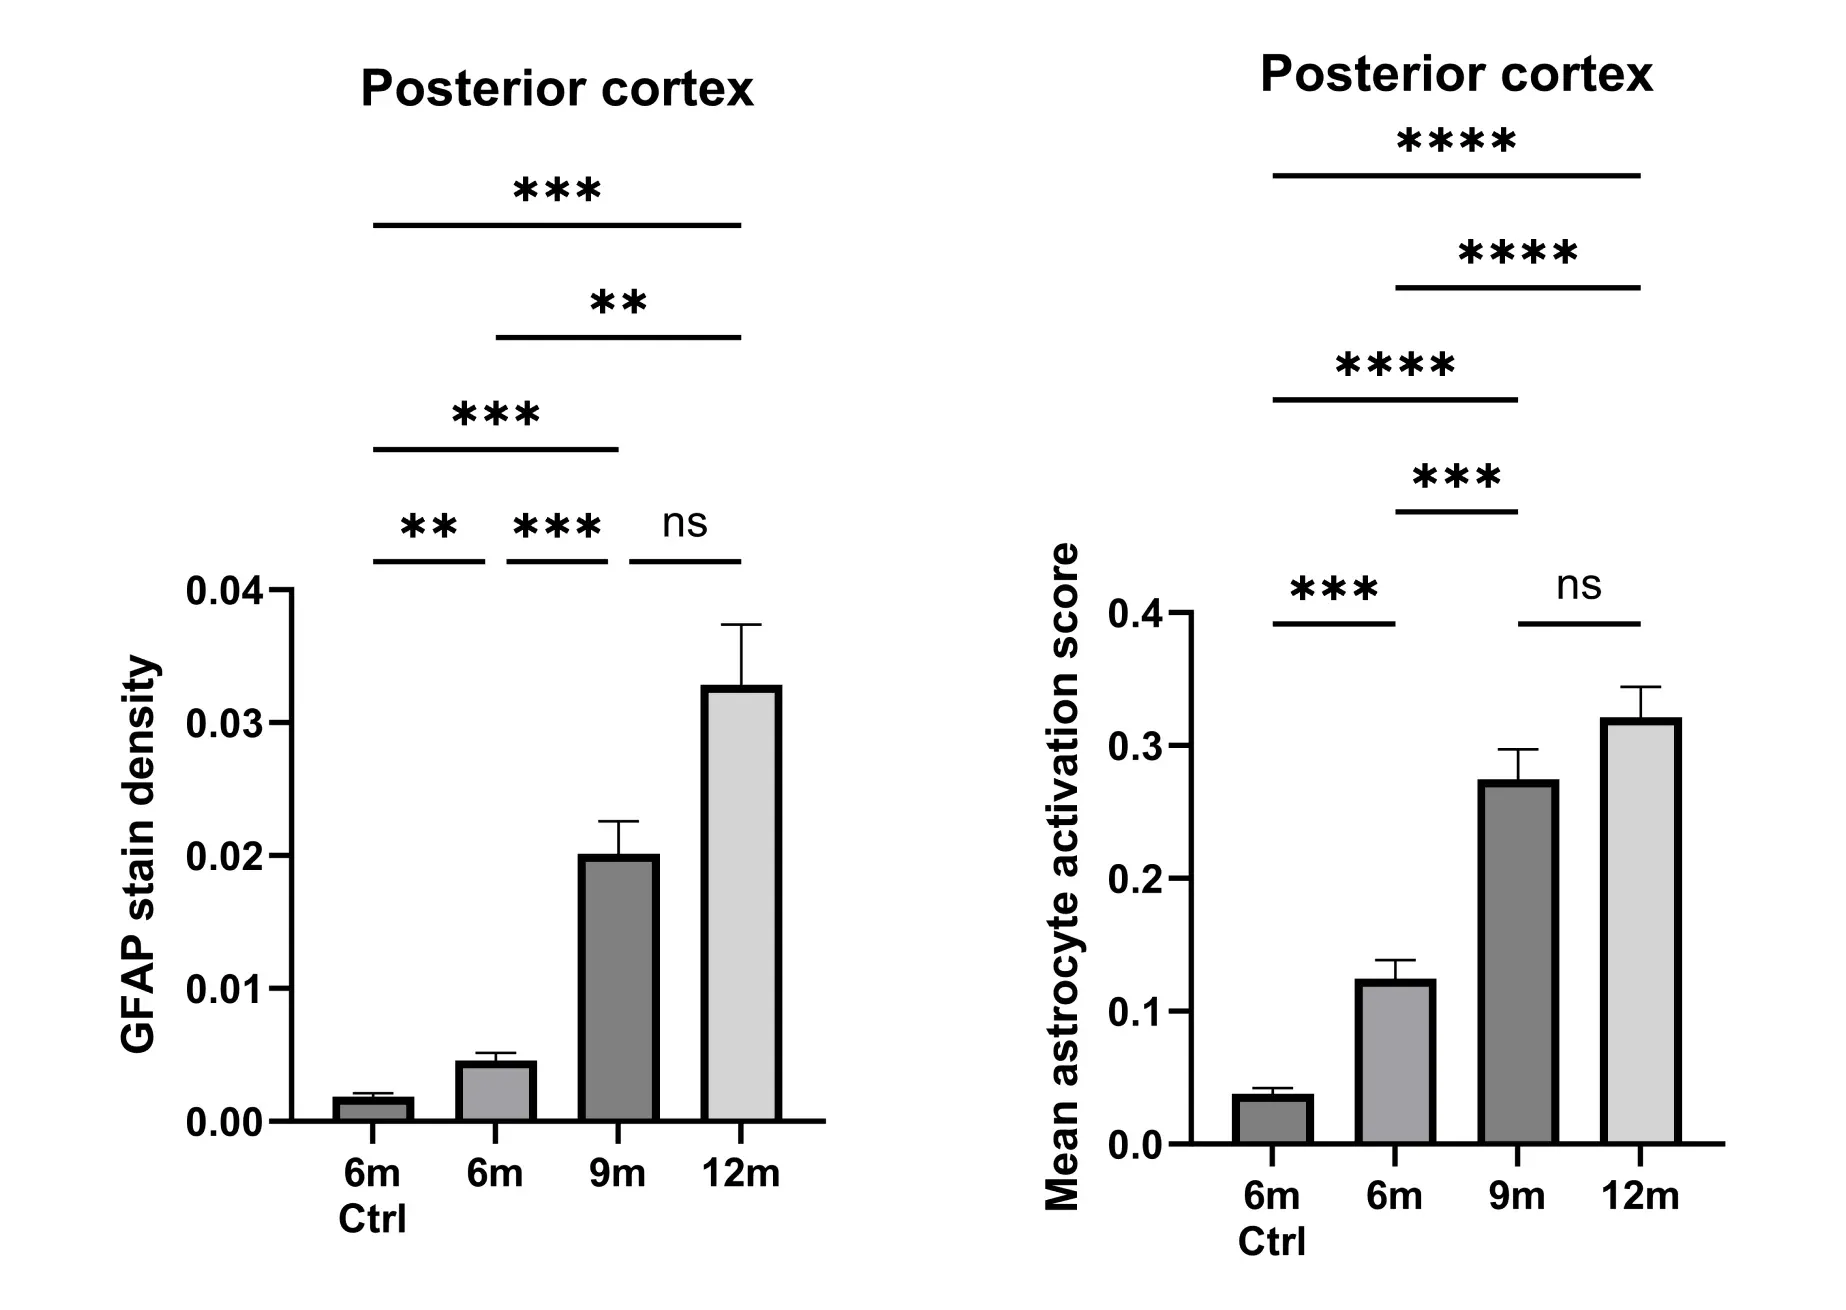
Quantifying the morphology of astrocytes can provide a sensitive metric of the disease state. The astrogliosis is quantified in the posterior cortex of APP/PS1 mice at 6, 9, and 12 months-of-age and compared to control (wild-type) mice at 6 months-of-age. The GFAP stain density (i.e. the fraction of GFAP-positive pixels) progressively increases during the disease progression (left). The mean astrocyte activation score per ROI per mice – obtained from a morphology analysis – also increases during the course of the disease, but the changes have higher statistical significance (right). Error bars represent Standard Error on the Mean (SEM). P-values were obtained using Dunnett’s T3 multiple comparisons test, with ** p<0.01, *** p<0.001, **** p<0.0001.
How can we quantify astrocyte morphology in tissue sections?
Experimental Conditions
Quantifying astrocyte morphology requires specific labeling. The classical method is to perform immunostaining for glial fibrillary acidic protein (GFAP), which marks the astrocyte’s intermediate filaments and enables imaging of the primary processes. However, GFAP expression varies greatly across brain regions (Endo, 2022) and does not fully capture the astrocyte morphology (Baldwin, 2024). To visualize finer structures like branchlets, leaflets, and the cell territory, fluorescent protein (FP) expression or dye injection techniques are required (Bushong, 2002; Reeves, 2011). On the other hand, these methods require either sparse labeling or the use of multiple fluorophores to separate neighboring cells. It remains to be determined in which context high-throughput quantification of the broad astrocyte morphology or detailed characterization of sparsely labeled cells offers greater sensitivity.
Astrocytes can then be imaged in 2D with high throughput in thin slices using a slide scanner, or in 3D using confocal microscopy on thicker sections (40-100 μm). It is important to note that even with confocal microscopy, the axial resolution is much lower than the lateral resolution, and care must be taken while interpreting the 3D reconstruction (Baldwin, 2024). A similar trade-off between throughput and detailed 3D morphological assessment must be considered in the context of the objectives of the study. For example, automated quantification of astrocytes morphology imaged using a slide scanner can be used in preclinical studies of putative therapeutics, scaling to millions of cells and providing a sensitive metric of the disease state.
General Steps for Morphological Characterization
The computational pipeline for astrocyte morphology analysis parallels that of microglia, although the few tools published so far have not generally performed all these steps (Labate, 2023). Key steps include identifying and separating cells (object detection), segmenting astrocytes, and skeletonizing processes for branching analysis. Multiple morphological metrics (morphometrics) can then be obtained for each cell, such as cell area, soma area, number of branching points in skeleton, etc. If the astrocytes were labeled with a FP, additional metrics can be calculated, such as the territory size and overlap (if using multiple markers). The astrocytes could then be classified into specific morphotypes based on their morphometrics, although, in contrast with the microglia morphology analysis, this step has not been generally performed.
Quantitative Analysis between Groups
Morphometrics can be aggregated by regions-of-interest (ROIs), animal, and groups to detect changes in the morphology of astrocytes across groups. However, intra-group variability should be carefully accounted for when using this approach, as multiple cells from the same animal do not represent independent samples. Techniques such as bootstrapping can be used to estimate this intragroup variability while comparing distribution of morphometrics. In contrast, quantifying the density of cells belonging to specific morphology clusters or morphotypes, as done in the microglia analysis, avoids this challenge.
How can the astrocyte morphology quantification be used in drug development for Alzheimer’s disease?
Morphological Changes in AD Mouse Models
Changes in the astrocytic morphology have been observed in multiple mouse models of AD. For example, in a cerebral amyloid angiopathy (CAA) mouse model (Tg-FDD, familial Danish Dementia), increased branching, as well as increased expression of a reactivity marker (C3), was observed in GFAP-stained astrocytes (Taylor, 2020). In this model, significant astrogliosis was observed without microgliosis.
Endo et al. (Endo, 2022) observed morphological changes in cortical astrocytes using the APP/PS1 mouse model of AD. In this study, astrocytes were labeled using FP to quantify their territory size in addition to other morphometrics. In the healthy brain, the authors correlated the variation in gene expression across regions – obtained by bulk and single-cell transcriptomics – and the changes in morphometrics to identify putative morphology gene modules. Two genes from these modules, Ezrin and Fermt2, were validated by gene knockout, which resulted in smaller territory size for the astrocytes and changes in a cognitive task for the affected mice. In both their mice model and in human AD tissues, genes that were found to be significantly downregulated were positively correlated with territory size. Smaller territory size of cortical astrocytes was observed by microscopy in their mouse model. Finally, the astrocyte territory-size related genes that were identified were found to be enriched in multiple neurological disorders, including AD, MS, and ALS.
Yeh et al. (Yeh, 2011) quantified the morphology of astrocytes in a slow-progressing mouse model of AD (3xTg-AD). Significant atrophy of the surface and volume was observed in astrocytes immunostained for GFAP as early as one month-of-age in the entorhinal cortex, well before the detection of plaques and extracellular aggregates (12 months).
Treatments Affect Astrocyte Morphology
In another mouse model of AD (PDAPP-J20 transgenic mice), Beauquis et al. (Beauquis, 2013) studied the treatment effects of environmental enrichment (EE) on amyloid-β load and astrocyte morphology in the hippocampus. Mice with EE had significantly lower amyloid plaque load as compared to untreated transgenic mice. The authors separately analyzed the morphology of plaque-associated astrocytes (PAA, defined as < 50 μm of plaque in that study) and non-plaque-associated astrocytes. They found that, in untreated transgenic mice, astrocytes far from plaques had significant atrophy, while PAA had increased volumes. EE reduced the morphological changes for both PAA and astrocytes distant from plaques. Increasing branching of the astrocytes was also observed before significant plaque accumulation.
Using the APP/PS1 mouse model of AD, Chandra et al. (Chandra, 2023) studied the effects of gut microbiome alterations due to antibiotic treatment in male mice. They found that the treatment reduced the number of astrocytes and PAA as compared to untreated animals. The morphology of GFAP-stained PAA was also affected by the treatment, with a decrease in the fraction of the area in the soma and an increase in mean process length (i.e. suggesting decreased hypertrophy). Functional markers were also altered, with the treatment reducing C3 and increasing Ezrin as compared to vehicle. Ezrin expression correlated well with multiple morphometrics. Reintroducing the microbiome using fecal matter transplant nulled these effects, while germ-free mice showed similar changes as antibiotic-treated mice. By depleting microglia using CSF1R inhibitors, the authors showed that effects of antibiotic treatment on PAA morphology were dependent on the presence of microglia, but that the decrease in the numbers of astrocytes occurred independently.
Canepa et al. (Canepa, 2023) tested two carbonic anhydrase inhibitors, methazolamide and acetazolamide, as putative therapeutics in the TgSwDI mouse model of AD. They found that the treatment reduced the amyloid plaque load and reduced the hypertrophy of astrocytes. Microglia morphology was also less affected in the treatment groups compared to vehicle.
Novel Morphology of Astrocytes
Sokolova et al. (Sokolova, 2024) identified a new type of astrocyte morphology in mouse models of AD and in human AD tissue. Using FP expression to visualize the astrocyte morphology, they identify astrocytes with “bulbous” processes and high levels of p62 expression present before robust plaque accumulation. This morphology, located predominantly in the hippocampus, could not be visualized with GFAP staining, but was also observed using S100β. These astrocytes also had smaller territory size compared to neighboring astrocytes and were not spatially correlated with amyloid plaques. The authors found that these “bulbous” astrocytes promoted microglial synapse engulfment via secretion of MFG-E8 (glycoprotein milk fat globule-EGF factor 8) during the early stages of amyloidosis, a novel finding that opens potential avenues for therapeutic intervention.
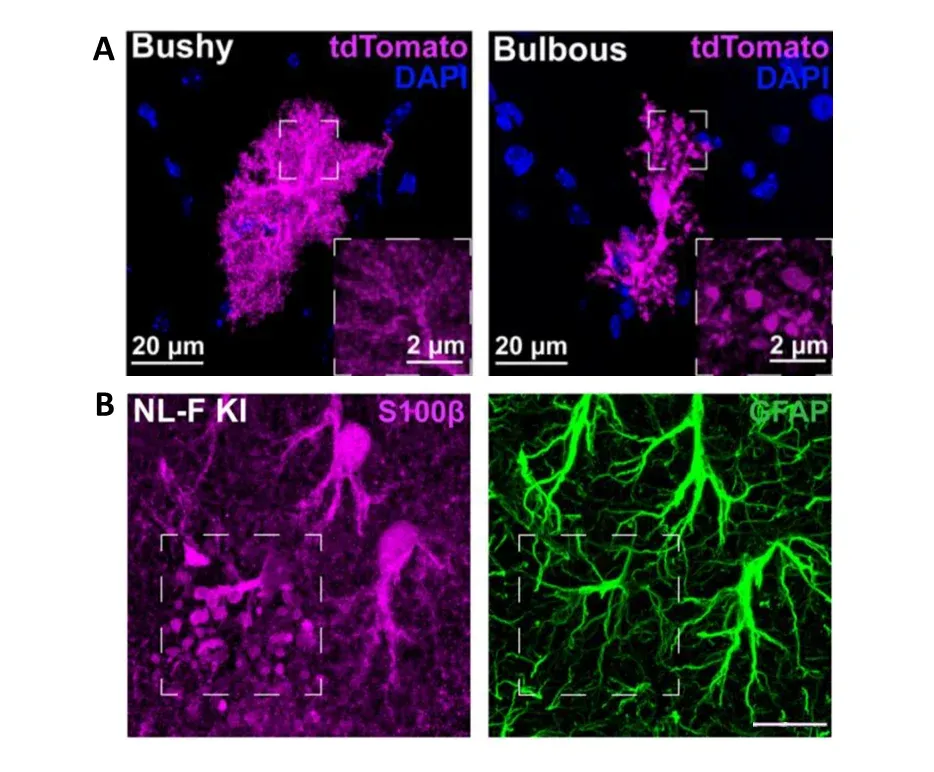
Identification of a new astrocyte morphology, named “bulbous”. (A) Microscopy image comparing the morphology of typical, bushy, astrocyte morphology to the “bulbous” morphology in the NL-F knock-in mouse model of AD. The astrocytes are labeled using a FP (tdTomato), showing their complete morphology. Spherical protrusions can be observed in the processes of “bulbous” astrocytes. (B) These protrusions cannot be observed using GFAP immunostaining, but can be observed using S100β. Scale bar = 15 μm. Figures reproduced from Sokolova et al. (Sokolova, 2024) under the Creative Commons Attribution License.
Our team would be happy to answer any questions about Astrocyte Morphology or provide specific information about the AD models that we use for therapeutic efficacy studies.
Discover more about our AD Models
Related Content
Up-to-date information on Neuroinflammation and best practices related to the evaluation of therapeutic agents in animal models of neurodegenerative diseases.
Astrocytes & Amyloid-β Mouse Models of Alzheimer's Disease
Analysis of astrocyte morphology in the amyloid-β plaque microenvironment provides a sensitive measure of disease progression in transgenic mice.
Amyloid-β & Inflammatory Microenvironment in Alzheimer's Mice
We have analyzed the complex spatial relationships between β-amyloid plaques, activated & resting microglia, and astrocytes in an APP/PS1 transgenic model.
Microglia Morphology in ALS, Alzheimer's Disease & Parkinson's Disease
An overview of microglial morphological analysis and the applications to neurodegenerative disease research and drug discovery & development.
Microglial Activation in an α-Synuclein PFF Mouse Model
We have quantified microglial activation, based on morphology, in an α-synuclein preformed fibril (PFF) seeding & spreading mouse model of Parkinson’s disease.
Amyloid-β Plaque Analysis in Alzheimer's Disease
Overview of methods to classify & quantify Aβ plaques in brain tissue sections from humans & Alzheimer’s disease animal models (transgenic mice & rats).
