


Tg2576 Mice vs. APP/PS1 (ARTE10) Mice – Choosing an Amyloid-β Model for Alzheimer's Drug Development
This Resource compares the Tg2576 and APP/PS1 (ARTE10) mouse models of Alzheimer's disease across amyloid onset, phenotype penetrance, neuroinflammation, cerebrovascular pathology, and study design.
Table of Contents
- What are the Tg2576 and APP/PS1 (ARTE10) mouse models?
- How do amyloid onset and plaque morphology differ between the two models?
- How reproducible is the pathology?
- How do neuroinflammation and the plaque microenvironment compare?
- Which model is better suited to cerebrovascular amyloid and ARIA studies?
- How does model choice change study timeline and size?
- What can Biospective measure in APP/PS1 (ARTE10) mice?
- When is Tg2576 still the right choice?
- Which amyloid model should you choose for your therapeutic program?
Summary
First plaques
3 months APP/PS1 (ARTE10) | ~9 months Tg2576 |
Moderate plaque burden
6 months APP/PS1 (ARTE10) | 11-13 months Tg2576 |
Extensive Plaque Load
9 months APP/PS1 (ARTE10) | 15 months Tg2576 |
First plaques
3 months APP/PS1 (ARTE10) | ~9 months Tg2576 |
Moderate plaque burden
6 months APP/PS1 (ARTE10) | 11-13 months Tg2576 |
Extensive Plaque Load
9 months APP/PS1 (ARTE10) | 15 months Tg2576 |
In brief: for an amyloid-related therapeutic development program that needs a go/no-go decision within a year or less, the APP/PS1 (ARTE10) line is the better default and Tg2576 is best reserved for replicating legacy datasets. Homozygous ARTE10 mice show their first plaque deposits at ~3 months of age and reach 100% penetrance of the plaque phenotype by 5 months, whereas Tg2576 plaques appear at around 9 months and penetrance is complete only at 11 to 13 months (Willuweit, 2009). That gap represents roughly six months of additional animal husbandry per study arm, before accounting for any difference in cohort size. ARTE10 mice also breed as a homozygous line, show minimal sex differences in amyloid-β burden, and show diffuse and dense-core Thioflavin-positive plaques from the earliest deposits, making the model tractable for amyloid PET imaging and for evaluating plaque-targeting and other AD-targeted therapeutics (Willuweit, 2021).
AVAILABLE AT BIOSPECTIVE
APP/PS1 (ARTE10) Amyloid-β Transgenic Mouse Model
Homozygous line on a C57BL/6NTac background
Fully penetrant plaque phenotype by 5 months-of-age
Validated for:
MRI atrophy
Quantitative multiplex immunofluorescence
Fluid biomarkers
AVAILABLE AT BIOSPECTIVE
APP/PS1 (ARTE10) Amyloid-β Transgenic Mouse Model
Homozygous line on a C57BL/6NTac background
Fully penetrant plaque phenotype by 5 months-of-age
Validated for:
MRI atrophy
Quantitative multiplex immunofluorescence
Fluid biomarkers
What are the Tg2576 and APP/PS1 (ARTE10) mouse models?
Both are transgenic mouse models of amyloid-β (Aβ) deposition, but they differ in how many familial Alzheimer's disease mutations they carry and in how they are bred. Tg2576 carries a single transgene and develops amyloid pathology with age; APP/PS1 (ARTE10) carries two co-integrated transgenes and is maintained homozygous, providing greater amyloidogenic pressure from the outset.
Tg2576. Tg2576 mice overexpress the 695-amino-acid isoform of human APP carrying the Swedish double mutation (K670N/M671L) under a hamster prion protein promoter. The founding characterization reported normal learning and memory at 3 months, impairment by 9 to 10 months, and Congo red-positive plaques in cortical and limbic structures in animals with elevated Aβ (Hsiao, 1996). The line is conventionally maintained on a mixed C57BL/6 × SJL background (Rustay, 2010).
APP/PS1 (ARTE10). ARTE10 mice carry human APP with the same Swedish mutation together with human presenilin-1 bearing the M146V mutation, both driven by the neuron-specific Thy-1 promoter and co-integrated so that the two transgenes are inherited together. The line is viable and fertile when maintained homozygous for both transgenes, with breeding performance comparable to wild-type C57BL/6 mice. Mutant presenilin-1 shifts γ-secretase cleavage toward Aβ42, the predominant insoluble species in these animals, contributing to their early, robust deposition (Willuweit, 2009). Biospective's studies utilize the homozygous line on a C57BL/6NTac background.
Both lines belong to the first generation of APP overexpression models, and reviews of the field caution that overexpression itself can generate phenotypes unrelated to Alzheimer's disease and that models should be matched to the specific experimental question rather than selected by convention (Sasaguri, 2017; Jankowsky & Zheng, 2017). The comparison below is framed around that choice. For the equivalent comparison with a more aggressive line, see our Resource on 5xFAD versus APP/PS1 mice.
Head-to-head comparison of the Tg2576 and APP/PS1 (ARTE10) mouse models of amyloid-β pathology. Row labels are identical for both models, and entries without published values are marked as not assessed rather than omitted. Unless separately cited, values for onset, penetrance, zygosity, promoter, variability, and mortality are taken from the characterization of the ARTE10 line and its published comparison with other transgenic amyloid models (Willuweit, 2009).
How do amyloid onset and plaque morphology differ between the two models?
ARTE10 mice deposit amyloid roughly six months earlier than Tg2576 mice, and they deposit it as mature, dense-core plaques rather than as diffuse material that later compacts. In homozygous ARTE10 animals the first plaques appear in the anterior neocortex and subiculum at 3 months of age, spreading to the hippocampus, amygdala, and thalamus with age, while the cerebellum remains spared as it does in human Alzheimer's disease (Willuweit, 2009). Tg2576, by contrast, was originally characterized as a model in which memory impairment and Congo red-positive plaques emerge together between 9 and 10 months of age (Hsiao, 1996).
In Tg2576 mice the biochemical and histological timelines separate. Insoluble Aβ40 and Aβ42 become detectable at 6 to 7 months and rise exponentially to 10 months, yet histopathology over that period is limited to isolated cores; diffuse plaques are evident by 12 months, and neuritic plaques with amyloid cores accumulate from 12 to 23 months (Kawarabayashi, 2001). Animals examined at 16 months show amyloid deposits with prominent gliosis and neuritic dystrophy (Irizarry, 1997). A program that reads out plaque burden histologically therefore cannot treat the 6-month biochemical signal as a study start.
The morphology difference matters for anything that binds fibrillar amyloid. In ARTE10 brain, even the earliest and smallest detectable deposits are already congophilic, and diffuse deposits appear only as satellites once plaque load is high (Willuweit, 2009). Cryogenic electron microscopy of ex vivo fibrils from six mouse models found that ARTE10 fibrils include the human type II filament fold seen in patient brain, a property the authors link directly to selecting models for plaque-targeting therapeutics and PET tracer development (Zielinski, 2023).
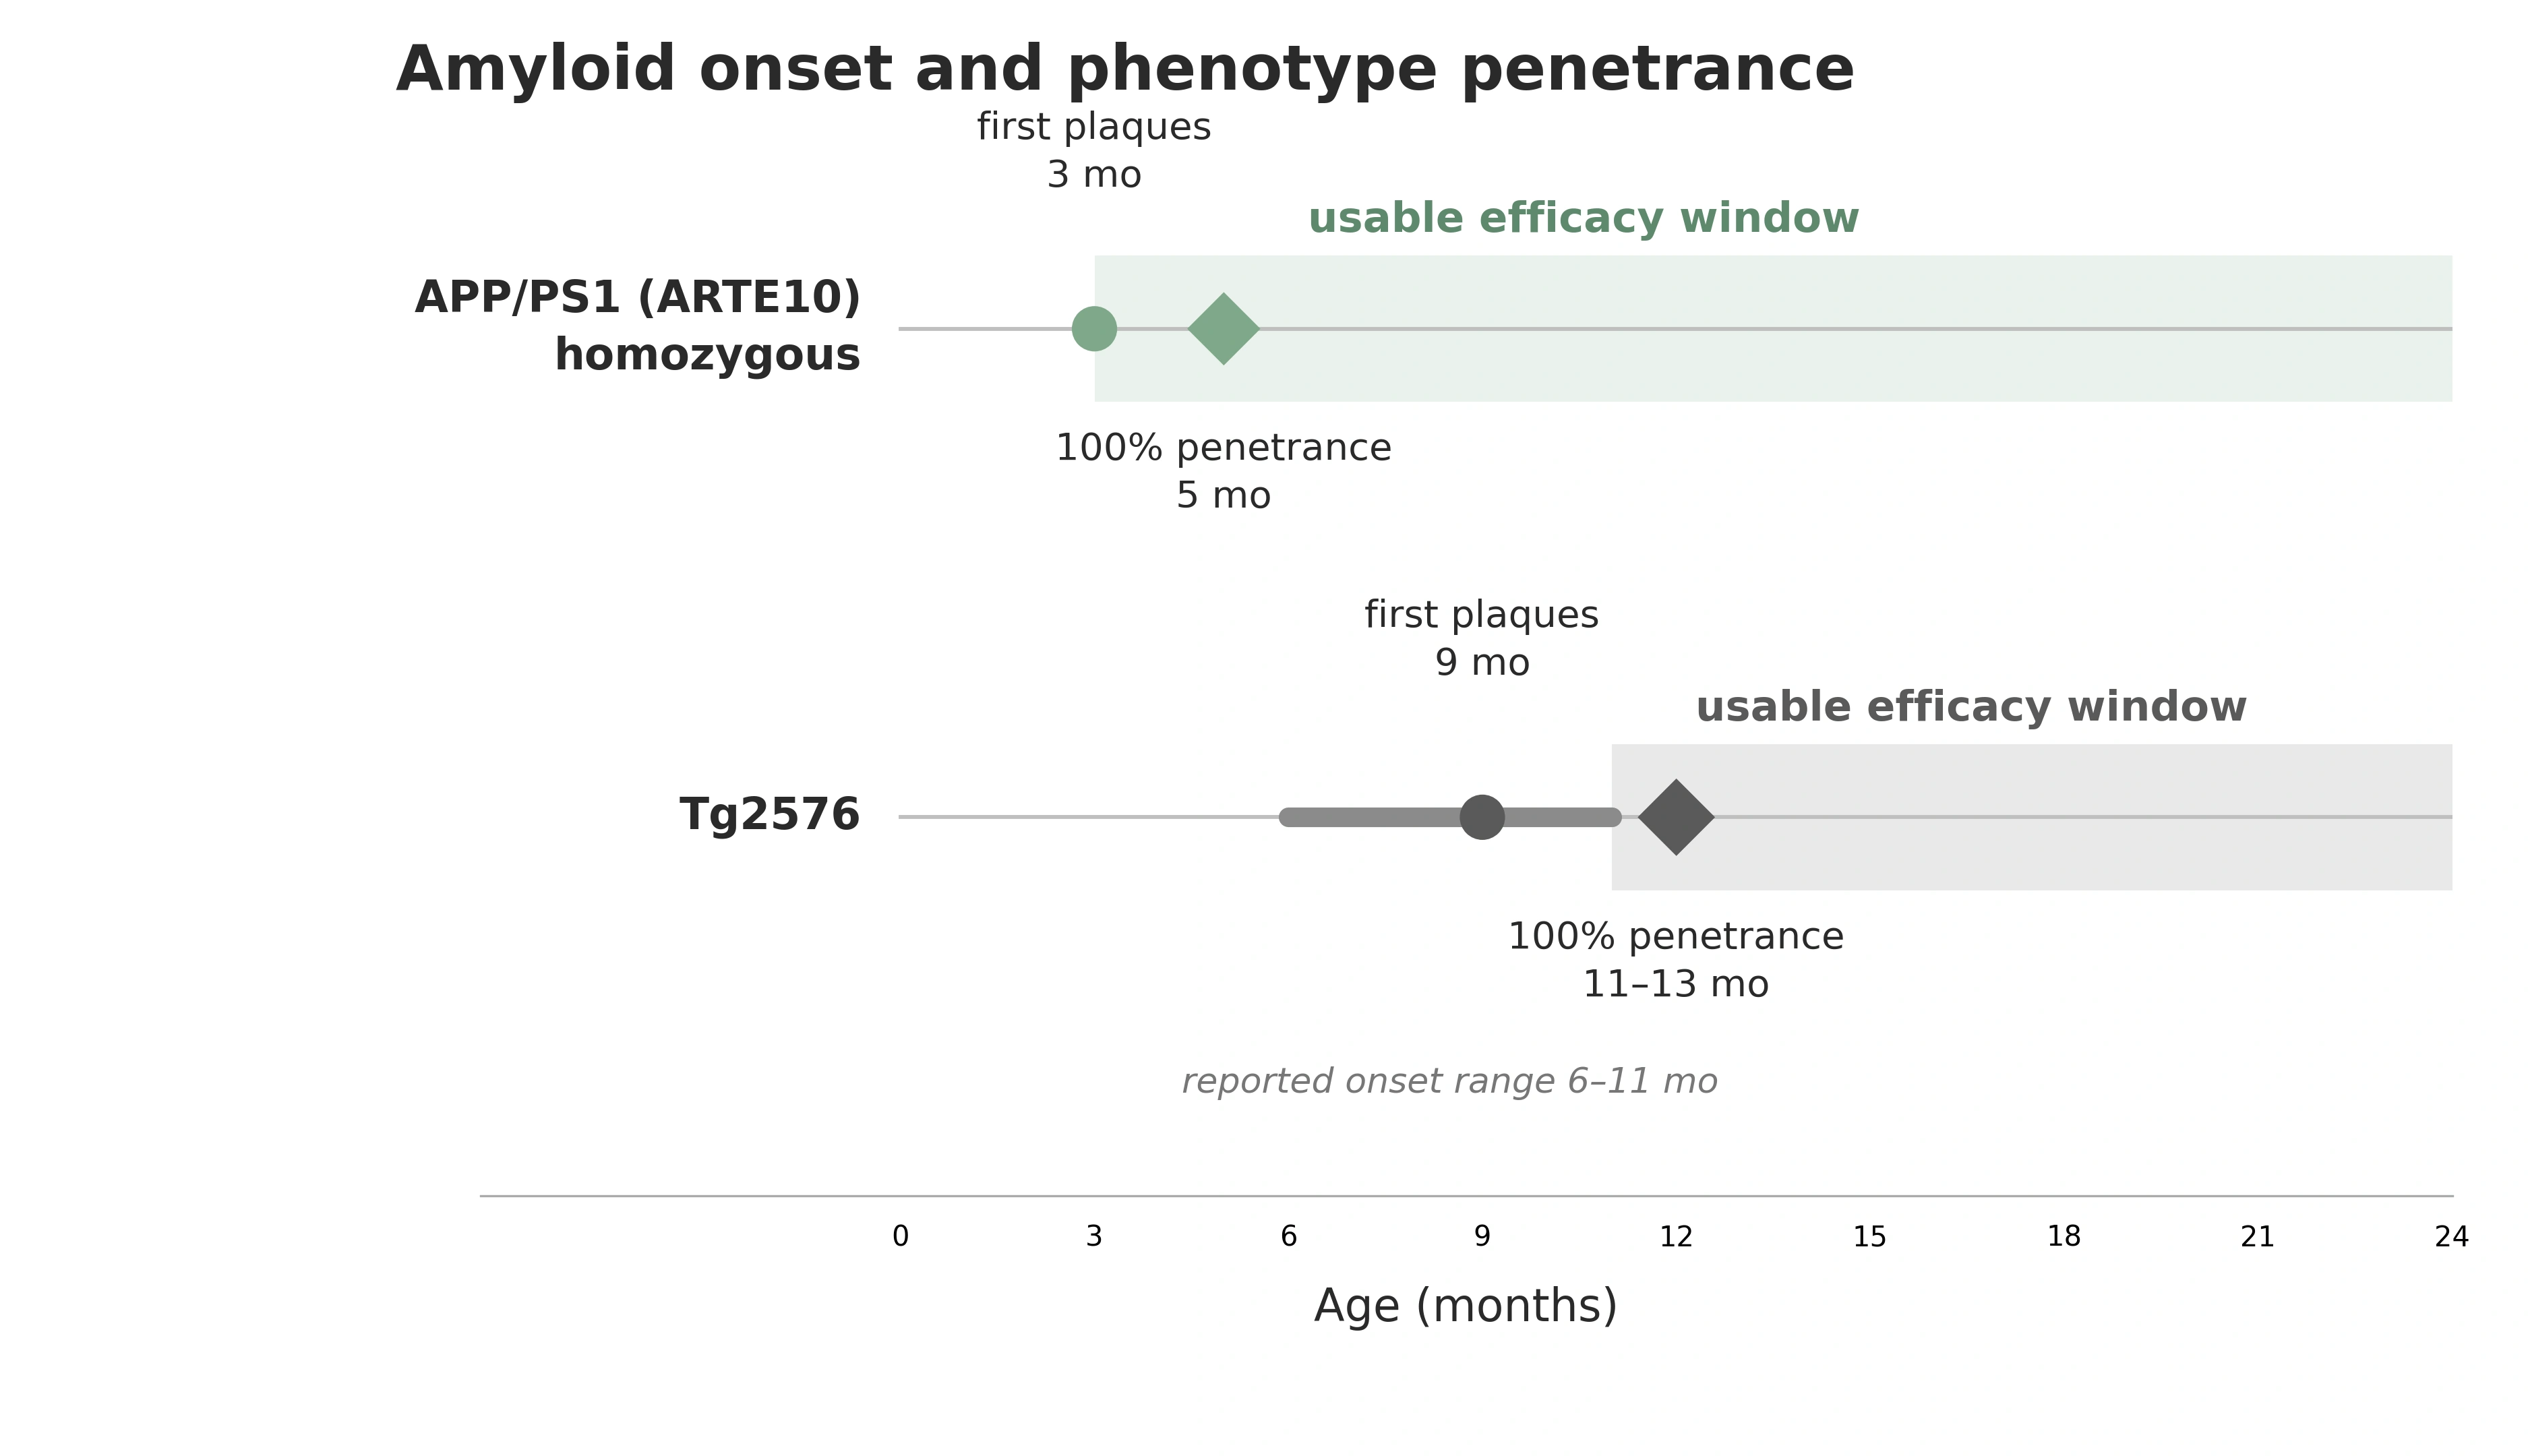
Amyloid onset and phenotype penetrance in Tg2576 and homozygous APP/PS1 (ARTE10) mice. Circles mark first detectable plaque deposition, diamonds mark the age at which the plaque phenotype is 100% penetrant, and the shaded bars mark the period during which a fully penetrant cohort is available for an efficacy study.
How reproducible is the pathology?
The homozygous ARTE10 line is the more reproducible of the two mouse models on every measure that feeds into a power calculation: penetrance, inter-animal spread, sex effects, and attrition. Every homozygous ARTE10 mouse examined carried plaques by 5 months of age, two months after onset, and variability in plaque load between same-aged animals is low (Willuweit, 2009).
Sex effects. Sex is a design constraint in Tg2576 and not in ARTE10. In a cohort of 91 Tg2576 mice examined at 15 months, the brain area occupied by plaques in females was close to three times that in males, with a smaller but concordant difference in Aβ40 and Aβ42 by ELISA (Callahan, 2001). A study in that model, therefore, either runs single-sex, which weakens translation, or stratifies and pays for the extra animals. No sex differences have been reported in either hemizygous or homozygous ARTE10 mice (Willuweit, 2009).
Background strain. The mixed C57BL/6 × SJL background used for Tg2576 carries the recessive Pde6b rd1 retinal degeneration allele, and that background shows high variability across behavioral assays; the same APP transgene on a congenic 129 background produced more consistent deficits with comparable Aβ pathology (Rustay, 2010). The practical effect is measurable: water maze acquisition was not achievable in rd homozygotes at 8 or 16 months, whereas Y-maze alternation, object recognition and the Barnes maze remained informative (Yassine, 2013). Any cognitive endpoint in Tg2576 has to be selected around the animals' vision.
How do neuroinflammation and the plaque microenvironment compare?
Both models produce robust plaque-associated glial activation, but ARTE10 produces it earlier and in a spatial arrangement that supports “microenvironment analysis”. Every amyloid plaque in ARTE10 brain is surrounded by a corona of ubiquitin-positive dystrophic neurites and accompanied at its periphery by Iba-1-positive activated microglia and GFAP-positive reactive astrocytes, a tripartite structure that mirrors the classical morphology of human senile plaques (Willuweit, 2009). In Tg2576 mice the equivalent gliosis and neuritic dystrophy are present, but occur alongside amyloid that is not itself fully deposited until much later (Irizarry, 1997; Kawarabayashi, 2001).
Because the glial response is organized around individual plaques, the informative readout is spatial rather than global. Biospective quantifies the inflammatory microenvironment of individual plaques in ARTE10 mice, including astrocyte morphology in the plaque neighborhood and activated versus non-activated microglial populations, using whole-slide multiplex immunofluorescence and automated segmentation. In-house characterization of this model shows an age-dependent rise in both plaque density and Iba-1 and GFAP stain density in the cerebral cortex across serially-aged cohorts. Further background on plaque classification is in our resource on amyloid-β plaque analysis.
Amyloid-β & the inflammatory microenvironment
See how we map microglia and astrocytes around individual plaques in APP/PS1 mice.
Astrocyte morphology in amyloid models
Plaque-neighborhood astrocyte measures as a sensitive marker of disease progression.
Microglia histology & analysis
Quantification and morphology classification of microglial populations.
Which model is better suited to cerebrovascular amyloid and ARIA studies?
ARTE10 is the more efficient platform for cerebrovascular amyloid work, although Tg2576 has the longer published track record in antibody-induced microhemorrhage. Amyloid-related imaging abnormalities are the main dose-limiting toxicity of anti-amyloid antibodies, comprising oedema or effusion (ARIA-E) and hemosiderosis or microhemorrhage (ARIA-H), and they share clinical and pathophysiological features with cerebral amyloid angiopathy (CAA), with apolipoprotein E haplotype and antibody dose as the principal risk factors (Hampel, 2023). Any preclinical ARIA model, therefore, must develop genuine vascular amyloid, not only parenchymal plaques.
ARTE10 mice develop amyloid angiopathy of intracortical, leptomeningeal, and choroidal vessels as parenchymal amyloidosis advances (Willuweit, 2009). A multimodal MRI study of 10-month-old ARTE10 mice with both cerebral and vascular amyloid reported regional increases in apparent transverse relaxation rate and magnetic susceptibility in the hippocampus with large effect sizes, alongside elevated hippocampal iron load on immunohistochemistry (Shahid, 2026). Susceptibility-weighted imaging (SWI) readouts of this kind rely on the same underlying physics used to detect ARIA-H in patients, where the presence of microhemorrhages at baseline raises the risk of subsequent ARIA (Hampel, 2023).
In Tg2576, prolonged systemic delivery of anti-Aβ antibodies aggravated vascular pathology in aged animals, while intracerebroventricular delivery of the same antibody reduced cerebral amyloid angiopathy and associated microhemorrhages (Thakker, 2009), providing a genuinely informative ARIA-like experiment, but one conducted in aged mice. The trade-off is therefore primarily one of timeline rather than biology: ARTE10 studies can be read out at 10 months, while Tg2576 experiments require substantially older animals.
Programs that also require APOE4-dependent risk modelling can use a cross with either model. Both approaches require in vivo MRI with sequences sensitive to hemosiderin. An ARTE10xAPOE4 cross model has recently been developed, and ARIA-relevant changes in this model are currently being evaluated by Biospective’s research scientists.
Fluid biomarkers
Aβ40/42, tau, cytokines in brain homogenates, CSF, and plasma/serum.
In vivo MRI
Anatomical and susceptibility-weighted imaging for vascular and ARIA-relevant readouts.
Design a longitudinal imaging study
Tell us your endpoint and we'll propose a study schedule.
Fluid biomarkers
Aβ40/42, tau, cytokines in brain homogenates, CSF, and plasma/serum.
In vivo MRI
Anatomical and susceptibility-weighted imaging for vascular and ARIA-relevant readouts.
Design a longitudinal imaging study
Tell us your endpoint and we'll propose a study schedule.
How does model choice change study timeline and size?
Model choice determines both when a study can begin and the cohort size required, and these two effects compound. A fully penetrant ARTE10 cohort can be studied from 5 months of age, whereas Tg2576 does not reach full penetrance until 11 to 13 months (Willuweit, 2009). For a treatment arm dosed over a 3-month window, that is the difference between an in-life phase ending before the cohort’s first birthday and one extending well into its second year, with the corresponding husbandry, attrition, and holding costs.
Cohort size is driven by endpoint variability rather than model name, which is why penetrance and inter-animal spread matter more than absolute plaque burden. Three properties of the homozygous ARTE10 line favor smaller, more efficient cohorts: complete penetrance, minimizing animals without established pathology; absence of a reported sex effect, allowing both sexes to be pooled; and low inter-animal variability at a given age (Callahan, 2001).
What can Biospective measure in APP/PS1 (ARTE10) mice?
Biospective runs the homozygous APP/PS1 (ARTE10) model as an end-to-end CRO service, from dosing through in-life imaging to quantitative neuropathology and immunoassays. The endpoints most often used in Alzheimer’s disease drug development programs are below:
Where a program needs tau pathology and frank neurodegeneration alongside amyloid, we run an amyloid-β and tau co-pathology model built on the same ARTE10 background, and the wider Alzheimer's disease model portfolio covers adjacent questions. Our Microglia, Astrocytes & Neurodegenerative Diseases Initiative collects the methodology behind the glial endpoints.
When is Tg2576 still the right choice?
Tg2576 remains the appropriate model when the scientific question is tied to that specific line rather than to amyloid biology in general. Three situations qualify. First, replication or extension of an existing Tg2576 dataset, where switching lines would compromise comparability with historical control data generated within the same program. Second, mechanistic work of a target whose published biology was established in Tg2576 and whose expression or engagement has not been characterized in other models. Third, studies that deliberately exploit the slower, single-transgene trajectory, for example to interrogate the pre-deposition phase, when insoluble Aβ is rising but histological plaques remain minimal (Kawarabayashi, 2001).
It is also worth being explicit about what ARTE10 does not offer. Like Tg2576 and other APP or APP-presenilin transgenic lines, ARTE10 does not develop neurofibrillary tangles, and tau hyperphosphorylation in aged homozygotes is confined to a minority of plaque-associated dystrophic neurites (Willuweit, 2009). ARTE10 is an amyloid model, and it carries the broader caveat associated with APP overexpression models: phenotypes attributable to supraphysiological APP levels are not necessarily features of Alzheimer's disease (Sasaguri, 2017).
Which amyloid model should you choose for your therapeutic program?
For most amyloid-directed therapeutic programs, the recommendation is the homozygous APP/PS1 (ARTE10) line, with Tg2576 reserved for continuity with legacy data. The case rests on four properties that act directly on study cost and the probability of detecting a treatment effect: plaque onset at 3 months and complete penetrance by 5 months (Willuweit, 2009); no reported sex difference in amyloid burden, in contrast to the nearly three-fold higher burden in female Tg2576 mice at 15 months (Callahan, 2001); congophilic dense-core plaques from the earliest deposits, which are the species bound by amyloid PET tracers (Willuweit, 2021); and a fibril fold that includes the human type II polymorph found in patient brain (Zielinski, 2023). For vascular endpoints, the model carries measurable cerebral and vascular amyloid at 10 months (Shahid, 2026).
Choose APP/PS1 (ARTE10) when the objective is to detect and quantify an amyloid-lowering, plaque-targeting, or neuroinflammatory effect within a year, particularly with longitudinal MRI, or when the program needs a vascular amyloid substrate for ARIA-directed safety work (Hampel, 2023). The trade-off is the absence of tangle pathology and frank neuronal loss, which is the gap our co-pathology model is designed to fill.
Choose Tg2576 when the program must match an existing Tg2576 dataset, when the target's biology is documented specifically in that line, or when the slower pre-deposition phase is itself the object of study (Kawarabayashi, 2001). Accept, in that case, a study that starts around 11 months, a cohort that must be stratified or restricted by sex, task selection constrained by the retinal degeneration allele on the conventional background, and over-enrolment to account for attrition (Callahan, 2001; Yassine, 2013).
Our team would be happy to discuss model selection, cohort sizing, and endpoint strategy for your AD program. Contact us to scope a study.
Choose APP/PS1 (ARTE10) when
The objective is to detect and quantify an amyloid-lowering, plaque-targeting or neuroinflammatory effect within a year.
You want longitudinal, within-animal MRI.
The program needs a vascular-amyloid substrate for ARIA-directed safety work.
The trade-off being accepted is the absence of tangle pathology and of frank neuron loss, which is the gap our co-pathology model is designed to fill.
Choose Tg2576 when
The program must match an existing Tg2576 dataset.
The target's biology is documented only in that line.
The slower pre-deposition phase is itself the object of study.
Accept a study that starts around 11 months, sex stratification or restriction, task selection constrained by the retinal degeneration allele, and over-enrolment to cover attrition (Callahan, 2001; Yassine, 2013).
Final CTA
Get to your go/no-go decision sooner
Our team runs the homozygous APP/PS1 (ARTE10) model end to end, from dosing through MRI, spatial analysis of Aβ plaques and neuroinflammation, and translational fluid biomarkers. Tell us about your Alzheimer’s disease program and we'll propose a model, cohort size, and endpoint strategy.
FAQs
FAQs
References
Keywords
Related Content
Related Content
Amyloid-β & Inflammatory Microenvironment in Alzheimer's Mice
Spatial relationships between plaques, microglia and astrocytes in APP/PS1 mice.
5xFAD vs. APP/PS1 Mice for Alzheimer's Drug Development
How APP/PS1 compares with a faster, more aggressive amyloid line.
Amyloid-β Plaque Analysis in Alzheimer's Disease
Methods to classify and quantify Aβ plaques in human and rodent tissue.