アルツハイマー病マウスモデルおよびタウオパチーマウスモデル
神経変性および神経炎症(活性化ミクログリアおよび反応性アストロサイト)を含む、加齢に伴う疾患進行を示すアミロイドβおよびタウマウス。
アミロイドβトランスジェニックモデル
ヒトのアルツハイマー病の特徴であるベータ・アミロイド病理は、遺伝子組み換えマウスにおける変異型ヒトアミロイド前駆体タンパク質(APP)およびプレセニリン1(PS1;PSEN1)の過剰発現によりモデル化することができます。ヒトの疾患と同様に、病理の進行は加齢とともに増加します。
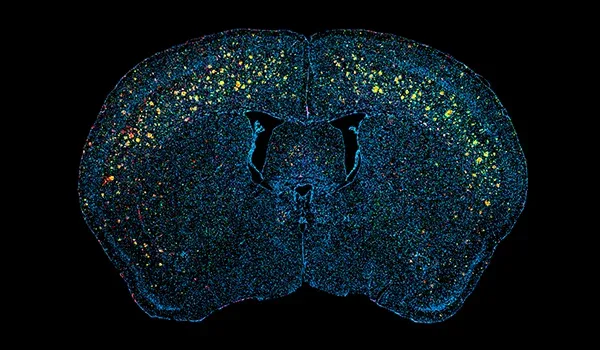
私たちが実験的治療薬の有効性を前臨床評価する際に使用しているAPP/PS1モデルは、再現性が高く、ヒトのアルツハイマー病のいくつかの重要な特徴を再現しています。これらのマウスでは、アミロイドベータ(Aβ)プラーク、脳血管病理、神経炎症が徐々に進行します。治療介入に対する反応は、デジタル化された脳組織切片の多重免疫蛍光染色の高度な画像解析を含む、いくつかの定量的な測定値によって評価することができます。
アミロイドベータとタウの共病理モデル
当社のアミロイドベータ(Aβ)とタウの共病理マウスモデルは、トランスジェニック技術とウイルスベクターベースの技術を組み合わせることで、アルツハイマー病の2つの特徴的な病理所見——Aβプラークの蓄積とタウ関連神経変性——を再現しています。このモデルは、アルツハイマー病の病態メカニズムの解明および疾患修飾療法の有効性評価のための、堅牢で臨床応用可能性の高いプラットフォームを提供します 。
アミロイドβ病理は、年齢依存的にAβプラークの沈着を示すAPP/PS1トランスジェニックマウスを用いて確立されています。タウ病変を誘導するため、野生型ヒトタウ(2N4R)をコードするアデノ随伴ウイルス(AAV)ベクターを、疾患関連脳領域にステレオタクティック注射により投与します。この標的発現により、神経細胞体および突起内にリン酸化タウ凝集体が蓄積します。この共病理モデルは、アルツハイマー病に関連する複雑な病理学的相互作用を反映した、顕著な神経炎症、神経変性、および関連する機能障害を示します。

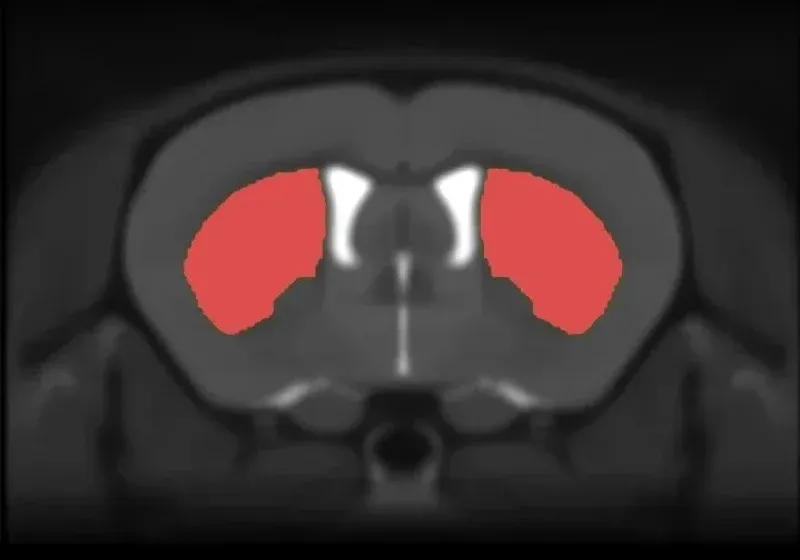
アミロイドβプラークおよび脳血管病理
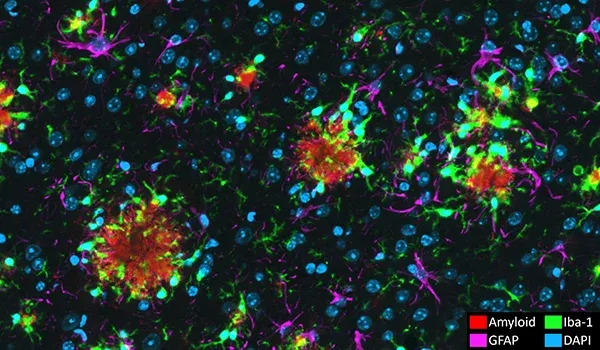
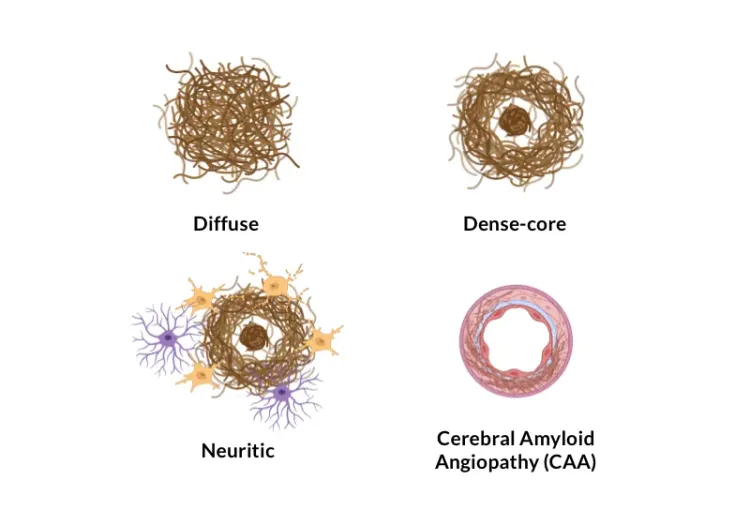
細胞外プラークおよびアミロイドβ凝集物の脳血管沈着は、アルツハイマー病の神経病理学的特徴です(Serrano-Pozo, 2011)。当社のAPP/PS1マウスモデルでは、アミロイドβ病理(びまん性、高密度コア、神経原性プラーク、細胞内アミロイドβ、および脳血管病理を含む)が時間経過とともに増加することが示されています。Aβ病理は明確な時空間パターンで進行し、当社チームが開発した高度なアルゴリズムを使用して定量化することができます。
タウ病理学
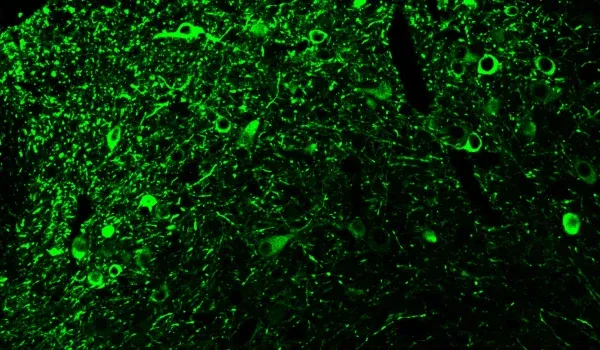
アミロイドβに加えて、タウはアルツハイマー病で発見される主要なミスフォールドタンパク質です。タウは、ADの臨床的および神経画像的特徴のいくつかの主な要因であると考えられています(Lew, 2021;Carbonell, 2025)。当社のAPP/PS1/ヒトタウモデルは、アミロイドβとタウ病理の両方を示しています。リン酸化タウ染色は細胞体および細胞突起で観察されます。進行性核上性麻痺、大脳皮質基底核変性症、および前頭側頭型認知症などのタウオパチーは、特定の脳領域に純粋なタウ病理を示します。AAV-hTauモデルでは、タウ発現を黒質および中脳領域に標的化することで、パーキンソン病の特徴を持つタウオパチーを効果的にモデル化することができます。
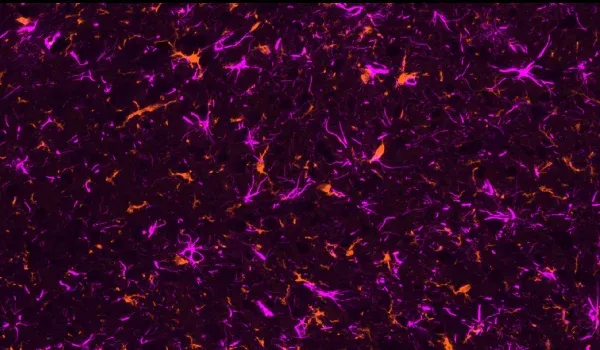
活性化ミクログリアと反応性アストロサイト
活性化ミクログリアや反応性アストロサイトなどの神経炎症細胞は、ミスフォールドしたアミロイドβおよびタウの近傍に存在することが確認されています(Minter, 2015;Chen and Yu, 2023)。我々のAPP/PS1マウスモデルでは、Aβプラーク、活性化ミクログリア、非活性化ミクログリアの間に 、またAβプラークと肥大および非肥大アストロサイトの間に、空間的および時間的な関係があることを実証しました。また、APP/PS1/hTau共病態モデルおよびAAV誘発性タウオパチーモデルでは、リン酸化タウに関連して強いミクログリア症およびアストログリア症が観察されています。
タウオパチーによるパーキンソン様運動症状
進行性核上性麻痺および皮質基底核変性症は、純粋なタウオパチーであり、他の臨床症状の中でも、パーキンソン様症状と黒質における重度の神経細胞の損失が特徴です(Oyangi, 2001)。私たちのAAV-hTauモデルでは、黒質におけるドーパミン作動性ニューロンの変性とそれに伴う線条体の神経支配の減少の結果、著しい運動障害(シリンダテスト、尾懸垂振とう試験、ロータロッドテスト、 後肢把持試験に基づく)が認められました。
アルツハイマー病マウスモデルの特徴
以下のインタラクティブ・プレゼンテーションでは、in vivoデータおよびMultiplex免疫蛍光組織切片全体の高解像度画像を含む、ヒトADおよび我々のアルツハイマー病マウスモデルにおけるアミロイドβ、タウ、および脳萎縮の関係を調べることができます。
左側のパネルを使って、この「イメージストーリー」を簡単にナビゲートすることができます。
高解像度の顕微鏡画像は、マウスの左ボタンで移動できます。 マウスまたはトラックパッド(上/下)または左上隅の + および - ボタンを使用して、拡大/縮小が可能です 。右上隅のコントロールパネル では、チャンネルとセグメンテーションの切り替え(オン/オフ)、色の変更、画像設定の調整が可能です。
最高のインタラクティブ体験 をお楽しみいただくには、フルスクリーンモード のご利用をお勧めします。
アルツハイマー病およびタウオパチーマウスモデルの特性評価、検証済みの測定方法、前臨床神経科学CROサービスについて、さらに詳しく知ることができます。
関連コンテンツ
アルツハイマー病に関する最新情報と、アルツハイマー病の動物モデルにおける治療薬の評価に関するベストプラクティス。
ALS, アルツハイマー病, パーキンソン病におけるミクログリアの形態
ミクログリアの形態解析の概要と, 神経変性疾患の研究および創薬・薬剤開発への応用。
アルツハイマー病におけるアミロイドβプラーク分析
ヒトおよびアルツハイマー病動物モデル(トランスジェニックマウスおよびラット)の脳組織切片におけるAβプラークの分類および定量化方法の概要。