临床前网站临床网站

淀粉样蛋白β转基因模型

人类阿尔茨海默病的典型病理——β-淀粉样蛋白,可通过转基因小鼠中人类淀粉样蛋白前体蛋白(APP)和早老性痴呆症1(PS1;PSEN1)的突变体过量表达来模拟。与人类疾病类似,病理的演变会随着年龄的增长而加剧。

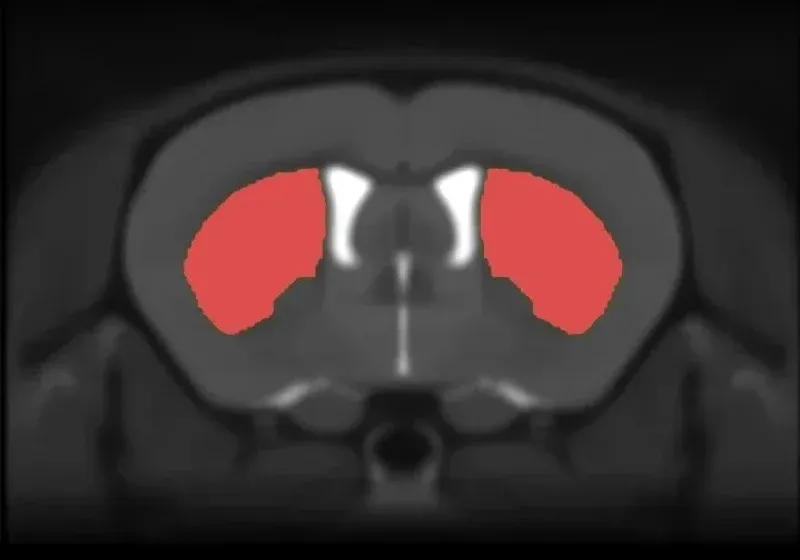
我们用于临床前评估实验性、疾病改良治疗剂疗效的APP/PS1模型具有高度可重复性,并复制了人类AD的多个关键特征。这些小鼠表现出淀粉样蛋白(Aβ)斑块、脑血管病变和神经炎症的渐进性发展。治疗干预的反应可以通过多种定量读数进行评估,包括对数字化脑组织切片的多重免疫荧光染色进行高级图像分析。

β-淀粉样蛋白 模型 mIF 扫描

Tau 病的 AAV-Tau 小鼠模型

成年啮齿动物大脑中的tau病理可通过注射腺相关病毒(AAV)载体产生。在这种tau病(进行性核上性麻痹、皮质基底变性)小鼠模型中,野生型(C57BL/6)小鼠接受立体定向注射,将表达野生型人类tau的AAV载体注入黑质致密部附近。

这种健壮的tau蛋白病模型在病理学上显示了神经元体和神经突触中磷酸化tau蛋白聚集、神经炎症(包括活化的小胶质细胞和反应性星形胶质细胞)、神经变性(包括活体MRI扫描中的局部脑萎缩)和多巴胺能神经退化。在这些tau病小鼠模型中,由于单侧多巴胺能神经元缺失,导致运动功能严重受损,包括圆柱测试、悬尾摆动测试、后肢夹紧测试和旋转棒测试中的表现异常。

小鼠体内 AAV Tau 的显微图像

Tau纤维扩散模型

成年小鼠大脑中的tau病理可通过接种重组tau纤维或人脑提取物产生。在这种阿尔茨海默病小鼠模型中,P301S突变tau(PS19)转基因小鼠接受立体定向注射tau预成纤维(PFF)到大脑中,以诱导tau病理的种子和扩散。

这种健壮的tau小鼠模型在神经元的细胞体和突起中显示出高磷酸化tau聚集、神经炎症(包括活化的小胶质细胞和反应性星形胶质细胞)和神经变性。治疗功效可通过临床评估(例如体重变化 )、血液和脑脊液中神经丝轻链(NfL;NF-L)的测量以及定量免疫组织化学和多重免疫荧光分析进行评估。

大脑组织的微观视图,特别突出了与阿尔茨海默氏症等神经退行性疾病相关的tau纤维

阿尔茨海默氏症和Tau蛋白病模型对人类疾病的可转化性

多重IHC图像

淀粉样蛋白斑块和脑血管病变

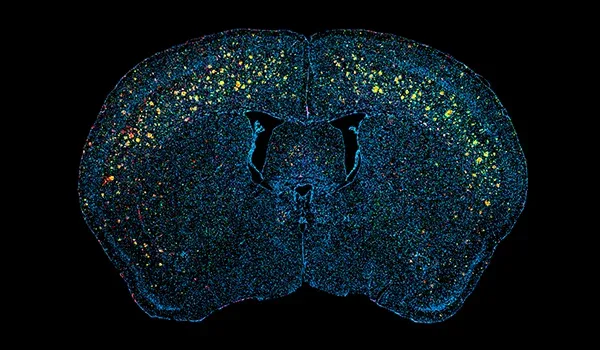
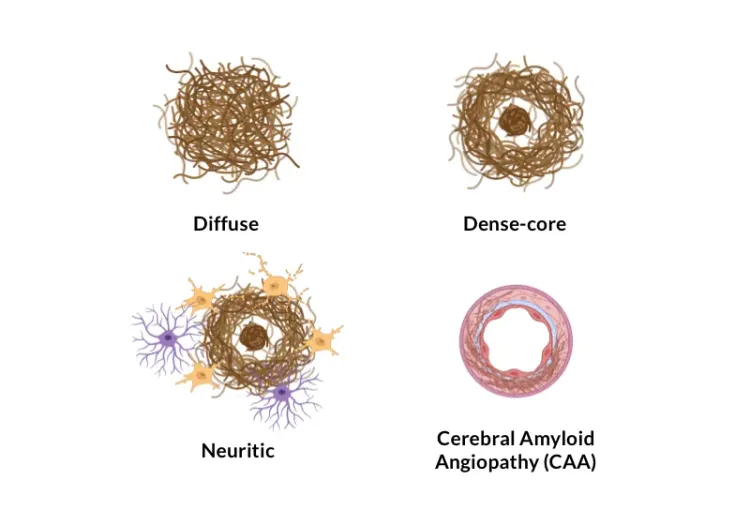
淀粉样蛋白β聚集形成的细胞外斑块和脑血管沉积是阿尔茨海默病的神经病理学特征(Serrano-Pozo,2011)。我们的APP/PS1小鼠模型显示淀粉样蛋白病理(包括弥漫性、致密核和神经斑块、细胞内淀粉样蛋白和脑血管病理)随时间推移而增加。淀粉样蛋白病理以一种明确的时空模式发展,并可通过我们团队开发的复杂算法进行量化。

注射SNc中的AT8免疫荧光染色

Tau 病理学

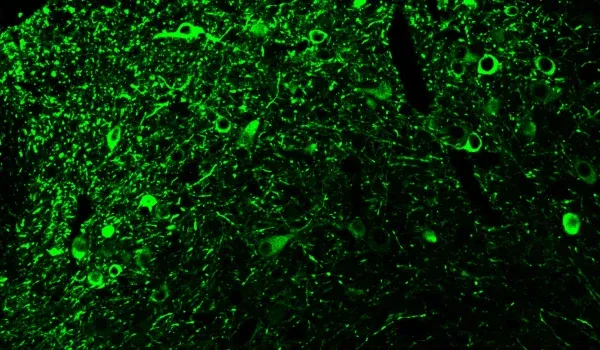
此外,淀粉样蛋白和β蛋白、Tau蛋白是阿尔茨海默病中的一种关键错误折叠蛋白。Tau蛋白被认为是AD(Lew,2021Carbonell,2025)一些临床和神经影像学特征的主要驱动因素。我们的APP/PS1/人类Tau模型同时展示了淀粉样蛋白和β蛋白以及Tau蛋白的病理学。在细胞体和突起中观察到磷酸化tau染色。 进行性核上性麻痹、皮质基底变性、额颞痴呆等tau病在特定脑区表现出纯tau病理。 在我们的AAV-hTau模型中,我们能够将tau表达定位于黑质和中脑区域,从而有效地模拟具有帕金森特征的tau病。

注射SNc中的Iba-1和GFAP双重免疫荧光染色

活化的微胶质细胞和反应性星形胶质细胞

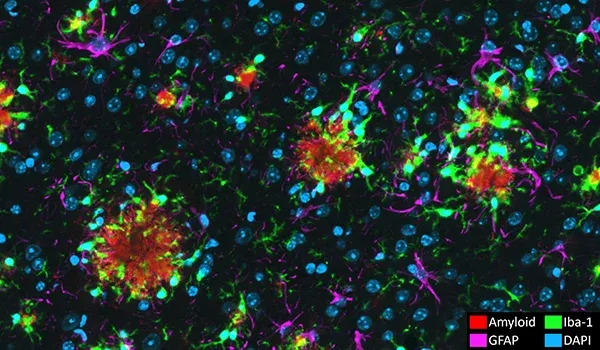
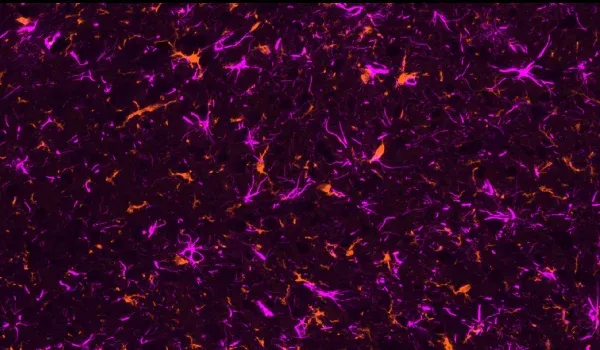
神经炎症细胞,包括活化的微胶质细胞和反应性星形胶质细胞,与错误折叠的淀粉样蛋白和tau蛋白紧密相邻(Minter,2015 ;Chen和Yu,2023)。在我们的APP/PS1小鼠模型中,我们证明了Aβ斑块、活化小胶质细胞和非活化小胶质细胞之间以及 Aβ斑块和肥大&非肥大星形胶质细胞之间存在空间和时间关系。在我们的APP/PS1/hTau共病模型和AAV诱导的tau病模型中,我们还观察到与磷酸化tau相关的强烈小胶质细胞和星形胶质细胞病变。

Tau病 帕金森运动特征

进行性核上性麻痹和皮质基底变性是纯粹的tau病,除其他临床表现外,其特点为帕金森氏症特征和黑质神经元严重丢失(Oyangi,2001)。在我们的AAV-hTau模型中,我们发现由于黑质多巴胺能神经元退化和相应的纹状体神经元缺失,出现了明显的运动障碍(基于圆柱测试悬尾摆动测试旋转棒测试后肢夹紧测试)。

MRI 体积纹状体

区域性脑萎缩

多模态成像生物标记广泛用于阿尔茨海默氏症和 朊病毒病的临床试验。MRI衍生的区域体积和皮质厚度测量对脑萎缩高度敏感,可用于监测阿尔茨海默氏症、 进行性核上性麻痹皮质下退行性变额颞叶痴呆随时间推移的疾病进展。通过结合非侵入性的活体全脑核磁共振成像采集和先进的全自动图像处理与分析,我们发现了与tau病理学高度相关的区域脑萎缩,从而为神经退行性疾病和转化生物标记物提供了可靠的活体测量方法。

阿尔茨海默病小鼠模型特点

通过下面的互动演示,您可以了解我们对淀粉样蛋白-β和tau共病理(APP/PS1/hTau)小鼠模型的特征描述,包括体内数据和整个多重免疫荧光组织切片的高分辨率图像。

您只需使用左侧面板浏览图像故事”即可。

您可以使用鼠标左键在高清显微镜图像中平移您可以使用 鼠标/触控板(上/下)或左上角的+和-按钮放大和缩小 。您可以在右上角的控制面板中 切换(开/关)、更改颜色以及调整通道和分割的图像设置。

们建议使用 全屏模式,以获得 最佳交互体

Characterization of a New Amyloid-β & Tau Co-Pathology Mouse Model of Alzheimer's Disease

1/13

Biospective Preclinical Logo

Alzheimer’s disease (AD) is pathologically defined by the presence of amyloid-β plaques and tau neurofibrillary tangles. While a broad range of animal models of AD exist, these models typically demonstrate amyloid-β or tau pathology, but not both. As such, there is a need for a “co-pathology” model which better recapitulates human disease and demonstrates features that can be measured using “translational biomarkers”.

Our group has developed an adeno-associated virus (AAV) vector-induced mouse model of tauopathies with Parkinsonian features (e.g. Progressive Supranuclear Palsy, Corticobasal Degeneration). We have adapted this modeling strategy by injecting AAV-hTau into a transgenic APP/PS1 mouse model to generate a co-pathology model of AD.

This Interactive Presentation illustrates some of the interesting behavioral, neuroimaging, and pathologic features of Biospective's amyloid-β/hTau co-pathology mouse model.

This model was generated by injecting 6 month-old transgenic APP/PS1 (ARTE10) mice with AAV-hTau (wild-type 2N4R human tau) or AAV-null (control) vectors bilaterally into the anterior insula and the lateral entorhinal cortex using a digital stereotaxic device with an automated microinjector.

Atlas Views with AAV Injection Sites

Atlas Views of Cortical Injection Sites of AAV-Tau vectors

Multiplex immunofluorescence (mIF) images were generated by immunostaining for amyloid-β (fibrillar), phospho-tau (AT8), GFAP, Iba-1, and counterstained with the DAPI nuclear stain. Tissue sections were digitized using a high-throughput slide scanner and were processed using Biospective's PERMITSTM software platform.

To navigate though this Image Story, you can use the arrows and/or the Table of Contents icon in the upper right corner of this panel.

Navigation Panel with Tooltips

You can also interact with the microscopy image in the viewer on the right at any time to further explore this high-resolution data.

Overview of the APP/PS1 (ARTE10) Transgenic Mouse Model

ARTE10 [C57BL/6NTac.CBA-Tg(Thy1-PSEN1*M146V,-APP*Swe)10Arte] (APP/PS1) homozygous mice (Willuweit, 2009), generated on a C57BL/6NTac background, are a transgenic line incorporating the Swedish mutation of human amyloid precursor protein (APPsw) and the M146V mutation in human Presenilin 1 (PS1M146V). These mice express high levels of human amyloid-beta (Aβ) peptides via amyloidogenic processing of APP, and develop Alzheimer's disease-like amyloid pathology. This transgenic mouse model has been used for non-invasive imaging of amyloid-β plaques with Amyloid PET imaging tracers (Willuweit, 2021).

Multiplex Immunofluorescence Brain Images from ARTE10 Mice

Representative coronal brain tissue sections showing the spatiotemporal progression of amyloid-β pathology in APP/PS1 (ARTE10) mice.

Plots Showing the Progression of Amyloid-Beta Pathology in ARTE10 Mice

Quantitative analysis of the age-dependent increase in the density of amyloid-β plaques in the cerebral cortex of APP/PS1 (ARTE10) mice. *p<0.05, **p<0.01, ***p<0.001, ****p<0.0001

Our team at Biospective has also characterized the neuroinflammatory microenvironment around plaques in this model, as well as examined both microglia morphology and astrocyte morphology.

Examples of Amyloid-Beta Plaque Neighborhoods

Examples of “neighborhoods” of amyloid-β plaques to allow for microenvironment analysis.

Amyloid-β and Phosphorylated Tau in APP/PS1/hTau Mice (Anterior Brain; Low Magnification)

This microscopy image shows amyloid-β (fibrillar) and phospho-tau staining in an entire coronal section (anterior part of the brain) of an APP/PS1/hTau mouse. For reference, an illustration with atlas labels for this approximate brain level is provided below. You can zoom-in to observe the staining at higher magnification.

Coronal Brain Atlas at the Level of the Anterior Olfactory Nucleus

Coronal Mouse Brain Section (Bregma +2.0) with Neuroanatomy Labels

Amyloid-β, pTau, and Neuroinflammation in APP/PS1/hTau Mice (Anterior Brain; High Magnification)

High magnification image showing phosphorylated tau (in neuronal soma and processes), fibrillar amyloid-β (plaques and vascular pathology), microglia, and astrocytes. Note the extensive level of neuroinflammation.

Amyloid-β and Phosphorylated Tau in APP/PS1/hTau Mice (Middle Brain; Low Magnification)

Low magnification image showing phosphorylated tau (in neuronal soma and processes) and fibrillar amyloid-β (plaques and vascular pathology. Note the extensive phosphorylated tau in the piriform cortex. For reference, an illustration with atlas labels for this approximate brain level is provided below.

Coronal Brain Atlas at the Level of the Piriform Cortex

Coronal Mouse Brain Section (Bregma -1.0) with Neuroanatomy Labels

Amyloid-β and Phosphorylated Tau in APP/PS1/hTau Mice (Middle Brain; High Magnification)

High magnification image showing phosphorylated tau (in neuronal soma and processes) and fibrillar amyloid-β (plaques and vascular pathology). Note the extensive level of phosphorylated tau in the piriform cortex.

pTau, Microgliosis, and Astrogliosis in APP/PS1/hTau Mice (Middle Brain; High Magnification)

High magnification image showing phosphorylated tau (in neuronal soma and processes), microglia, and astrocytes. Note the extensive level of neuroinflammation in the piriform cortex.

The plots below show the quantitative analysis of Iba-1 and GFAP stain density in brain regions with amyloid-β and tau pathology.

Regional Iba1 Staining Density Analysis Praphs

Iba-1 stain density for APP/PS1/hTau compared to APP/PS1 (control) mice in Anterior, Piriform, and Entorhinal Cortex regions; mean ± SEM, t-test, *** p<0.001

Regional GFAP Staining Density Analysis Plots

GFAP stain density for APP/PS1/hTau compared to APP/PS1 (control) mice in Anterior, Piriform, and Entorhinal Cortex regions; mean ± SEM, t-test, *** p<0.001, ****p<0.0001

Amyloid-β and Phosphorylated Tau in APP/PS1/hTau Mice (Posterior Brain; Low Magnification)

Low magnification image showing phosphorylated tau (in neuronal soma and processes) and fibrillar amyloid-β (plaques and vascular pathology). Note the extensive phosphorylated tau in the left entorhinal cortex (the entorhinal cortex in the right hemisphere was not injected in this brain as a control). For reference, an illustration with atlas labels for this approximate brain level is provided below.

Coronal Mouse Brain Section at the Level of the Entorhinal Cortex

Coronal Mouse Brain Section (Bregma -3.2) with Neuroanatomy Labels

Amyloid-β and Phosphorylated Tau in APP/PS1/hTau Mice (Posterior Brain; High Magnification)

High magnification image showing phosphorylated tau (in neuronal soma and processes) and fibrillar amyloid-β (plaques and vascular pathology) in the entorhinal cortex.

Sleep Alterations in APP/PS1/hTau Mice

Sleep is altered in Alzheimer’s disease and has been associated with tau-driven neuropathology. Increased daytime sleep has been observed in later stages of the disease.

We have performed an assessment of sleep-wake cycles in the APP/PS1/hTau model using the non-invasive PiezoSleep system. The plot below shows the increased level of sleep in the dark phase in APP/PS1/hTau mice compared to APP/PS1 mice (corresponding to daytime sleep in humans).

PiezoSleep System Illustration and Plot of Sleep Percentage

Percentage of sleep in the light and dark phases measured by the PiezoSleep system.

Brain Atrophy in the APP/PS1/hTau Model

We have acquired in vivo anatomical MRI data from wild-type (WT), WT/hTau, APP/PS1, and APP/PS1/hTau mice at 4 weeks following injection of AAV-hTau or AAV-null (control) vectors. We generated regional volumes and cortical thickness measures using our fully-automated NIGHTWINGTM image processing platform. The figures below show MRI atlases and quantitative measures in several brain regions.

MRI Atlas and Regional Volumes

Anatomical MRI with segmented regions, and plots of regional volumes assessed in wild-type (hashed), and APP/PS1 (solid), AAV-null and hTau mice. **p<0.01,***p<0.001, ****p<0.0001

MRI Atlas and Regional Thickness

Mouse brain surface rendering with segmented entorhinal cortex, as well as a plot of the regional thickness assessed in wild-type (hashed), and APP/PS1 (solid), AAV-null and hTau mice. *p<0.05, **p<0.01, ***p<0.001, ****p<0.0001

Note that APP/PS1 mice do not show any brain atrophy compared to WT mice. The injection of AAV-hTau induced highly significant reductions of regional volumes and cortical thickness. Interestingly, the APP/PS1/hTau mice appear to have greater brain atrophy compared the the WT/hTau mice, suggesting a potential modulatory role of amyloid-β.

Translation of Mouse MRI Brain Atrophy Data to Human Alzheimer's Disease

Our team at Biospective has performed a rigorous analysis of the relationship between amyloid-β, tau, and cortical thickness in human Alzheimer’s disease. This analysis was performed using Amyloid PET, Tau PET, and 3D Anatomical MRI data from the ADNI study. We have found that tau, rather than amyloid-β, is primarily responsible for cortical thinning, as well as regional cerebral glucose metabolism, which can be appreciated in the figure below.

Statistical Maps Showing the Effect of Tau and Amyloid on Cortical Thickness and Glucose Metabolism

t-Statistic maps (thresholded for statistical significance) demonstrating the effect of tau and amyloid-β on both cortical thickness and cerebral glucose metabolism.

We have further demonstrated that the correlation between tau and cortical thickness is increased as the amyloid-β burden increases, which is apparent in the video below.

Statistical maps showing increased regional correlation between tau and cortical thickness as a function of amyloid-β load.

This human neuroimaging data corresponds well with our mouse MRI data showing that tau is the primary driver of brain atrophy with an apparent increase in the presence of amyloid-β.

Summary

This novel amyloid-β/tau co-pathology mouse model recapitulates several features of Alzheimer’s disease. In terms of the neuropathology, we have observed parenchymal (including diffuse, dense-core, and neuritic plaques) and vascular Aβ aggregates, phosphorylated tau in cell bodies and processes (including dystrophic neurites), microgliosis, and astrogliosis. We plan to further explore the relationships between the misfolded proteins and neuroinflammation in this model.

One of the most interesting observations is the neurodegenerative phenotype in the APP/PS1/hTau mice. The regional brain atrophy observed via structural analysis of the anatomical MRI scans can provide a robust way to evaluate the effects of potential interventions and serve as a translational biomarker given the widespread use of neuroimaging in AD clinical trials.

Based on the quantifiable in-life and post-mortem measures that we have reported, APP/PS1/hTau mice can serve as a useful model for preclinical evaluation of novel disease-modifying therapeutics for Alzheimer’s disease.

Please feel free to further explore the microscopy image in the viewer.

We would be happy to discuss this model and our characterization if you would like to Contact Us.

Table of Contents
Control Panel
Section: Coronal Section 1
Channels

了解更多关于我们阿尔茨海默氏病和Tau蛋白病小鼠模型的特征、我们经过验证的测量方法以及我们的临床前神经科学合同研究组织(CRO)服务。

常见问题解答

APP/PS1转基因小鼠模型的主要病理特征是什么?


是否随时可以获得适合年龄的APP/PS1小鼠用于研究?


使用APP/PS1小鼠进行研究的典型持续时间是多少?


阿尔茨海默氏症模型中是否存在活化的小胶质细胞?


参考资料


关键词


相关内容

关于阿尔茨海默氏病和阿尔茨海默氏病动物模型治疗剂评估最佳实践的最新信息。

更多信息

请告诉我们您感兴趣的内容。我们的团队将很乐意与您讨论!

请发送电子邮件至 [email protected] 或填写并提交以下表格。

姓名*
电子邮件*
电话号码*
所属单位(公司/大学)*
留言内容*

我们非常重视您的隐私。我们将按照隐私声明中的规定保护您的数据。

我同意隐私声明的条款*

我们使用必要的cookie来确保网站正常运行。我们还使用其他cookie来衡量您使用网站的情况或用于营销目的,从而帮助我们进行改进。您可以选择全部接受或全部拒绝。关于我们使用的cookie的详细信息,请参阅我们的隐私声明