전임상 웹사이트임상 웹사이트

알츠하이머병 마우스 모델 및 타우병증 마우스 모델

신경 퇴행 및 신경 염증(활성화된 미세 아교세포 및 반응성 성상교세포)을 포함한 연령에 따른 질병 진행을 보이는 아밀로이드 베타 및 타우 마우스.

아밀로이드-베타 형질전환 모델

인간 알츠하이머병의 특징인 베타-아밀로이드 병리학은 돌연변이 인간 아밀로이드 전구체 단백질(APP)과 프리세닐린 1(PS1; PSEN1)의 과발현을 통해 형질전환 마우스에서 모델링할 수 있습니다. 인간 질병과 유사하게, 병리학의 진화는 나이가 들면서 증가합니다.

실험적 질병 조절 치료제의 효능을 전임상 평가하는 데 사용하는 APP/PS1 모델은 재현성이 뛰어나며, 인간 알츠하이머병의 여러 주요 특징을 재현합니다. 이 마우스는 진행성 아밀로이드 베타(Aβ) 플라크, 뇌혈관 병리, 신경염을 나타냅니다. 치료적 개입에 대한 반응은 디지털화된 뇌 조직 섹션의 다중 면역형광 염색에 대한 고급 이미지 분석을 포함한 여러 정량적 판독을 통해 평가할 수 있습니다.

베타-아밀로이드 모델 mIF 스캔

타우 병증의 AAV-Tau 마우스 모델

성인 설치류 뇌에서 타우 병리 생성은 아데노 연관 바이러스(AAV) 벡터의 주입을 통해 생성될 수 있습니다. 이 타우병증(진행성 핵상마비, 피질-기저 변성)의 마우스 모델에서, 야생형(C57BL/6) 마우스는 야생형 인간 타우를 과발현하는 AAV 벡터를 선조체 흑질 부근에 정위 주사합니다.

이 견고한 타우병 모델은 병리학적으로 뉴런 체세포와 신경돌기에 있는 인산화 타우 응집체, 신경염증(활성화된 미세아교세포와 반응성 성상교세포 포함), 신경퇴행 (생체 내 MRI 스캔에서 나타나는 국소 뇌 위축 포함), 도파민성 탈신경을 보여줍니다. 이 타우병 쥐 모델에서 일방적인 도파민성 신경세포 손실로 인해 상당한 운동 장애가 관찰되었으며, 여기에는 실린더 테스트, 꼬리 매달기 스윙 테스트, 뒷다리 움켜쥐기 테스트, 로터리 로드 테스트의 변화가 포함됩니다.

생쥐의 AAV 타우 현미경 이미지

타우 섬유소 확산 모델

성인 마우스 뇌에서 타우 병리 생성은 재조합 타우 피브릴 또는 인간 뇌 추출물의 접종을 통해 생성될 수 있습니다. 이 알츠하이머병 마우스 모델에서, P301S 돌연변이 타우(PS19) 형질전환 마우스는 타우 프리폼드 피브릴(PFF)을 뇌에 정위 주사하여 타우 병리의 씨앗과 확산을 유도합니다.

이 견고한 타우 마우스 모델은 세포체와 뉴런의 과정, 신경염증(활성화된 미세아교세포와 반응성 성상교세포 포함), 신경퇴행에서 과인산화 타우 응집체를 보여줍니다. 치료 효과는 임상 평가(예: 체중 변화 ), 혈액 및 뇌척수액 내 신경원섬유 경쇄(NfL; NF-L) 측정, 정량적 면역조직화학 및 다중 면역형광 분석을 통해 평가할 수 있습니다.

뇌 조직의 현미경 사진, 특히 알츠하이머병과 같은 신경 퇴행성 질환과 관련된 타우 단백질 섬유를 강조

알츠하이머병 및 타우병 모델의 인간 질병으로의 번역 가능성

다중 IHC 이미지

아밀로이드 베타 플라크와 뇌혈관 병리

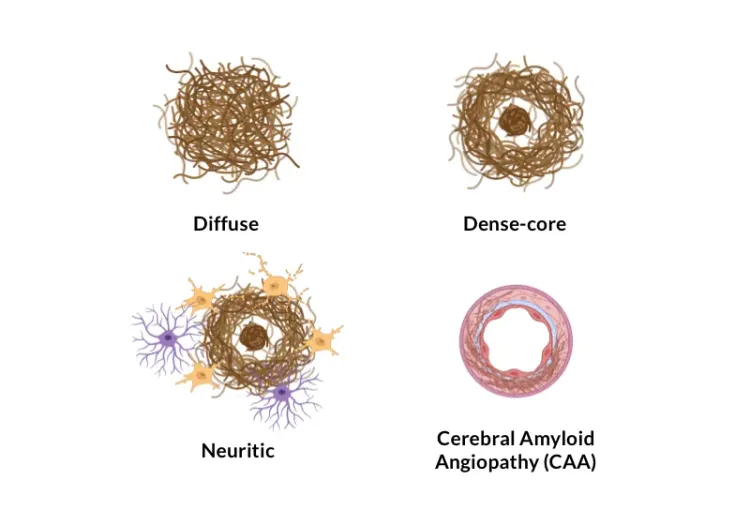
알츠하이머병의 신경병리학적 특징은 아밀로이드-베타의 응집으로 인한 세포 외 플라크와 뇌혈관 침착물입니다(Serrano-Pozo, 2011). 저희 APP/PS1 마우스 모델은 아밀로이드-베타 병리(확산성, 밀집성, 신경성 플라크, 세포 내 아밀로이드-베타, 뇌혈관 병리 포함)의 시간 의존적 증가를 보여줍니다. A&beta 병리학은 잘 정의된 시공간 패턴으로 진행되며, 저희 팀이 개발한 정교한 알고리즘을 사용하여 정량화할 수 있습니다.

투여된 SNc의 AT8 면역형광 염색

타우 병리학

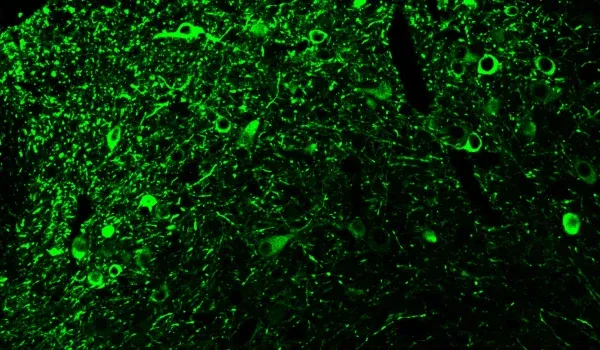
또한, 아밀로이드 베타와 함께 타우(tau)는 알츠하이머병에서 발견되는 주요한 오작동 단백질입니다. 타우는 알츠하이머병의 임상적, 신경 영상적 특징의 주요 원인으로 여겨집니다(Lew, 2021; Carbonell, 2025). 우리의 APP/PS1/인간 타우 모델은 아밀로이드 베타와 타우 병리를 모두 보여줍니다. 인산화 타우 염색은 세포체와 세포 돌기에서 관찰됩니다. 진행성 핵상마비, 피질-기저부 퇴행, 전두측두엽 치매와 같은 타우병증은 특정 뇌 영역에서 순수한 타우 병리를 나타냅니다. AAV-hTau 모델에서 우리는 타우 발현을 흑질과 중뇌 영역에 표적화하여 파킨슨병의 특징을 가진 타우병증을 효과적으로 모델링할 수 있습니다.

투여된 SNc에서의 Iba-1과 GFAP 이중 면역형광 염색

활성화된 미세아교세포와 반응성 아스트로사이트

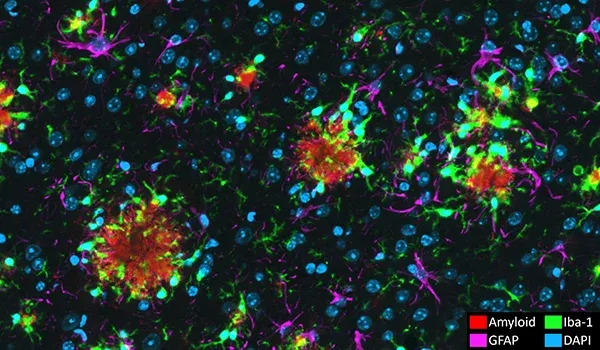
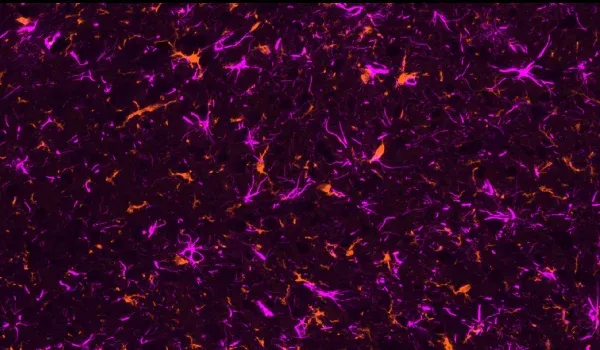
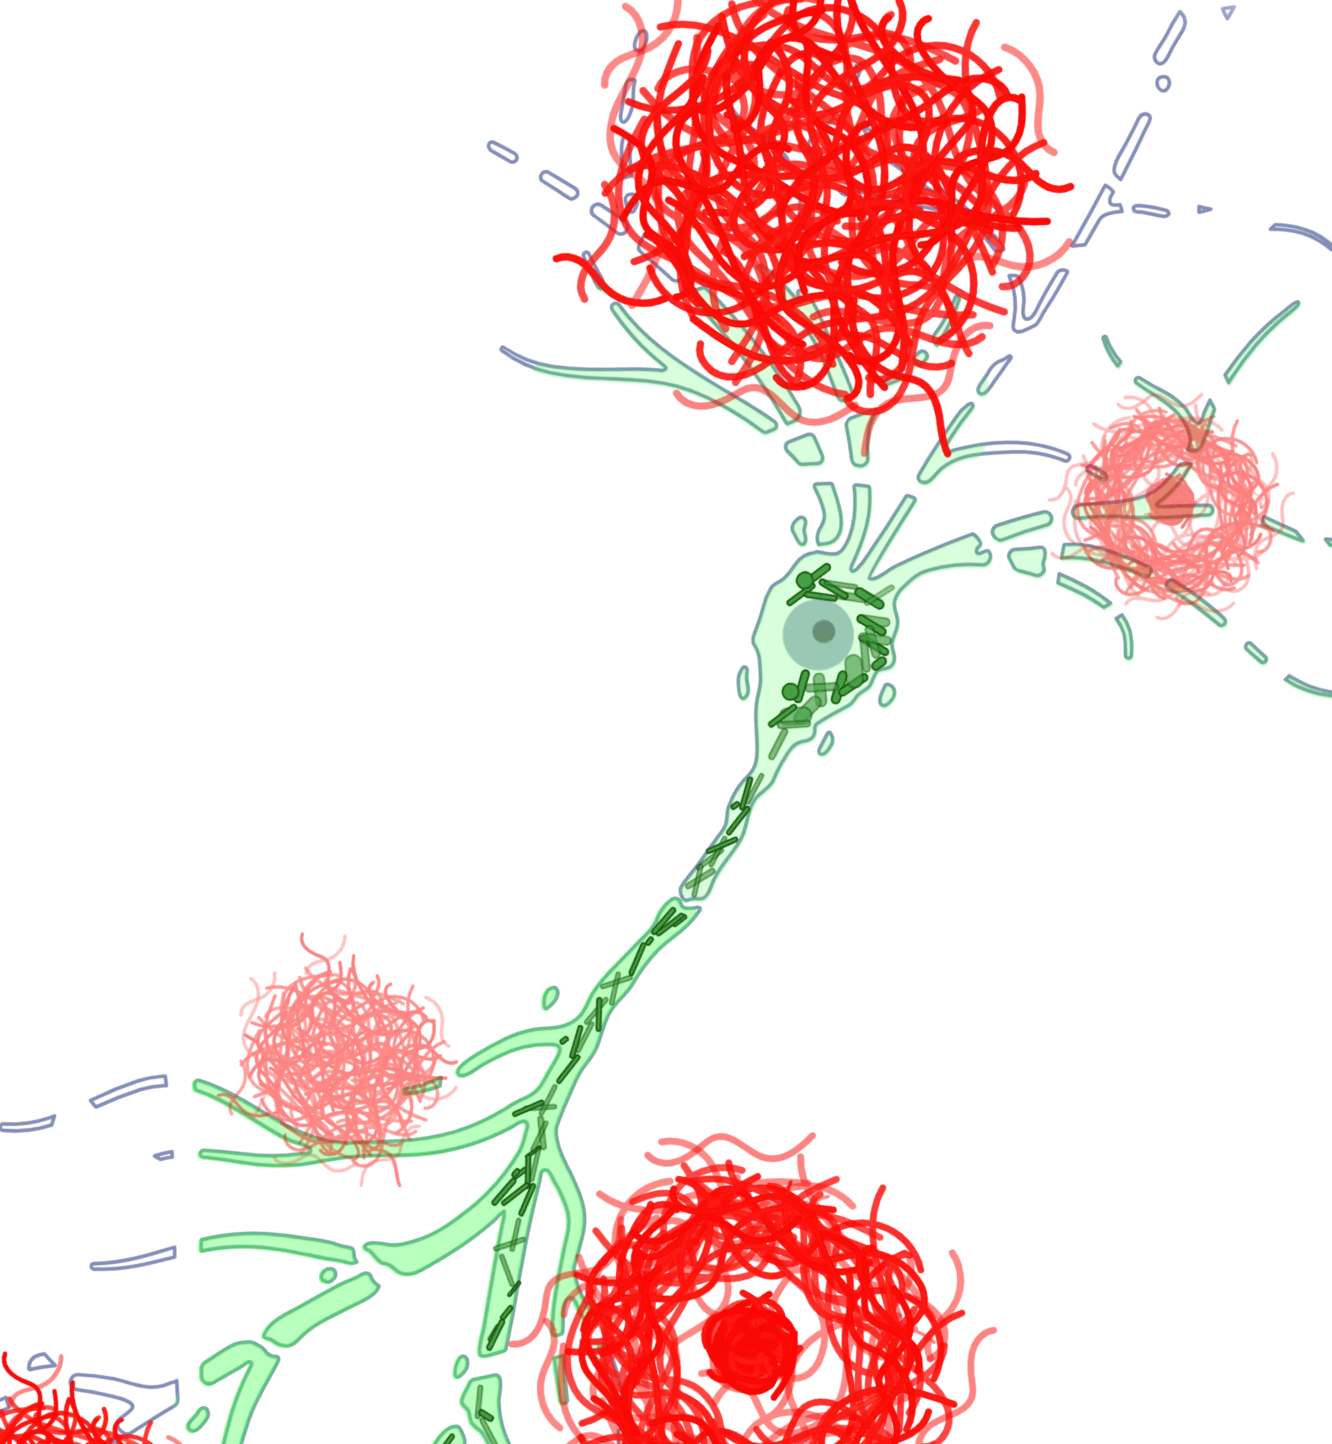
활성화된 미세아교세포와 반응성 성상교세포를 포함한 신경염증 세포는 오작동된 아밀로이드-베타 및 타우(Minter, 2015; Chen and Yu, 2023)와 가까운 곳에서 발견됩니다. 저희 APP/PS1 마우스 모델에서, 저희는 Aβ 플라크, 활성화된 미세아교세포, 비활성화된 미세아교세포, 그리고 Aβ 플라크와 비대성 및 비비대성 성상교세포 사이의 공간적, 시간적 관계를 입증했습니다. 또한 저희는 APP/PS1/hTau 병리학 및 AAV 유도 타우병 모델에서 인산화 타우와 관련하여 강력한 미세아교세포증과 성상교세포증을 관찰했습니다.

타우병에 의한 파킨슨 운동 특징

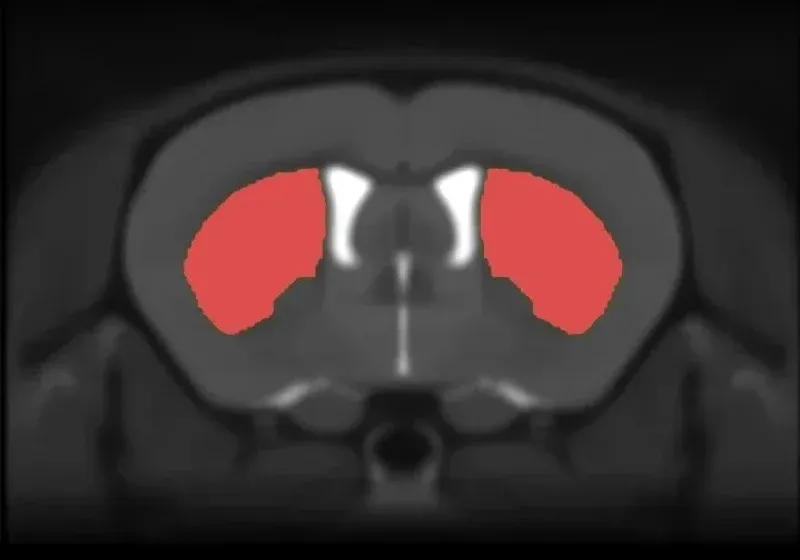
진행성 핵상마비 및 피질-기저변성은 순수한 타우병으로, 다른 임상 증상들 중에서도 파킨슨병의 특징과 흑질(substantia nigra)의 심각한 신경세포 손실을 특징으로 합니다(Oyangi, 2001). AAV-hTau 모델에서, 우리는 실질적 운동 기능의 심각한 결핍( 실린더 테스트, 꼬리 서스펜션 스윙 테스트, 로타로드 테스트, 뒷다리 쥐기 테스트에 근거)을 발견했는데, 이는 흑질에 있는 도파민성 신경세포의 퇴행과 그에 따른 선조체의 탈신경의 결과입니다.

MRI 볼륨 선조체

지역성 뇌 위축

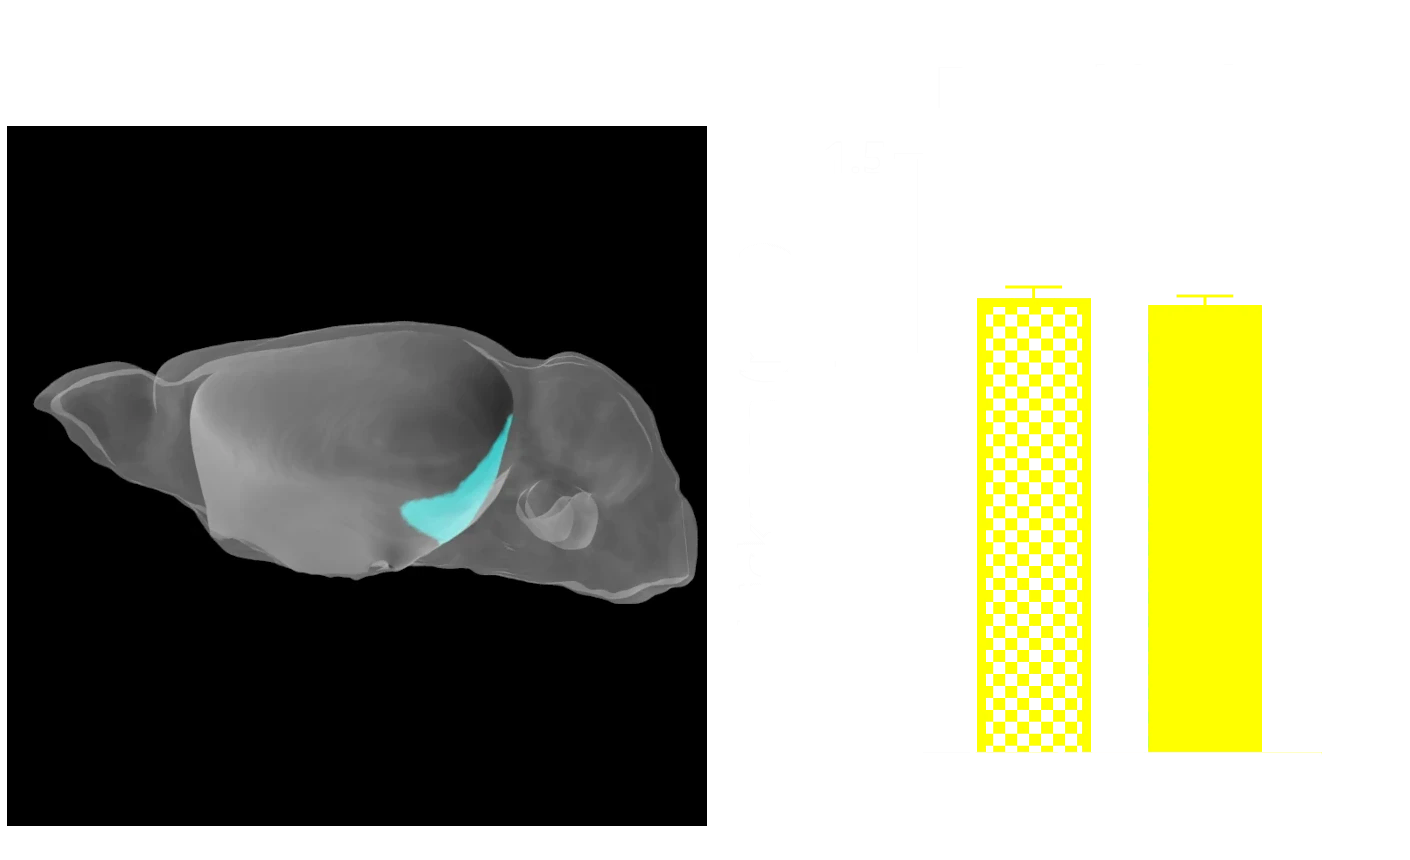
다중 모드 영상 바이오마커는 알츠하이머병과 타우병의 임상 시험에서 널리 사용되고 있습니다. MRI에서 도출된 국소 부피와 피질 두께 측정은 뇌 위축에 매우 민감하며, 알츠하이머병, 진행성 핵상마비, 피질-기저 변성, 전두측두치매에서 시간 경과에 따른 질병 진행을 모니터링할 수 있게 해줍니다. 비침습적 생체 내 전뇌 MRI 획득과 첨단 완전 자동 이미지 처리 및 분석 기술을 결합하여, 타우 병리와 관련된 매우 중요한 뇌 영역 위축을 보여줌으로써 신경 퇴화의 강력한 생체 내 측정 및 번역적 바이오마커로 사용될 수 있음을 입증했습니다.

알츠하이머병 마우스 모델 특징

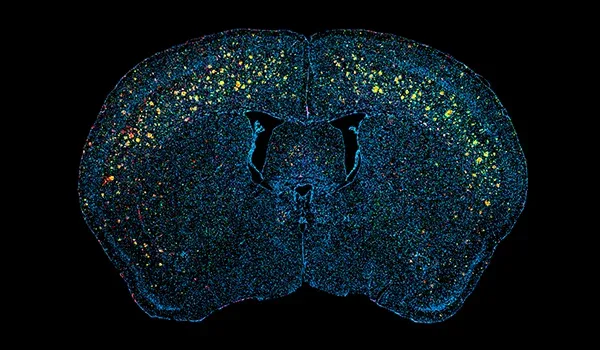
아래의 대화형 프레젠테이션을 통해 생체 내 데이터와 전체 멀티플렉스 면역형광 조직 섹션의 고해상도 이미지를 포함한 아밀로이드-β 및 타우 공동 병리(APP/PS1/hTau) 마우스 모델의 특성 분석을 살펴볼 수 있습니다.

왼쪽 패널을 사용하여 이 "이미지 스토리" 간단하게 탐색할 수 있습니다.

왼쪽 마우스 버튼을 사용하여 고해상도 현미경 이미지를 이동할 있습니다. 마우스/트랙패드(위/아래) 또는 왼쪽 상단 모서리에 있는 + 및 - 버튼 사용하여 확대 축소할 있습니다 . 오른쪽 상단 모서리에 있는 제어판에서 채널 및 세분화에 대한 이미지 설정을 토글(켜기/끄기), 색상 변경 및 조정할 수 있습니다.

최상의 상호작용 경험을 위해 전체 화면 모드를 사용하는 것이 좋습니다.

Characterization of a New Amyloid-β & Tau Co-Pathology Mouse Model of Alzheimer's Disease

1/13

Biospective Preclinical Logo

Alzheimer’s disease (AD) is pathologically defined by the presence of amyloid-β plaques and tau neurofibrillary tangles. While a broad range of animal models of AD exist, these models typically demonstrate amyloid-β or tau pathology, but not both. As such, there is a need for a “co-pathology” model which better recapitulates human disease and demonstrates features that can be measured using “translational biomarkers”.

Our group has developed an adeno-associated virus (AAV) vector-induced mouse model of tauopathies with Parkinsonian features (e.g. Progressive Supranuclear Palsy, Corticobasal Degeneration). We have adapted this modeling strategy by injecting AAV-hTau into a transgenic APP/PS1 mouse model to generate a co-pathology model of AD.

This Interactive Presentation illustrates some of the interesting behavioral, neuroimaging, and pathologic features of Biospective's amyloid-β/hTau co-pathology mouse model.

This model was generated by injecting 6 month-old transgenic APP/PS1 (ARTE10) mice with AAV-hTau (wild-type 2N4R human tau) or AAV-null (control) vectors bilaterally into the anterior insula and the lateral entorhinal cortex using a digital stereotaxic device with an automated microinjector.

Atlas Views with AAV Injection Sites

Atlas Views of Cortical Injection Sites of AAV-Tau vectors

Multiplex immunofluorescence (mIF) images were generated by immunostaining for amyloid-β (fibrillar), phospho-tau (AT8), GFAP, Iba-1, and counterstained with the DAPI nuclear stain. Tissue sections were digitized using a high-throughput slide scanner and were processed using Biospective's PERMITSTM software platform.

To navigate though this Image Story, you can use the arrows and/or the Table of Contents icon in the upper right corner of this panel.

Navigation Panel with Tooltips

You can also interact with the microscopy image in the viewer on the right at any time to further explore this high-resolution data.

Overview of the APP/PS1 (ARTE10) Transgenic Mouse Model

ARTE10 [C57BL/6NTac.CBA-Tg(Thy1-PSEN1*M146V,-APP*Swe)10Arte] (APP/PS1) homozygous mice (Willuweit, 2009), generated on a C57BL/6NTac background, are a transgenic line incorporating the Swedish mutation of human amyloid precursor protein (APPsw) and the M146V mutation in human Presenilin 1 (PS1M146V). These mice express high levels of human amyloid-beta (Aβ) peptides via amyloidogenic processing of APP, and develop Alzheimer's disease-like amyloid pathology. This transgenic mouse model has been used for non-invasive imaging of amyloid-β plaques with Amyloid PET imaging tracers (Willuweit, 2021).

Multiplex Immunofluorescence Brain Images from ARTE10 Mice

Representative coronal brain tissue sections showing the spatiotemporal progression of amyloid-β pathology in APP/PS1 (ARTE10) mice.

Plots Showing the Progression of Amyloid-Beta Pathology in ARTE10 Mice

Quantitative analysis of the age-dependent increase in the density of amyloid-β plaques in the cerebral cortex of APP/PS1 (ARTE10) mice. *p<0.05, **p<0.01, ***p<0.001, ****p<0.0001

Our team at Biospective has also characterized the neuroinflammatory microenvironment around plaques in this model, as well as examined both microglia morphology and astrocyte morphology.

Examples of Amyloid-Beta Plaque Neighborhoods

Examples of “neighborhoods” of amyloid-β plaques to allow for microenvironment analysis.

Amyloid-β and Phosphorylated Tau in APP/PS1/hTau Mice (Anterior Brain; Low Magnification)

This microscopy image shows amyloid-β (fibrillar) and phospho-tau staining in an entire coronal section (anterior part of the brain) of an APP/PS1/hTau mouse. For reference, an illustration with atlas labels for this approximate brain level is provided below. You can zoom-in to observe the staining at higher magnification.

Coronal Brain Atlas at the Level of the Anterior Olfactory Nucleus

Coronal Mouse Brain Section (Bregma +2.0) with Neuroanatomy Labels

Amyloid-β, pTau, and Neuroinflammation in APP/PS1/hTau Mice (Anterior Brain; High Magnification)

High magnification image showing phosphorylated tau (in neuronal soma and processes), fibrillar amyloid-β (plaques and vascular pathology), microglia, and astrocytes. Note the extensive level of neuroinflammation.

Amyloid-β and Phosphorylated Tau in APP/PS1/hTau Mice (Middle Brain; Low Magnification)

Low magnification image showing phosphorylated tau (in neuronal soma and processes) and fibrillar amyloid-β (plaques and vascular pathology. Note the extensive phosphorylated tau in the piriform cortex. For reference, an illustration with atlas labels for this approximate brain level is provided below.

Coronal Brain Atlas at the Level of the Piriform Cortex

Coronal Mouse Brain Section (Bregma -1.0) with Neuroanatomy Labels

Amyloid-β and Phosphorylated Tau in APP/PS1/hTau Mice (Middle Brain; High Magnification)

High magnification image showing phosphorylated tau (in neuronal soma and processes) and fibrillar amyloid-β (plaques and vascular pathology). Note the extensive level of phosphorylated tau in the piriform cortex.

pTau, Microgliosis, and Astrogliosis in APP/PS1/hTau Mice (Middle Brain; High Magnification)

High magnification image showing phosphorylated tau (in neuronal soma and processes), microglia, and astrocytes. Note the extensive level of neuroinflammation in the piriform cortex.

The plots below show the quantitative analysis of Iba-1 and GFAP stain density in brain regions with amyloid-β and tau pathology.

Regional Iba1 Staining Density Analysis Praphs

Iba-1 stain density for APP/PS1/hTau compared to APP/PS1 (control) mice in Anterior, Piriform, and Entorhinal Cortex regions; mean ± SEM, t-test, *** p<0.001

Regional GFAP Staining Density Analysis Plots

GFAP stain density for APP/PS1/hTau compared to APP/PS1 (control) mice in Anterior, Piriform, and Entorhinal Cortex regions; mean ± SEM, t-test, *** p<0.001, ****p<0.0001

Amyloid-β and Phosphorylated Tau in APP/PS1/hTau Mice (Posterior Brain; Low Magnification)

Low magnification image showing phosphorylated tau (in neuronal soma and processes) and fibrillar amyloid-β (plaques and vascular pathology). Note the extensive phosphorylated tau in the left entorhinal cortex (the entorhinal cortex in the right hemisphere was not injected in this brain as a control). For reference, an illustration with atlas labels for this approximate brain level is provided below.

Coronal Mouse Brain Section at the Level of the Entorhinal Cortex

Coronal Mouse Brain Section (Bregma -3.2) with Neuroanatomy Labels

Amyloid-β and Phosphorylated Tau in APP/PS1/hTau Mice (Posterior Brain; High Magnification)

High magnification image showing phosphorylated tau (in neuronal soma and processes) and fibrillar amyloid-β (plaques and vascular pathology) in the entorhinal cortex.

Sleep Alterations in APP/PS1/hTau Mice

Sleep is altered in Alzheimer’s disease and has been associated with tau-driven neuropathology. Increased daytime sleep has been observed in later stages of the disease.

We have performed an assessment of sleep-wake cycles in the APP/PS1/hTau model using the non-invasive PiezoSleep system. The plot below shows the increased level of sleep in the dark phase in APP/PS1/hTau mice compared to APP/PS1 mice (corresponding to daytime sleep in humans).

PiezoSleep System Illustration and Plot of Sleep Percentage

Percentage of sleep in the light and dark phases measured by the PiezoSleep system.

Brain Atrophy in the APP/PS1/hTau Model

We have acquired in vivo anatomical MRI data from wild-type (WT), WT/hTau, APP/PS1, and APP/PS1/hTau mice at 4 weeks following injection of AAV-hTau or AAV-null (control) vectors. We generated regional volumes and cortical thickness measures using our fully-automated NIGHTWINGTM image processing platform. The figures below show MRI atlases and quantitative measures in several brain regions.

MRI Atlas and Regional Volumes

Anatomical MRI with segmented regions, and plots of regional volumes assessed in wild-type (hashed), and APP/PS1 (solid), AAV-null and hTau mice. **p<0.01,***p<0.001, ****p<0.0001

MRI Atlas and Regional Thickness

Mouse brain surface rendering with segmented entorhinal cortex, as well as a plot of the regional thickness assessed in wild-type (hashed), and APP/PS1 (solid), AAV-null and hTau mice. *p<0.05, **p<0.01, ***p<0.001, ****p<0.0001

Note that APP/PS1 mice do not show any brain atrophy compared to WT mice. The injection of AAV-hTau induced highly significant reductions of regional volumes and cortical thickness. Interestingly, the APP/PS1/hTau mice appear to have greater brain atrophy compared the the WT/hTau mice, suggesting a potential modulatory role of amyloid-β.

Translation of Mouse MRI Brain Atrophy Data to Human Alzheimer's Disease

Our team at Biospective has performed a rigorous analysis of the relationship between amyloid-β, tau, and cortical thickness in human Alzheimer’s disease. This analysis was performed using Amyloid PET, Tau PET, and 3D Anatomical MRI data from the ADNI study. We have found that tau, rather than amyloid-β, is primarily responsible for cortical thinning, as well as regional cerebral glucose metabolism, which can be appreciated in the figure below.

Statistical Maps Showing the Effect of Tau and Amyloid on Cortical Thickness and Glucose Metabolism

t-Statistic maps (thresholded for statistical significance) demonstrating the effect of tau and amyloid-β on both cortical thickness and cerebral glucose metabolism.

We have further demonstrated that the correlation between tau and cortical thickness is increased as the amyloid-β burden increases, which is apparent in the video below.

Statistical maps showing increased regional correlation between tau and cortical thickness as a function of amyloid-β load.

This human neuroimaging data corresponds well with our mouse MRI data showing that tau is the primary driver of brain atrophy with an apparent increase in the presence of amyloid-β.

Summary

This novel amyloid-β/tau co-pathology mouse model recapitulates several features of Alzheimer’s disease. In terms of the neuropathology, we have observed parenchymal (including diffuse, dense-core, and neuritic plaques) and vascular Aβ aggregates, phosphorylated tau in cell bodies and processes (including dystrophic neurites), microgliosis, and astrogliosis. We plan to further explore the relationships between the misfolded proteins and neuroinflammation in this model.

One of the most interesting observations is the neurodegenerative phenotype in the APP/PS1/hTau mice. The regional brain atrophy observed via structural analysis of the anatomical MRI scans can provide a robust way to evaluate the effects of potential interventions and serve as a translational biomarker given the widespread use of neuroimaging in AD clinical trials.

Based on the quantifiable in-life and post-mortem measures that we have reported, APP/PS1/hTau mice can serve as a useful model for preclinical evaluation of novel disease-modifying therapeutics for Alzheimer’s disease.

Please feel free to further explore the microscopy image in the viewer.

We would be happy to discuss this model and our characterization if you would like to Contact Us.

Table of Contents
Control Panel
Section: Coronal Section 1
Channels

알츠하이머병 및 타우병증 마우스 모델의 특성화, 검증된 측정 방법, 전임상 신경과학 CRO 서비스에 대해 자세히 알아보세요.

자주 묻는 질문

APP/PS1 형질전환 마우스 모델에서 발견되는 주요 병리학적 특징은 무엇입니까?


연령에 맞는 APP/PS1 마우스를 연구에 사용할 수 있습니까?


APP/PS1 마우스를 이용한 연구의 일반적인 기간은 얼마입니까?


알츠하이머병 모델에 활성화된 미세아교세포가 존재합니까?


참고문헌


키워드


관련 콘텐츠

알츠하이머병에 대한 최신 정보와 알츠하이머병 동물 모델에서 치료제 평가와 관련된 모범 사례.

추가 정보

관심 있는 분야를 알려 주세요. 저희 팀이 기꺼이 상담해 드리겠습니다!

이메일([email protected])로 문의하거나 아래 양식을 작성하여 제출하세요. 

이름*
이메일*
전화번호*
소속(회사/대학)*
메시지*

귀하의 개인정보는 당사에 중요합니다. 당사는 개인정보 취급방침에 명시된 대로 귀하의 데이터를 보호합니다.

개인정보 취급방침의 약관에 동의합니다.*

저희는 사이트를 작동시키기 위해 필요한 쿠키를 사용합니다. 또한, 사이트 사용 방식을 측정하거나 마케팅 목적으로 개선을 돕기 위해 다른 쿠키를 사용합니다. 사용자는 모든 쿠키를 허용하거나 거부할 수 있습니다. 저희가 사용하는 쿠키에 대한 자세한 정보는 개인정보 처리방침 참조하십시오.