Characterization of a New Amyloid-β & Tau Co-Pathology Mouse Model of Alzheimer's Disease
アミロイドベータおよびタウの共病理マウスモデル(APP/PS1/hTau)
アルツハイマー病の翻訳型 アミロイド-β および野生型ヒト タウ(2N4R) 共病態モデル:神経変性、脳萎縮、および神経炎症を伴う。
アミロイド-βおよびタウ共病理マウスモデル(APP/PS1/hTau) の概要
このアルツハイマー病モデルでは、 二重トランスジェニックAPP/PS1マウスの中枢神経系に、 AAV-hTau(野生型2N4Rヒトタウ)を過剰発現するAAVを複数回 、 両側ステレオタクティックに接種します 。
このマウスモデルは、ヒトのアルツハイマー病の主要な特徴を再現しています。具体的には:
- アミロイドβ斑
- 細胞体と神経突起に蓄積したリン酸化タウの凝集体
- 活性化ミクログリア
- 反応性アストロサイト
- 睡眠障害
- 生体MRI検査で測定された局所的な脳萎縮(体積および皮質厚)
アミロイド-β およびタウ共病理マウスモデル(APP/PS1/hTau)の生成
モデル生成の一般的な概要は次のとおりです:
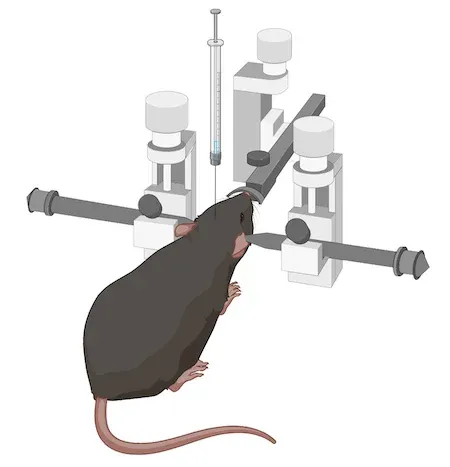
この特定のモデルでは、通常、生後約6か月のAPP/PS1マウスを使用します(ただし、より若いまたはより年老いたマウスを使用することも可能です)。その後、疾患に関連する複数の脳領域にAAVベクターのステレオタクティック注射を行います。高精度と高精度を実現するため、自動マイクロインジェクターを備えたデジタルステレオタクティックデバイスを使用します。
研究のin vivoフェーズは 通常4~12週間続きます。生体内の評価指標(MRIによる脳萎縮など)は、4週間目から有意な効果を示します。そのため、評価指標の生成は比較的短期間で提供可能です。特に、従来のアルツハイマー病およびタウ病変のタウ転移モデルと比較して、その利点が顕著です。
当社の検証済み測定方法
- MRIによる脳萎縮の評価
- 睡眠・覚醒構造の評価
- 免疫組織化学(IHC)および多重免疫蛍光法
- ミクログリアとアストロサイトの形態解析
- 神経炎症性マイクロ環境解析
1/5
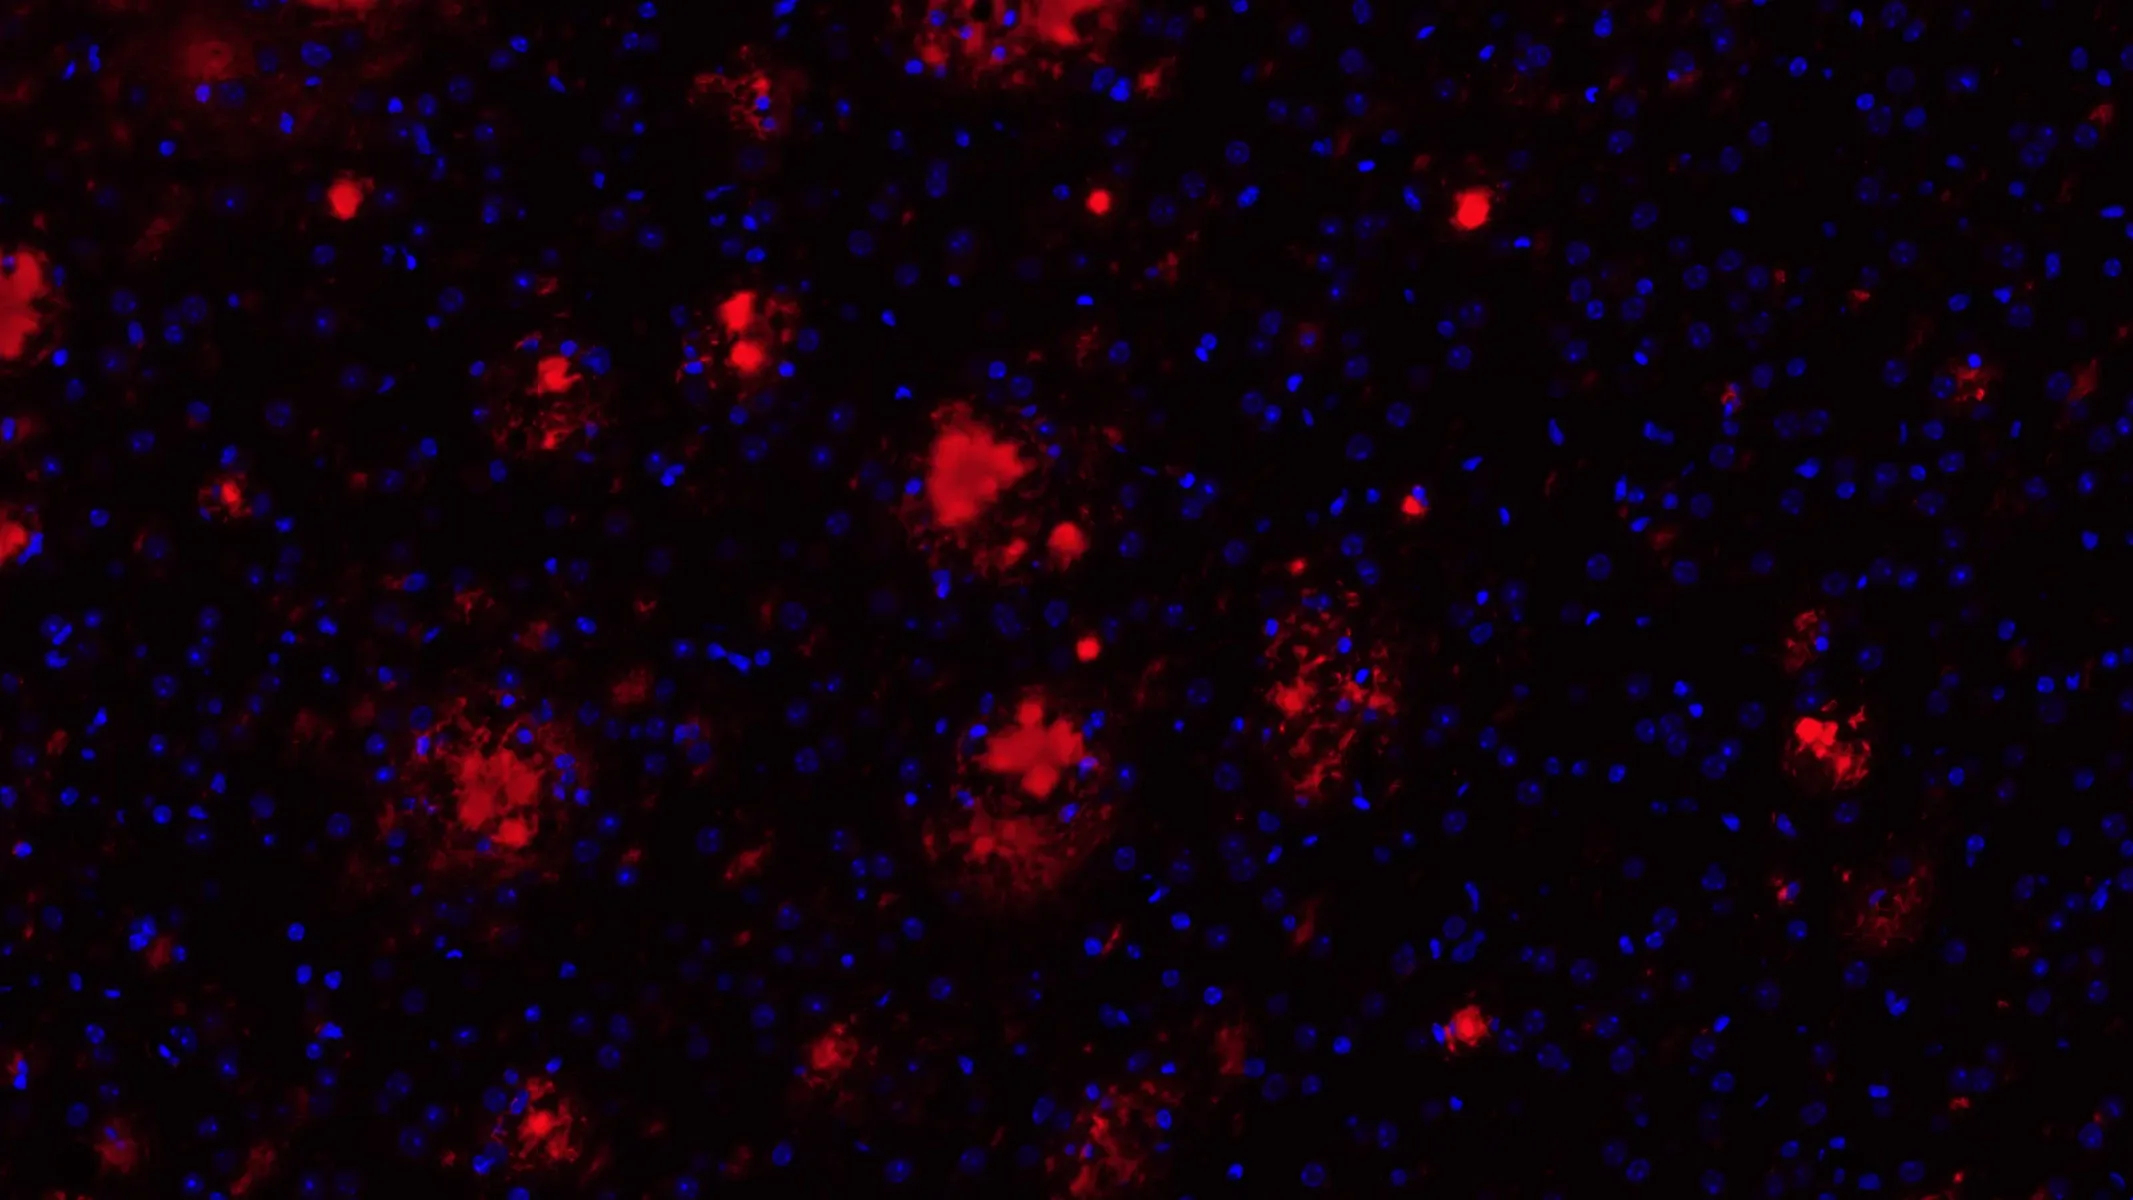
APP/PS1/hTau 共同病理モデルにおけるアミロイド-β斑
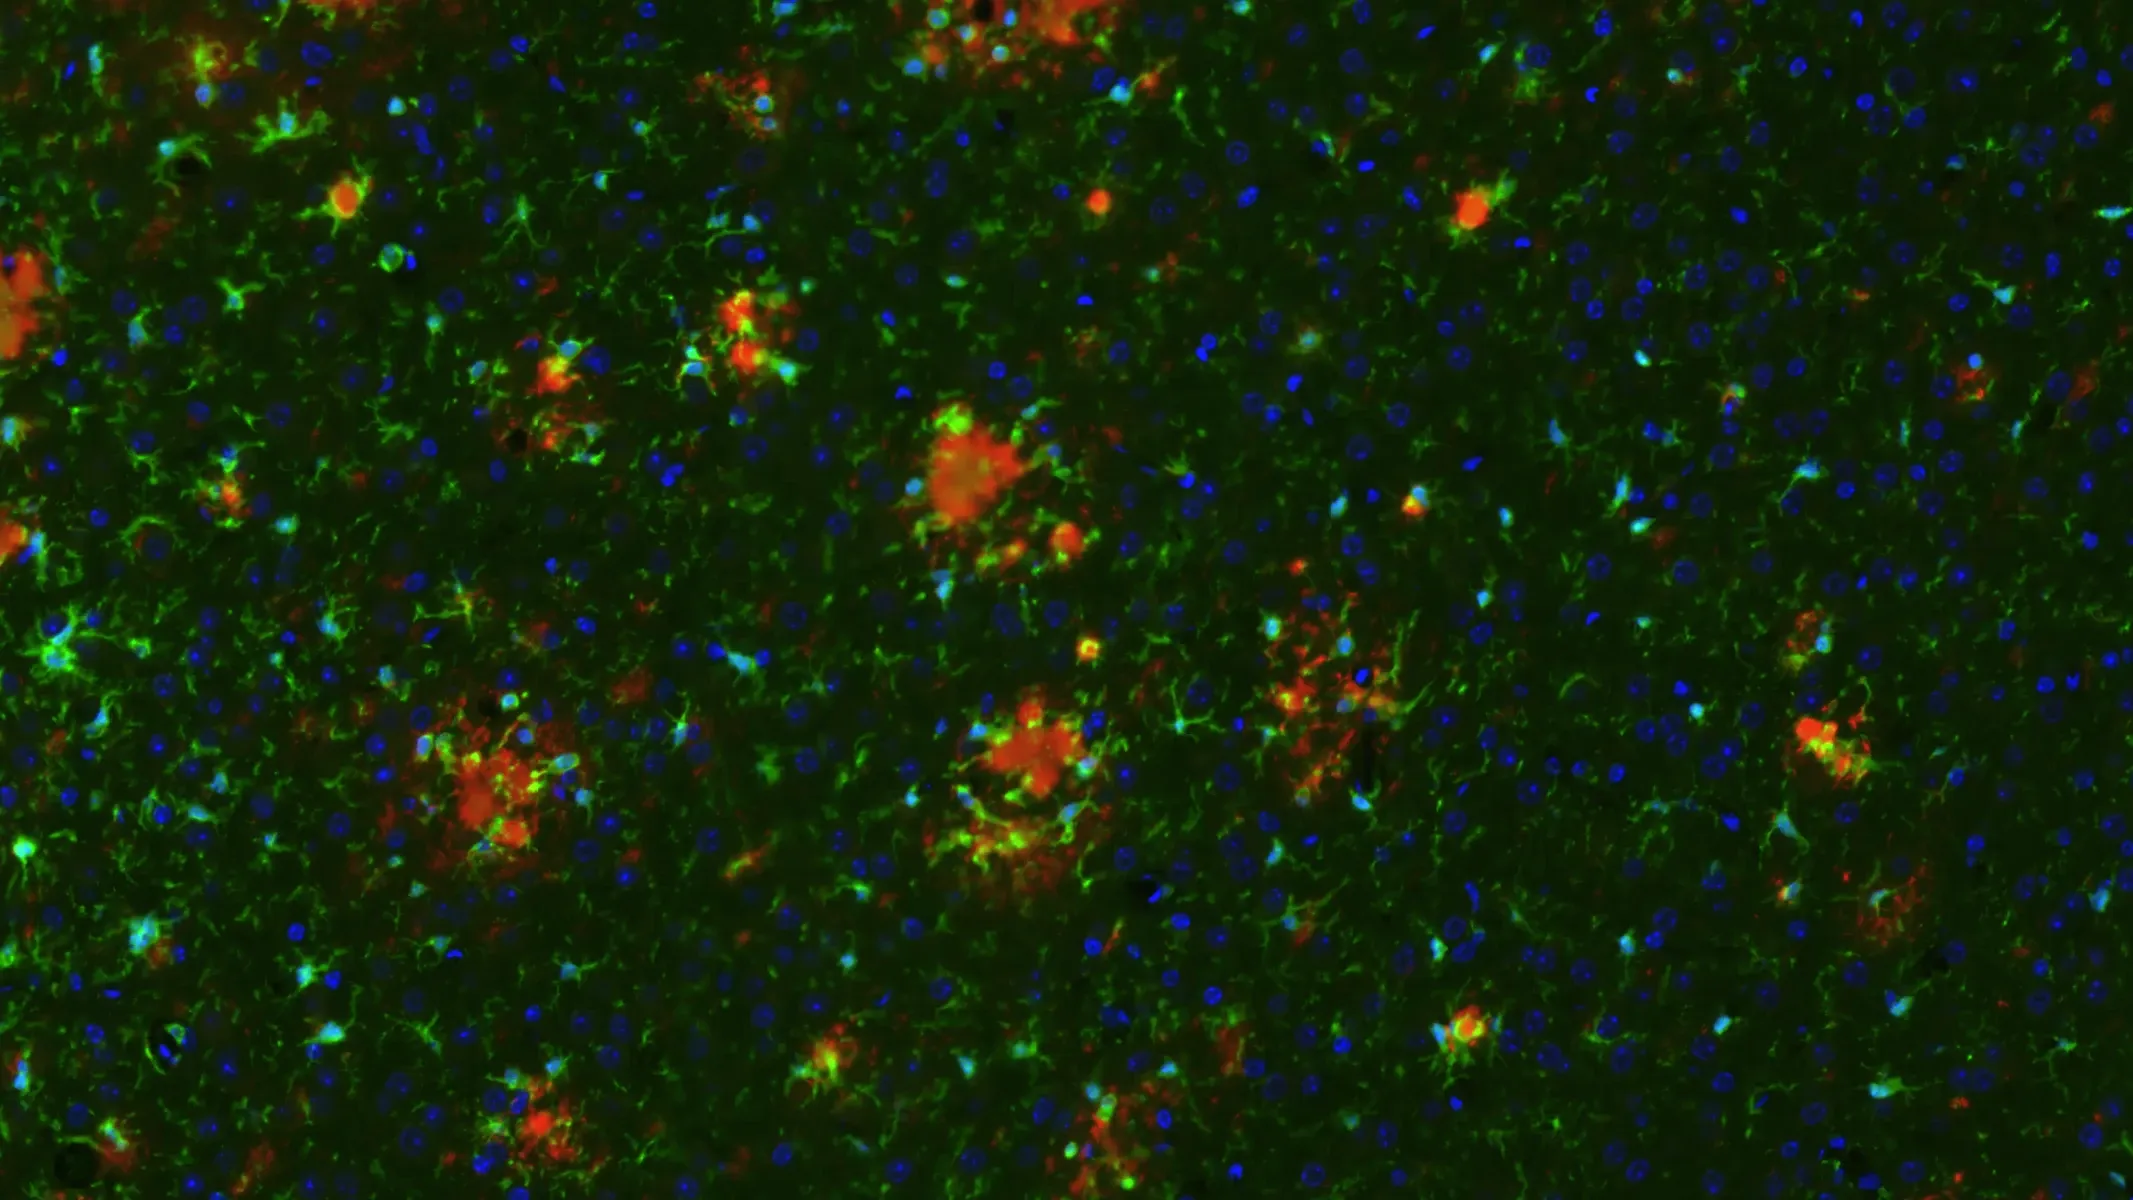
APP/PS1/hTau 共同病態モデルにおけるアミロイド-β斑およびミクログリア
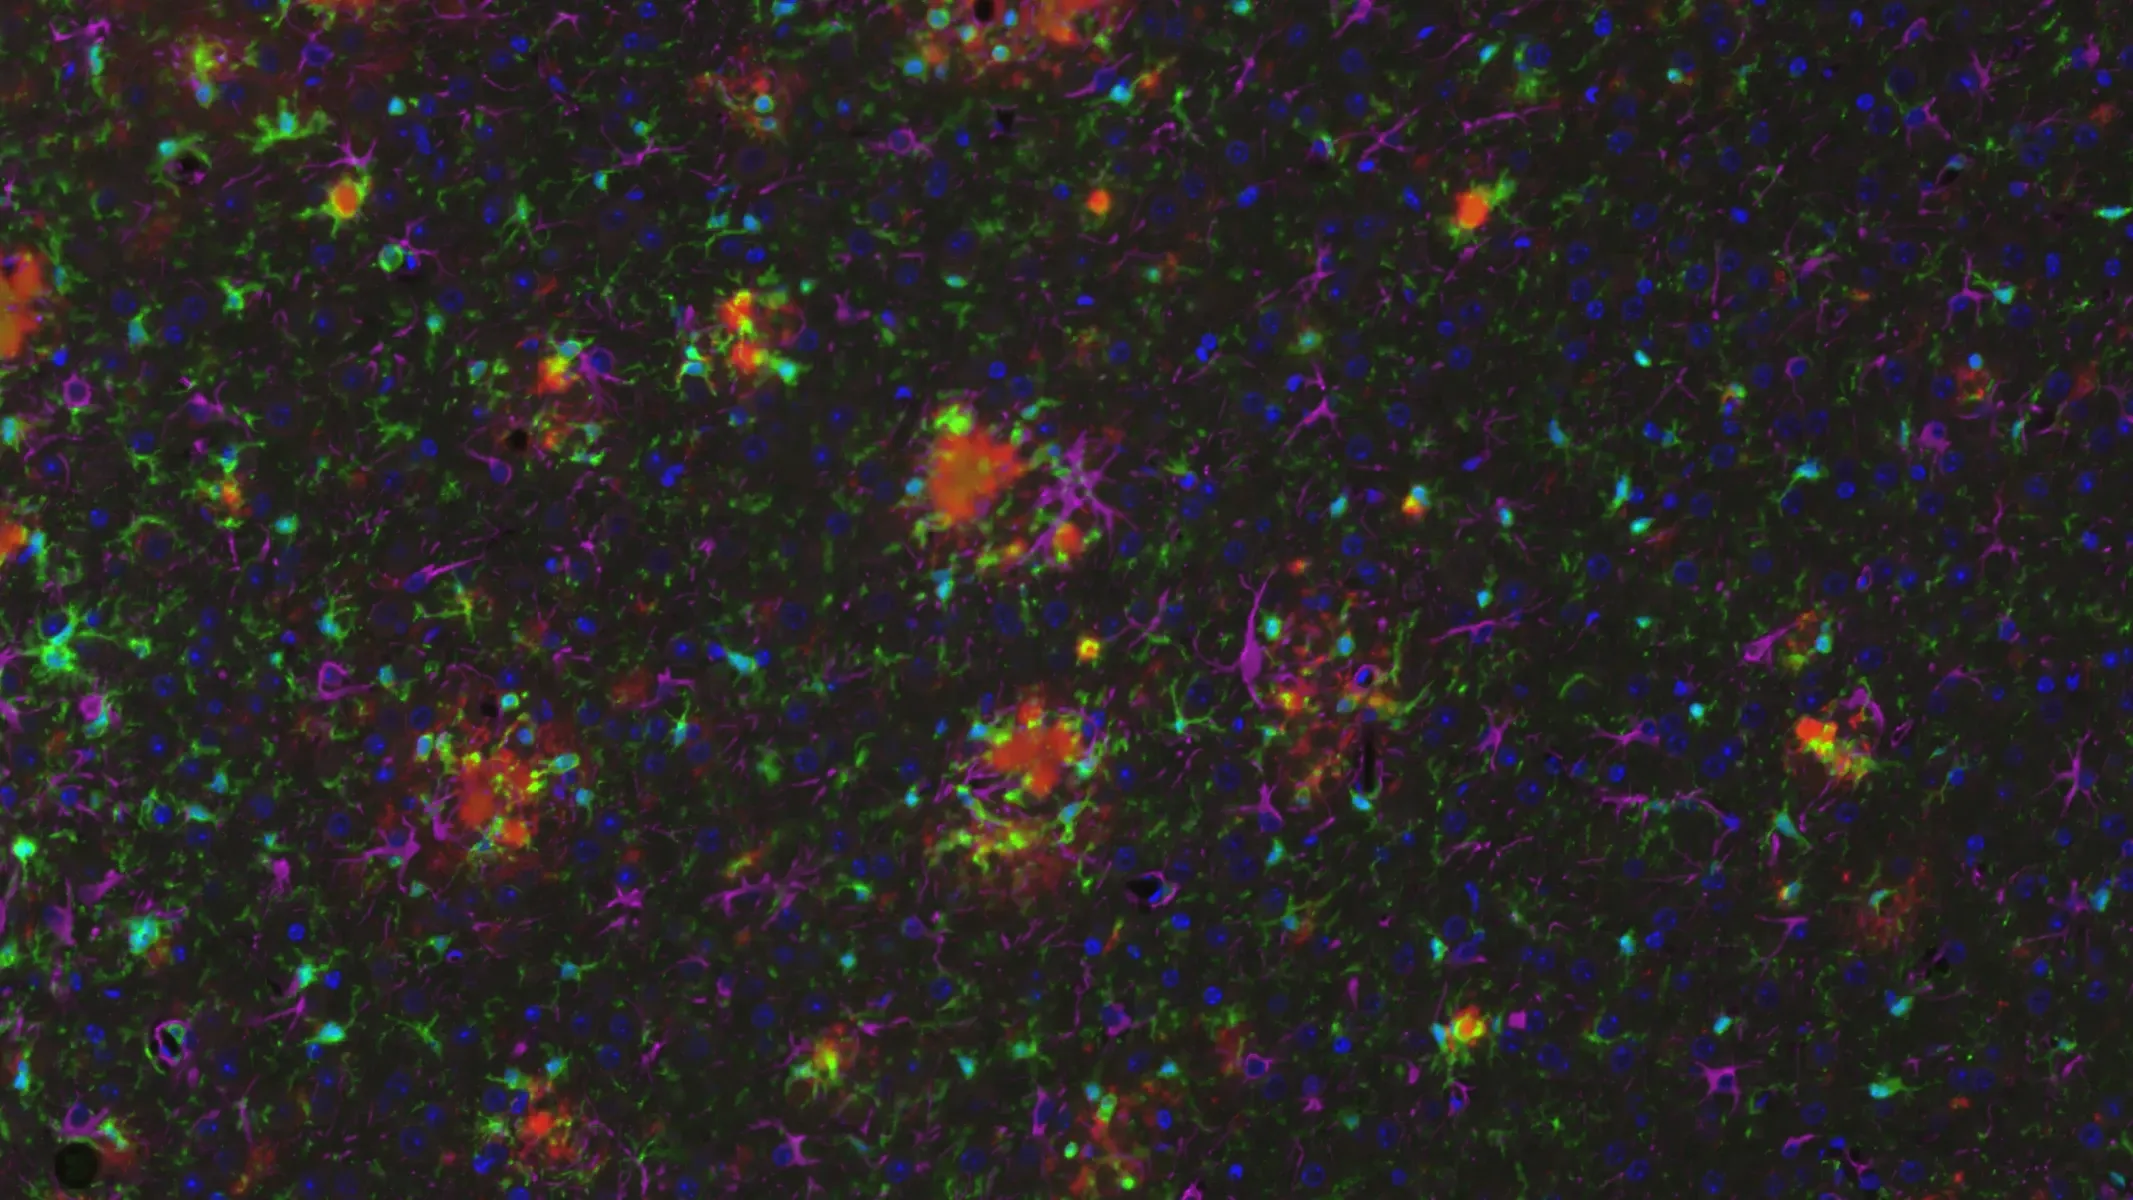
APP/PS1/hTau 共同病理モデルにおけるアミロイド-β斑、ミクログリアおよびアストロサイト
APP/PS1/hTau共病態マウス海馬における多重IF
APP/PS1/hTau 共同病態モデルにおけるアミロイド-β斑およびタウ凝集体
モデル特性評価
Email
リンクをコピーするにはクリックしてください
以下のインタラクティブプレゼンテーションでは、当社のアミロイド-βとヒトタウの共病態(APP/PS1/hTau)マウスモデルの特徴を、in vivoデータやマルチプレックス免疫蛍光組織切片の高解像度画像を含めてご確認いただけます。
左側のパネルを使用して、この「イメージストーリー」を簡単に閲覧できます。
左クリックで高解像度顕微鏡画像の周囲を移動できます。マウス/トラックパッド(上下)または画面左上隅の「+」と「-」ボタンでズームイン/ズームアウト が可能です。画面右上隅のコントロールパネルで 、チャンネルとセグメンテーションの表示/非表示、色変更、画像設定の調整を行うことができます。
最高のインタラクティブ体験 のためには、フルスクリーンモード の使用をお勧めいたします。
1/12

Alzheimer’s disease (AD) is pathologically defined by the presence of amyloid-β plaques and tau neurofibrillary tangles. While a broad range of animal models of AD exist, these models typically demonstrate amyloid-β or tau pathology, but not both. As such, there is a need for a “co-pathology” model which better recapitulates human disease and demonstrates features that can be measured using “translational biomarkers”.
Our group has developed an adeno-associated virus (AAV) vector-induced mouse model of tauopathies with Parkinsonian features (e.g. Progressive Supranuclear Palsy, Corticobasal Degeneration). We have adapted this modeling strategy by injecting AAV-hTau into a transgenic APP/PS1 mouse model to generate a co-pathology model of AD.
This Interactive Presentation illustrates some of the interesting behavioral, neuroimaging, and pathologic features of Biospective's amyloid-β/hTau co-pathology mouse model.
This model was generated by injecting 6 month-old transgenic APP/PS1 (ARTE10) mice with AAV-hTau (wild-type 2N4R human tau) or AAV-null (control) vectors bilaterally into the anterior insula and the lateral entorhinal cortex using a digital stereotaxic device with an automated microinjector.

Atlas Views of Cortical Injection Sites of AAV-Tau vectors
Multiplex immunofluorescence (mIF) images were generated by immunostaining for amyloid-β (fibrillar), phospho-tau (AT8), conformationally altered tau (MC1), oligomeric tau (T22), GFAP, Iba-1, and counterstained with the DAPI nuclear stain. Tissue sections were digitized using a high-throughput slide scanner and were processed using Biospective's PERMITSTM software platform.
To navigate though this Image Story, you can use the arrows and/or the Table of Contents icon in the upper right corner of this panel.

You can also interact with the microscopy image in the viewer on the right at any time to further explore this high-resolution data.
Overview of the APP/PS1 (ARTE10) Transgenic Mouse Model
ARTE10 [C57BL/6NTac.CBA-Tg(Thy1-PSEN1*M146V,-APP*Swe)10Arte] (APP/PS1) homozygous mice (Willuweit, 2009), generated on a C57BL/6NTac background, are a transgenic line incorporating the Swedish mutation of human amyloid precursor protein (APPsw) and the M146V mutation in human Presenilin 1 (PS1M146V). These mice express high levels of human amyloid-beta (Aβ) peptides via amyloidogenic processing of APP, and develop Alzheimer's disease-like amyloid pathology. This transgenic mouse model has been used for non-invasive imaging of amyloid-β plaques with Amyloid PET imaging tracers (Willuweit, 2021).

Representative coronal brain tissue sections showing the spatiotemporal progression of amyloid-β pathology in APP/PS1 (ARTE10) mice.

Quantitative analysis of the age-dependent increase in the density of amyloid-β plaques in the cerebral cortex of APP/PS1 (ARTE10) mice. *p<0.05, **p<0.01, ***p<0.001, ****p<0.0001
Our team at Biospective has also characterized the neuroinflammatory microenvironment around plaques in this model, as well as examined both microglia morphology and astrocyte morphology.

Examples of “neighborhoods” of amyloid-β plaques to allow for microenvironment analysis.
Amyloid-β and Phosphorylated Tau in APP/PS1/hTau Mice (Middle Brain; Low Magnification)
Low magnification image showing phosphorylated tau (in neuronal soma and processes) and fibrillar amyloid-β (plaques and vascular pathology). Note the extensive phosphorylated tau in the piriform cortex. For reference, an illustration with atlas labels for this approximate brain level is provided below.

Coronal Mouse Brain Section (Bregma -1.0) with Neuroanatomy Labels
Amyloid-β and Phosphorylated Tau in APP/PS1/hTau Mice (Middle Brain; High Magnification)
High magnification image showing phosphorylated tau (in neuronal soma and processes) and fibrillar amyloid-β (plaques and vascular pathology). Note the extensive level of phosphorylated tau in the piriform cortex. Similar pathology is also observed in the anterior cortex (not shown).
Pathological Tau Accumulation in APP/PS1/hTau Mice (Middle Brain; Low Magnification)
Low magnification image showing MC1 and T22 immunostaining reveals the distribution of tau pathology across distinct brain regions. Accumulation of conformationally altered tau (MC1) and oligomeric tau (T22) was observed in the cell soma and neurites in various brain regions of AAV-Tau-injected mice, both at the injection site and in connected distal areas.
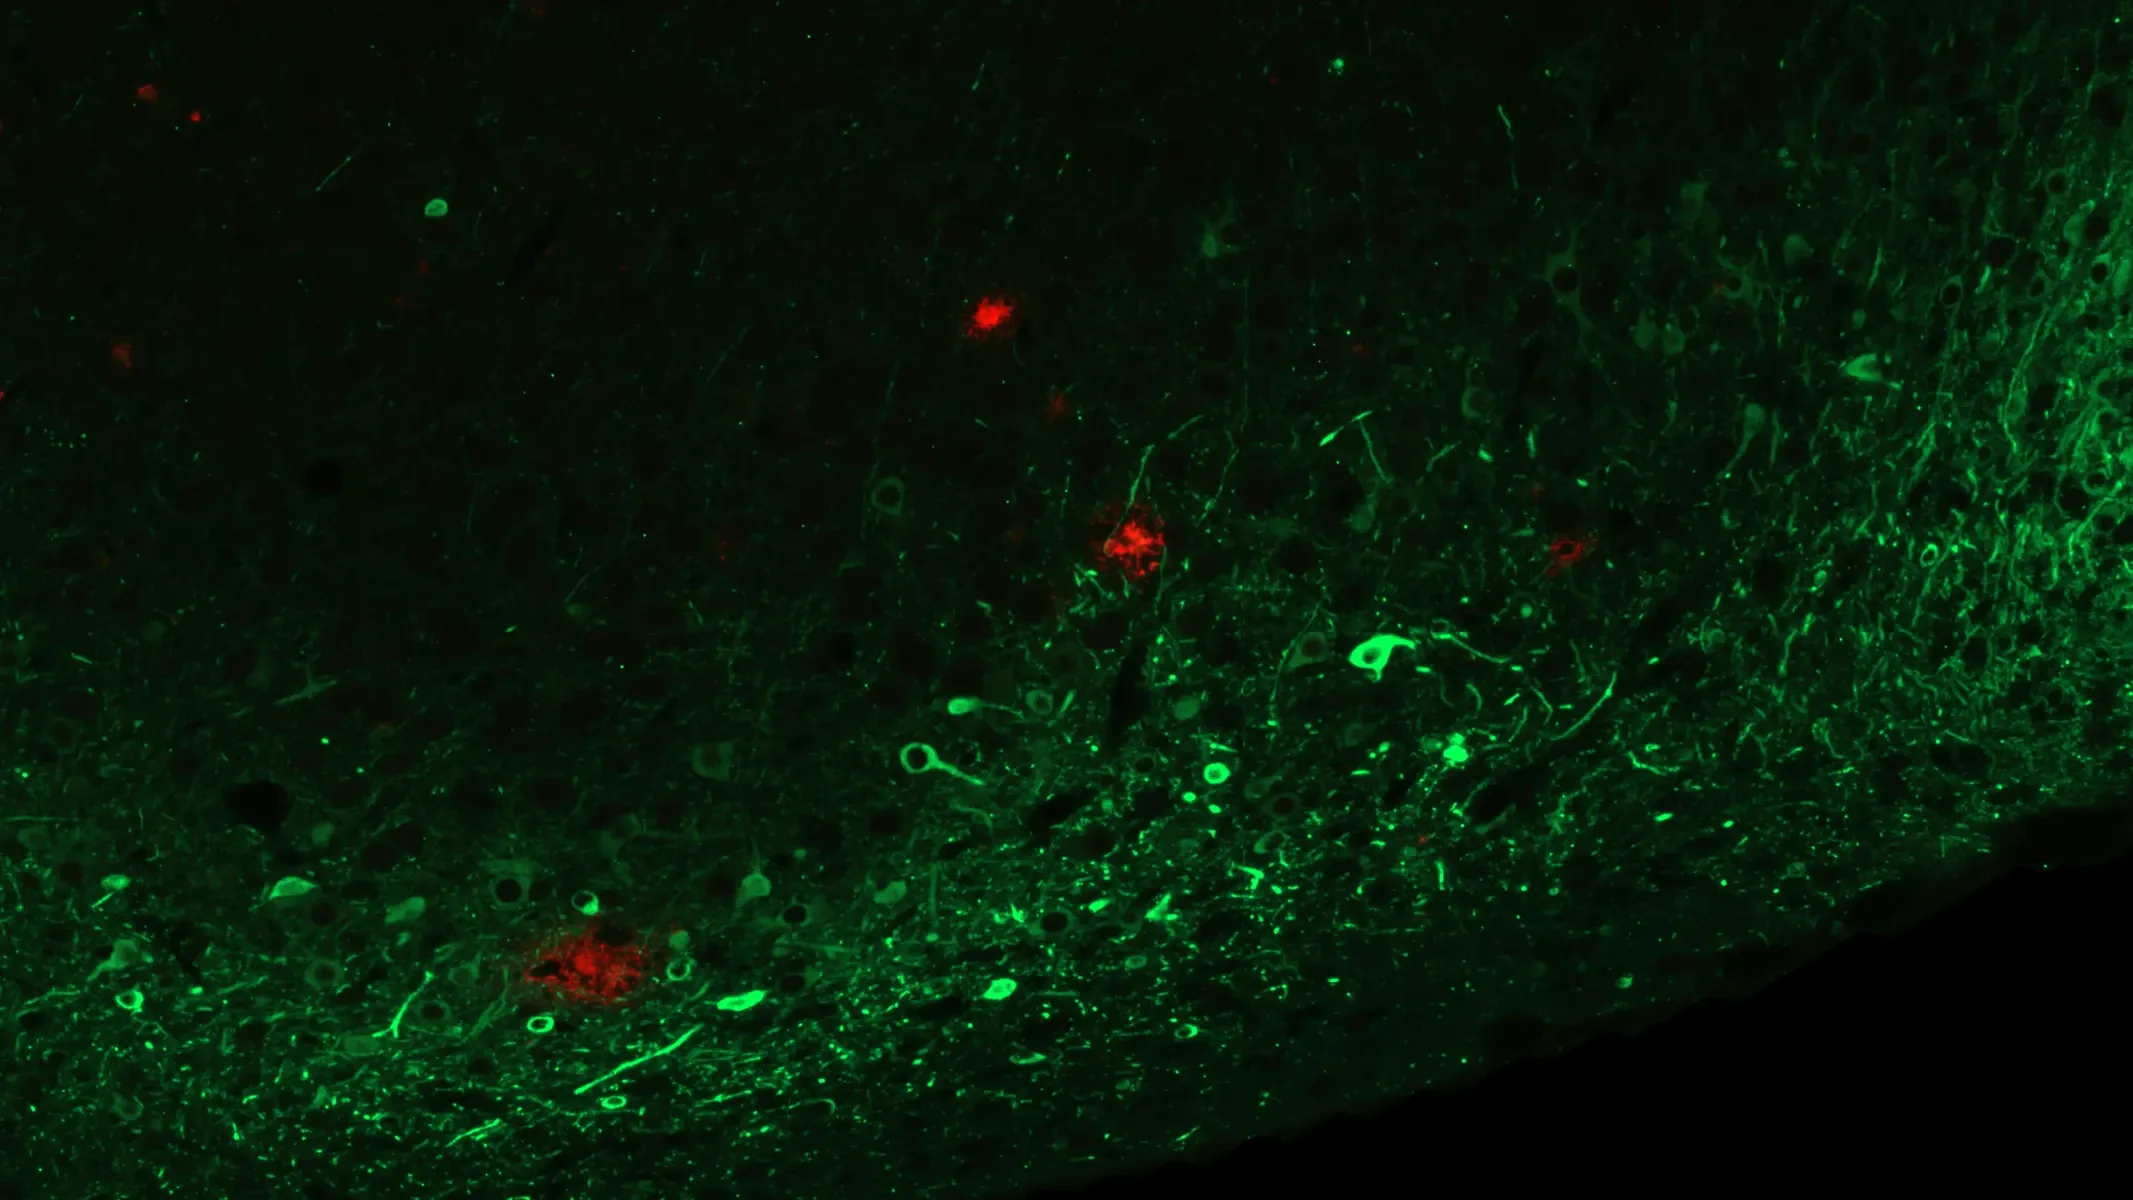
MC1-Positive Misfolded Tau in Piriform Cortex of APP/PS1/hTau Mice (Middle Brain; High Magnification)
High magnification image of the piriform cortex stained with MC1 antibody. Prominent accumulation of misfolded tau indicates early pathological changes. Similar staining was observed at the level of the anterior insula and the lateral entorhinal cortex.
Tau Oligomer Accumulation in Piriform Cortex (T22) of APP/PS1/hTau Mice (Middle Brain; High Magnification)
High magnification image of T22 staining in the piriform cortex reveals accumulation of tau oligomers. Similar staining was observed at the level of the anterior insula and the lateral entorhinal cortex.
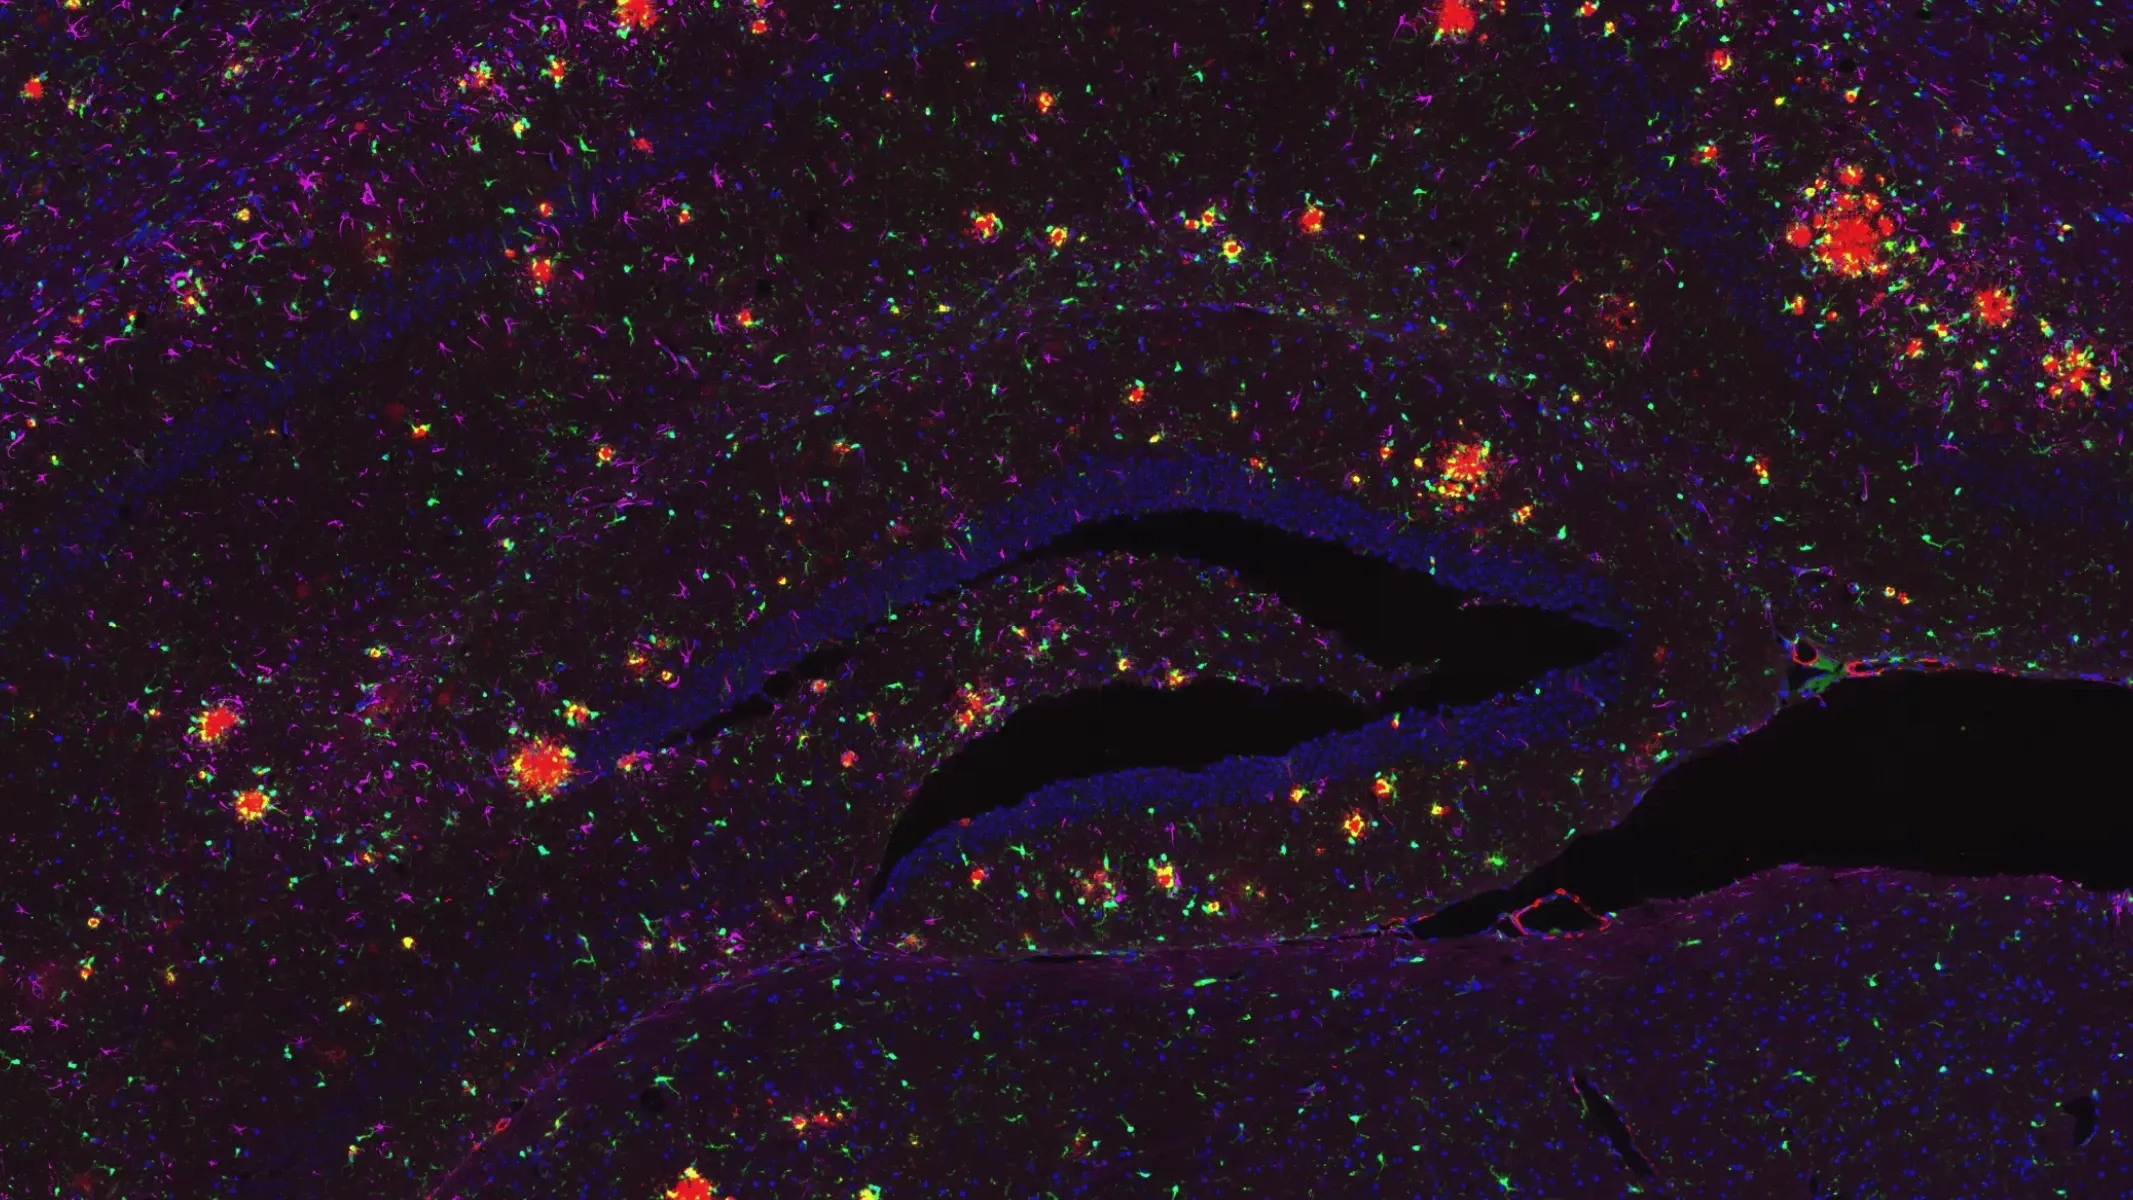
pTau, Microgliosis, and Astrogliosis in APP/PS1/hTau Mice (Middle Brain; High Magnification)
High magnification image showing phosphorylated tau (in neuronal soma and processes), microglia, and astrocytes. Note the extensive level of neuroinflammation in the piriform cortex.
The plots below show the quantitative analysis of Iba-1 and GFAP stain density in brain regions with amyloid-β and tau pathology.

Iba-1 stain density for APP/PS1/hTau compared to APP/PS1 (control) mice in Anterior, Piriform, and Entorhinal Cortex regions; mean ± SEM, t-test, *** p<0.001

GFAP stain density for APP/PS1/hTau compared to APP/PS1 (control) mice in Anterior, Piriform, and Entorhinal Cortex regions; mean ± SEM, t-test, *** p<0.001, ****p<0.0001
Sleep Alterations in APP/PS1/hTau Mice
Sleep is altered in Alzheimer’s disease and has been associated with tau-driven neuropathology. Increased daytime sleep has been observed in later stages of the disease.
We have performed an assessment of sleep-wake cycles in the APP/PS1/hTau model using the non-invasive PiezoSleep system. The plot below shows the increased level of sleep in the dark phase in APP/PS1/hTau mice compared to APP/PS1 mice (corresponding to daytime sleep in humans).

Percentage of sleep in the light and dark phases measured by the PiezoSleep system.
Brain Atrophy in the APP/PS1/hTau Model
We have acquired in vivo anatomical MRI data from wild-type (WT), WT/hTau, APP/PS1, and APP/PS1/hTau mice at 4 weeks following injection of AAV-hTau or AAV-null (control) vectors. We generated regional volumes and cortical thickness measures using our fully-automated NIGHTWINGTM image processing platform. The figures below show MRI atlases and quantitative measures in several brain regions.

Anatomical MRI with segmented regions, and plots of regional volumes assessed in wild-type (hashed), and APP/PS1 (solid), AAV-null and hTau mice. **p<0.01,***p<0.001, ****p<0.0001

Mouse brain surface rendering with segmented entorhinal cortex, as well as a plot of the regional thickness assessed in wild-type (hashed), and APP/PS1 (solid), AAV-null and hTau mice. *p<0.05, **p<0.01, ***p<0.001, ****p<0.0001
Note that APP/PS1 mice do not show any brain atrophy compared to WT mice. The injection of AAV-hTau induced highly significant reductions of regional volumes and cortical thickness. Interestingly, the APP/PS1/hTau mice appear to have greater brain atrophy compared the the WT/hTau mice, suggesting a potential modulatory role of amyloid-β.
Translation of Mouse MRI Brain Atrophy Data to Human Alzheimer's Disease
Our team at Biospective has performed a rigorous analysis of the relationship between amyloid-β, tau, and cortical thickness in human Alzheimer’s disease. This analysis was performed using Amyloid PET, Tau PET, and 3D Anatomical MRI data from the ADNI study. We have found that tau, rather than amyloid-β, is primarily responsible for cortical thinning, as well as regional cerebral glucose metabolism, which can be appreciated in the figure below.

t-Statistic maps (thresholded for statistical significance) demonstrating the effect of tau and amyloid-β on both cortical thickness and cerebral glucose metabolism.
We have further demonstrated that the correlation between tau and cortical thickness is increased as the amyloid-β burden increases, which is apparent in the video below.
Statistical maps showing increased regional correlation between tau and cortical thickness as a function of amyloid-β load.
This human neuroimaging data corresponds well with our mouse MRI data showing that tau is the primary driver of brain atrophy with an apparent increase in the presence of amyloid-β.
Summary
This novel amyloid-β/tau co-pathology mouse model recapitulates several features of Alzheimer’s disease. In terms of the neuropathology, we have observed parenchymal (including diffuse, dense-core, and neuritic plaques) and vascular Aβ aggregates, phosphorylated tau in cell bodies and processes (including dystrophic neurites), microgliosis, and astrogliosis. We plan to further explore the relationships between the misfolded proteins and neuroinflammation in this model.
One of the most interesting observations is the neurodegenerative phenotype in the APP/PS1/hTau mice. The regional brain atrophy observed via structural analysis of the anatomical MRI scans can provide a robust way to evaluate the effects of potential interventions and serve as a translational biomarker given the widespread use of neuroimaging in AD clinical trials.
Based on the quantifiable in-life and post-mortem measures that we have reported, APP/PS1/hTau mice can serve as a useful model for preclinical evaluation of novel disease-modifying therapeutics for Alzheimer’s disease.
Please feel free to further explore the microscopy image in the viewer.
We would be happy to discuss this model and our characterization if you would like to Contact Us.
Table of Contents
Control Panel
Section: Coronal Section 1
0
1
2
3
4
Channels
Share link to
APP/PS1/hTau モデルに関する当社の特性評価、検証済みの測定方法、および前臨床神経科学 CRO サービスについて詳しくご説明いたします。
アルツハイマー病およびタウオパチーのモデルについてさらに詳しく
よくある質問
このアミロイド-βおよびタウの共病態モデルにおいて 、病態が進行する につれて観察される 生理学的変化はありますか ?
はい。 非侵襲的な PiezoSleepシステム を用いたAPP/PS1/hTauモデル における睡眠構造の分析では、APP/PS1マウスと比較して APP/PS1/hTauマウス において暗期における睡眠時間が増加していることが示され、これは ヒトの 昼間の 睡眠に対応しています 。特に、睡眠障害はアルツハイマー病の進行と関連しており、 タウタンパク質による神経病理と関連していることが示されています。日中の睡眠時間の増加は 、病気の進行後期において特に 顕著です 。
このモデルは 、 人間のアルツハイマー病にも適用できますか?
はい。 MRI に基づく脳萎縮の定量化と PET によるグルコース代謝の評価は、動物実験とヒトの臨床試験を結びつける貴重なトランスレーショナルバイオマーカーを提供します。Biospective は、アルツハイマー病および進行性核上性麻痺、皮質基底核変性症、前頭側頭型認知症などの他の神経変性疾患における MRI と PET の評価のためのパイプラインを開発しています 。
当社は、MRIとPETバイオマーカーの活用に関する複数のリソースとイノベーションプレゼンテーションを公表しています。具体的には 以下の通りです:
- タウ関連萎縮はβアミロイドおよびAPOEε4に依存しない(イノベーションプレゼンテーション )
- MCIにおける脳のグルコース代謝の 低下 はタウによって駆動される(イノベーションプレゼンテーション)
- MCIおよびアルツハイマー病におけるタウPETの縦断 的 変化(リソース)
- 進行性上核性麻痺のイメージ ング バイオマーカー(リソース)
- 皮質基底核変性症と他のタウ病変を区別するための 画像 バイオマーカー(リソース)
- 前頭側頭型認知症と臨床試験における神経画像 診断 (リソース)
- 進行性上核麻痺臨床試験における疾患進行のMRI測定(イノベーションプレゼンテーション )
- MRI と 皮質基底核変性症(イノベーションプレゼンテーション)
- 前頭側頭型認知症(FTD)とMRI脳萎縮(イノベーションプレゼンテーション)
- 拡散MRIと前頭側頭型認知症(FTD)(イノベーションプレゼンテーション)
タウとβアミロイド が脳萎縮に及ぼす 影響について 、研究ではどのようなことが明らかになっていますか?
Biospectiveの調査結果によると、タウ病理は、APOE ε4の有無にかかわらず、βアミロイドよりも脳萎縮とグルコース代謝の低下とより密接に関連しています。これらの知見は、タウに焦点を当てた神経変性疾患の解釈を支持しています。当社は最近、Alzheimer's & Dementia誌に論文を発表しました :
このテーマに関するイノベーションプレゼンテーションも発表しています :
関連コンテンツ
アルツハイマー病およびタウ病に関する最新情報、ならびに動物モデルにおける治療薬の評価におけるトランスレーショナルバイオマーカーの使用に関するベストプラクティス。
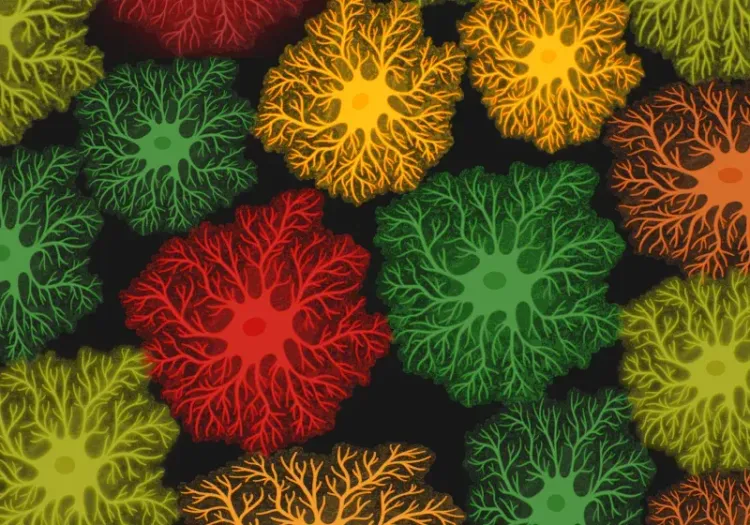
アルツハイマー病におけるアストロサイトの形態
アストロサイトの形態解析の概要と、神経変性疾患の研究および創薬・薬剤開発への応用。