Characterization of a New Amyloid-β & Tau Co-Pathology Mouse Model of Alzheimer's Disease
아밀로이드-베타 및 타우 공동 병리 마우스 모델 (APP/PS1/hTau)
알츠하이머 병의번역성 아밀로이드-β 및 야생형 인간 타우 (2N4R) 공병리 모델로, 신경퇴화, 뇌 위축, 및 신경염증을 특징으로 합니다.
아밀로이드-β 및 타우 공병리 마우스 모델 (APP/PS1/hTau) 개요
이 알츠하이머 병 모델을 위해, 우리는 이중 전유전자 APP/PS1 마우스의 뇌 여러 부위에 AAV-hTau (야생형 2N4R 인간 타우)를 과발현하는 AAV를 다중 양측 스테레오택시스 주입을 수행합니다 .
이 마우스 모델은 인간 알츠하이머 병의 주요 특징을 재현합니다:
- 아밀로이드-β 플라크
- 세포체와 신경돌기 내 인산화 타우의 집합체
- 활성화된 미세아교세포
- 반응성 아스트로사이트
- 수면 장애
- 뇌의 지역적 위축 (부피 및 피질 두께)을 체내 MRI 검사로 측정함
아밀로이드-β 및 타우 공병리 마우스 모델 (APP/PS1/hTau) 생성
모델 생성 위한 일반적인 흐름도는 다음과 같습니다:
이 특정 모델에서는 일반적으로 6개월령의 APP/PS1 마우스를 사용합니다(그러나 더 어린 또는 더 나이 많은 마우스도 사용할 수 있습니다). 이후 AAV 벡터를 질병 관련 뇌 부위에 다중 부위 스테레오택시스 주입을 수행합니다. 고정밀도 및 정밀도를 위해 디지털 스테레오택시스 장치와 자동화 마이크로인젝터를 사용합니다.
연구의 in vivo 단계는 일반적으로 4~12주 동안 진행됩니다. MRI 뇌 위축과 같은 in-life 측정 지표는 4주 만에 유의미한 효과를 보여줍니다. 따라서 측정 지표 생성은 상대적으로 짧은 시간 내에 제공될 수 있으며, 특히 알츠하이머 병 및 타우병증의 전통적인 타우 전사체 모델과 비교할 때 더욱 그렇습니다.
우리의 검증된 측정 방법
- MRI 뇌 위축
- 수면-각성 구조 평가
- 면역조직화학(IHC) 및 다중 면역형광법
- 미세아교세포 및 별아교세포 형태 분석
- 신경염증 미세환경 분석
1/5
APP/PS1/hTau 병리학적 모델에서의 아밀로이드-β 플라크
아밀로이드-β 플라크 및 미세아교세포가 존재하는 APP/PS1/hTau 공동 병리 모델
아밀로이드-β 플라크, 미세아교세포 및 별아교세포가 APP/PS1/hTau 공동 병리 모델에서
APP/PS1/hTau 복합 병리 마우스의 해마에서 다중 IF 분석
아밀로이드-β 플라크 및 타우 응집체 APP/PS1/hTau 공동 병리 모델
모델 특성 분석
Email
링크를 복사하려면 클릭하세요
아래의 인터랙티브 프레젠테이션을 통해 우리 연구팀이 개발한 아밀로이드-β 및 인간 타우 공동 병리(APP/PS1/hTau) 마우스 모델의 특성을 탐색할 수 있습니다. 이 모델에는 생체 내 데이터와 전체 멀티플렉스 면역형광 조직 절편의 고해상도 이미지가 포함되어 있습니다.
왼쪽 패널을 사용하여 이 "이미지 스토리" 를 쉽게 탐색할 수 있습니다.
왼쪽 마우스 버튼을 사용하여 고해상도 현미경 이미지를 이동할 수 있습니다. 마우스/트랙패드(위/아래) 또는 상단 좌측 모서리의 + 및 - 버튼을 사용하여 확대/축소가 가능합니다. 상단 우측의 제어 패널에서 채널 및 세분화 설정의 표시/비표시 전환, 색상 변경, 이미지 설정을 조정할 수 있습니다.
최상의 상호작용 경험을 위해 전체 화면 모드를 권장합니다.
1/12

Alzheimer’s disease (AD) is pathologically defined by the presence of amyloid-β plaques and tau neurofibrillary tangles. While a broad range of animal models of AD exist, these models typically demonstrate amyloid-β or tau pathology, but not both. As such, there is a need for a “co-pathology” model which better recapitulates human disease and demonstrates features that can be measured using “translational biomarkers”.
Our group has developed an adeno-associated virus (AAV) vector-induced mouse model of tauopathies with Parkinsonian features (e.g. Progressive Supranuclear Palsy, Corticobasal Degeneration). We have adapted this modeling strategy by injecting AAV-hTau into a transgenic APP/PS1 mouse model to generate a co-pathology model of AD.
This Interactive Presentation illustrates some of the interesting behavioral, neuroimaging, and pathologic features of Biospective's amyloid-β/hTau co-pathology mouse model.
This model was generated by injecting 6 month-old transgenic APP/PS1 (ARTE10) mice with AAV-hTau (wild-type 2N4R human tau) or AAV-null (control) vectors bilaterally into the anterior insula and the lateral entorhinal cortex using a digital stereotaxic device with an automated microinjector.

Atlas Views of Cortical Injection Sites of AAV-Tau vectors
Multiplex immunofluorescence (mIF) images were generated by immunostaining for amyloid-β (fibrillar), phospho-tau (AT8), conformationally altered tau (MC1), oligomeric tau (T22), GFAP, Iba-1, and counterstained with the DAPI nuclear stain. Tissue sections were digitized using a high-throughput slide scanner and were processed using Biospective's PERMITSTM software platform.
To navigate though this Image Story, you can use the arrows and/or the Table of Contents icon in the upper right corner of this panel.

You can also interact with the microscopy image in the viewer on the right at any time to further explore this high-resolution data.
Overview of the APP/PS1 (ARTE10) Transgenic Mouse Model
ARTE10 [C57BL/6NTac.CBA-Tg(Thy1-PSEN1*M146V,-APP*Swe)10Arte] (APP/PS1) homozygous mice (Willuweit, 2009), generated on a C57BL/6NTac background, are a transgenic line incorporating the Swedish mutation of human amyloid precursor protein (APPsw) and the M146V mutation in human Presenilin 1 (PS1M146V). These mice express high levels of human amyloid-beta (Aβ) peptides via amyloidogenic processing of APP, and develop Alzheimer's disease-like amyloid pathology. This transgenic mouse model has been used for non-invasive imaging of amyloid-β plaques with Amyloid PET imaging tracers (Willuweit, 2021).

Representative coronal brain tissue sections showing the spatiotemporal progression of amyloid-β pathology in APP/PS1 (ARTE10) mice.

Quantitative analysis of the age-dependent increase in the density of amyloid-β plaques in the cerebral cortex of APP/PS1 (ARTE10) mice. *p<0.05, **p<0.01, ***p<0.001, ****p<0.0001
Our team at Biospective has also characterized the neuroinflammatory microenvironment around plaques in this model, as well as examined both microglia morphology and astrocyte morphology.

Examples of “neighborhoods” of amyloid-β plaques to allow for microenvironment analysis.
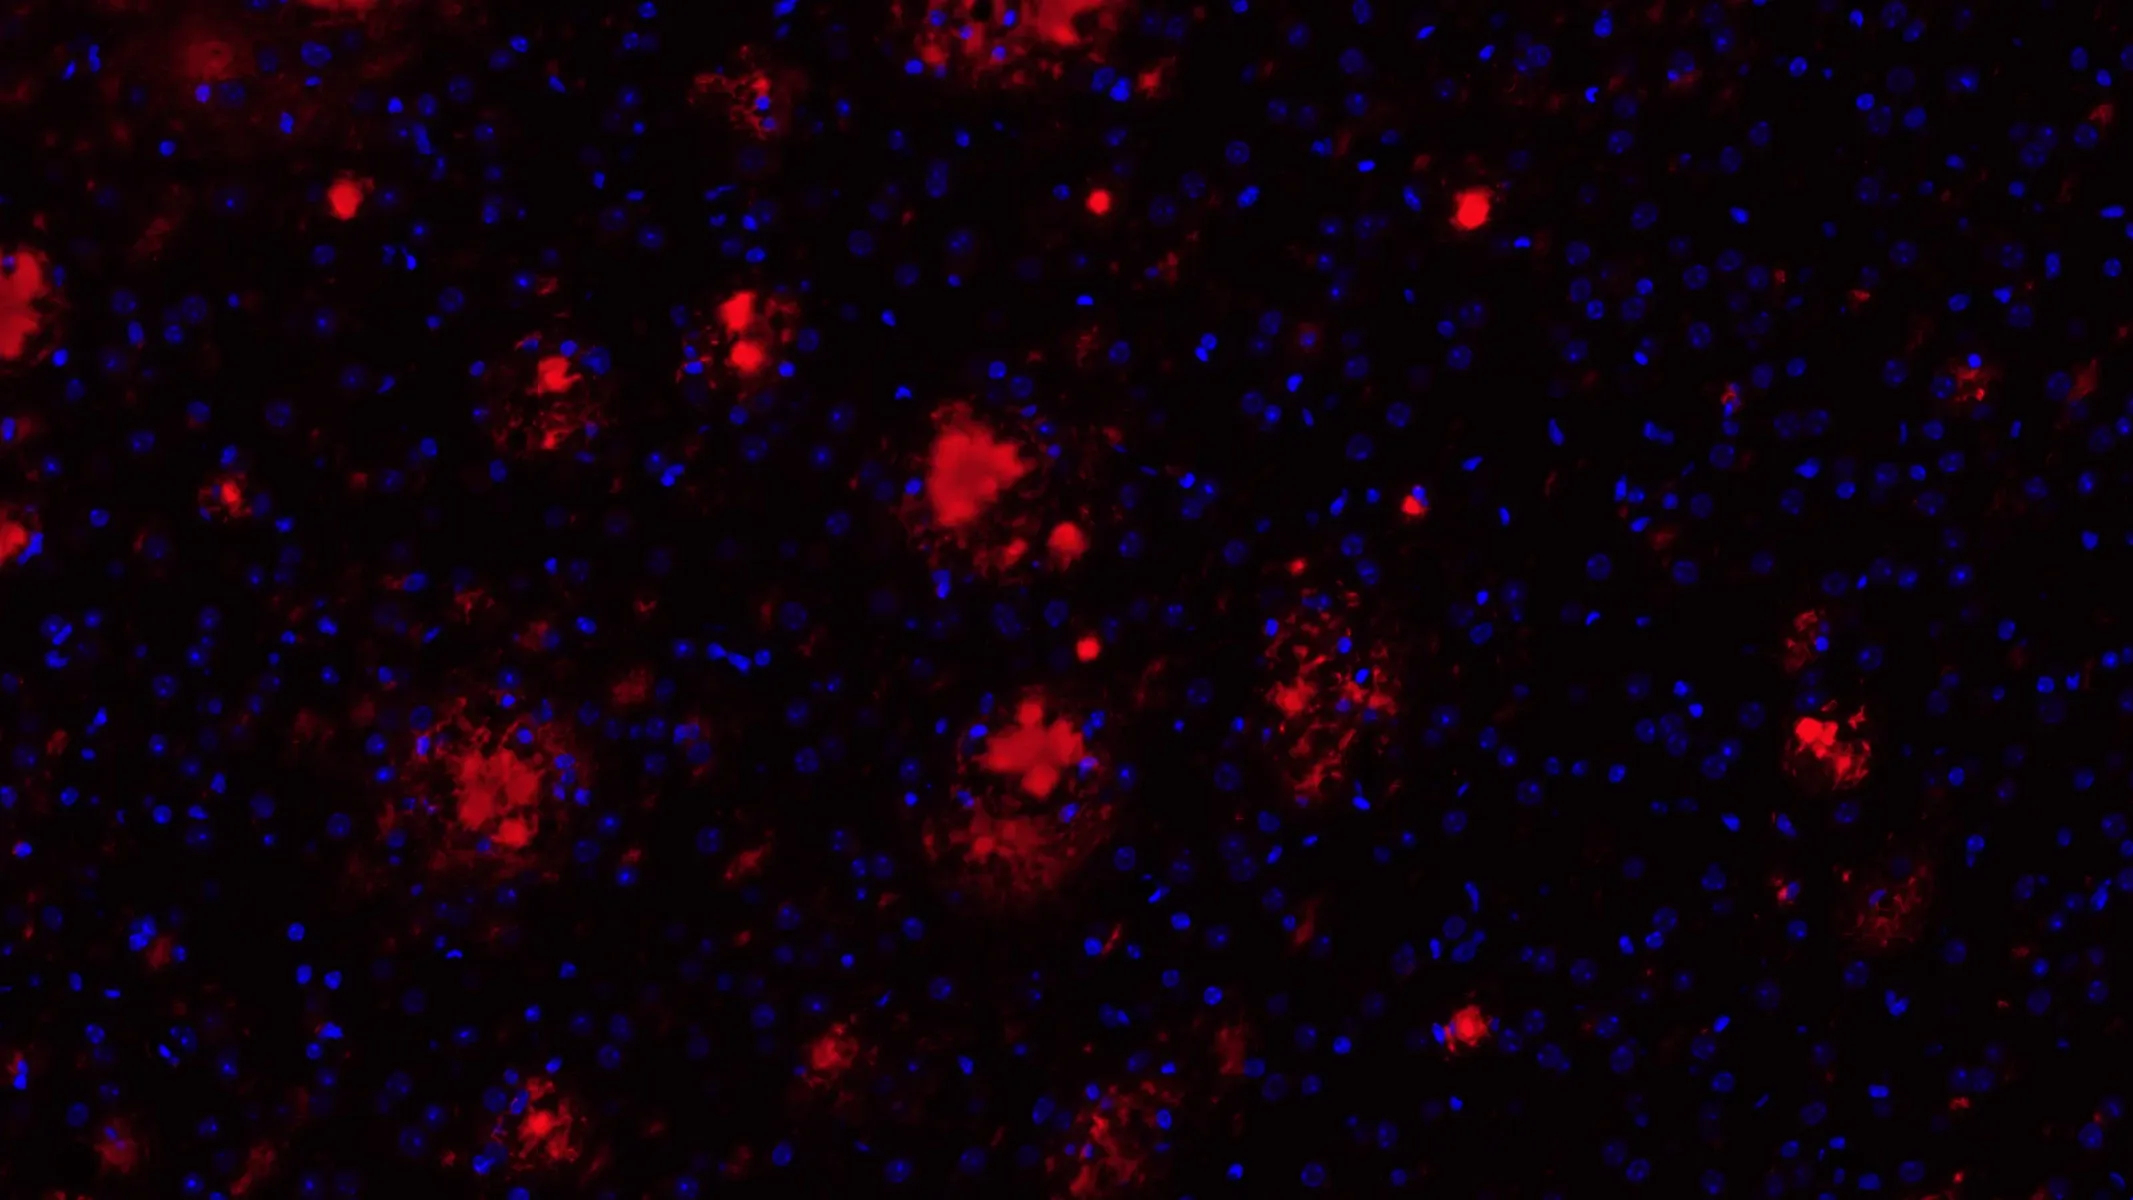
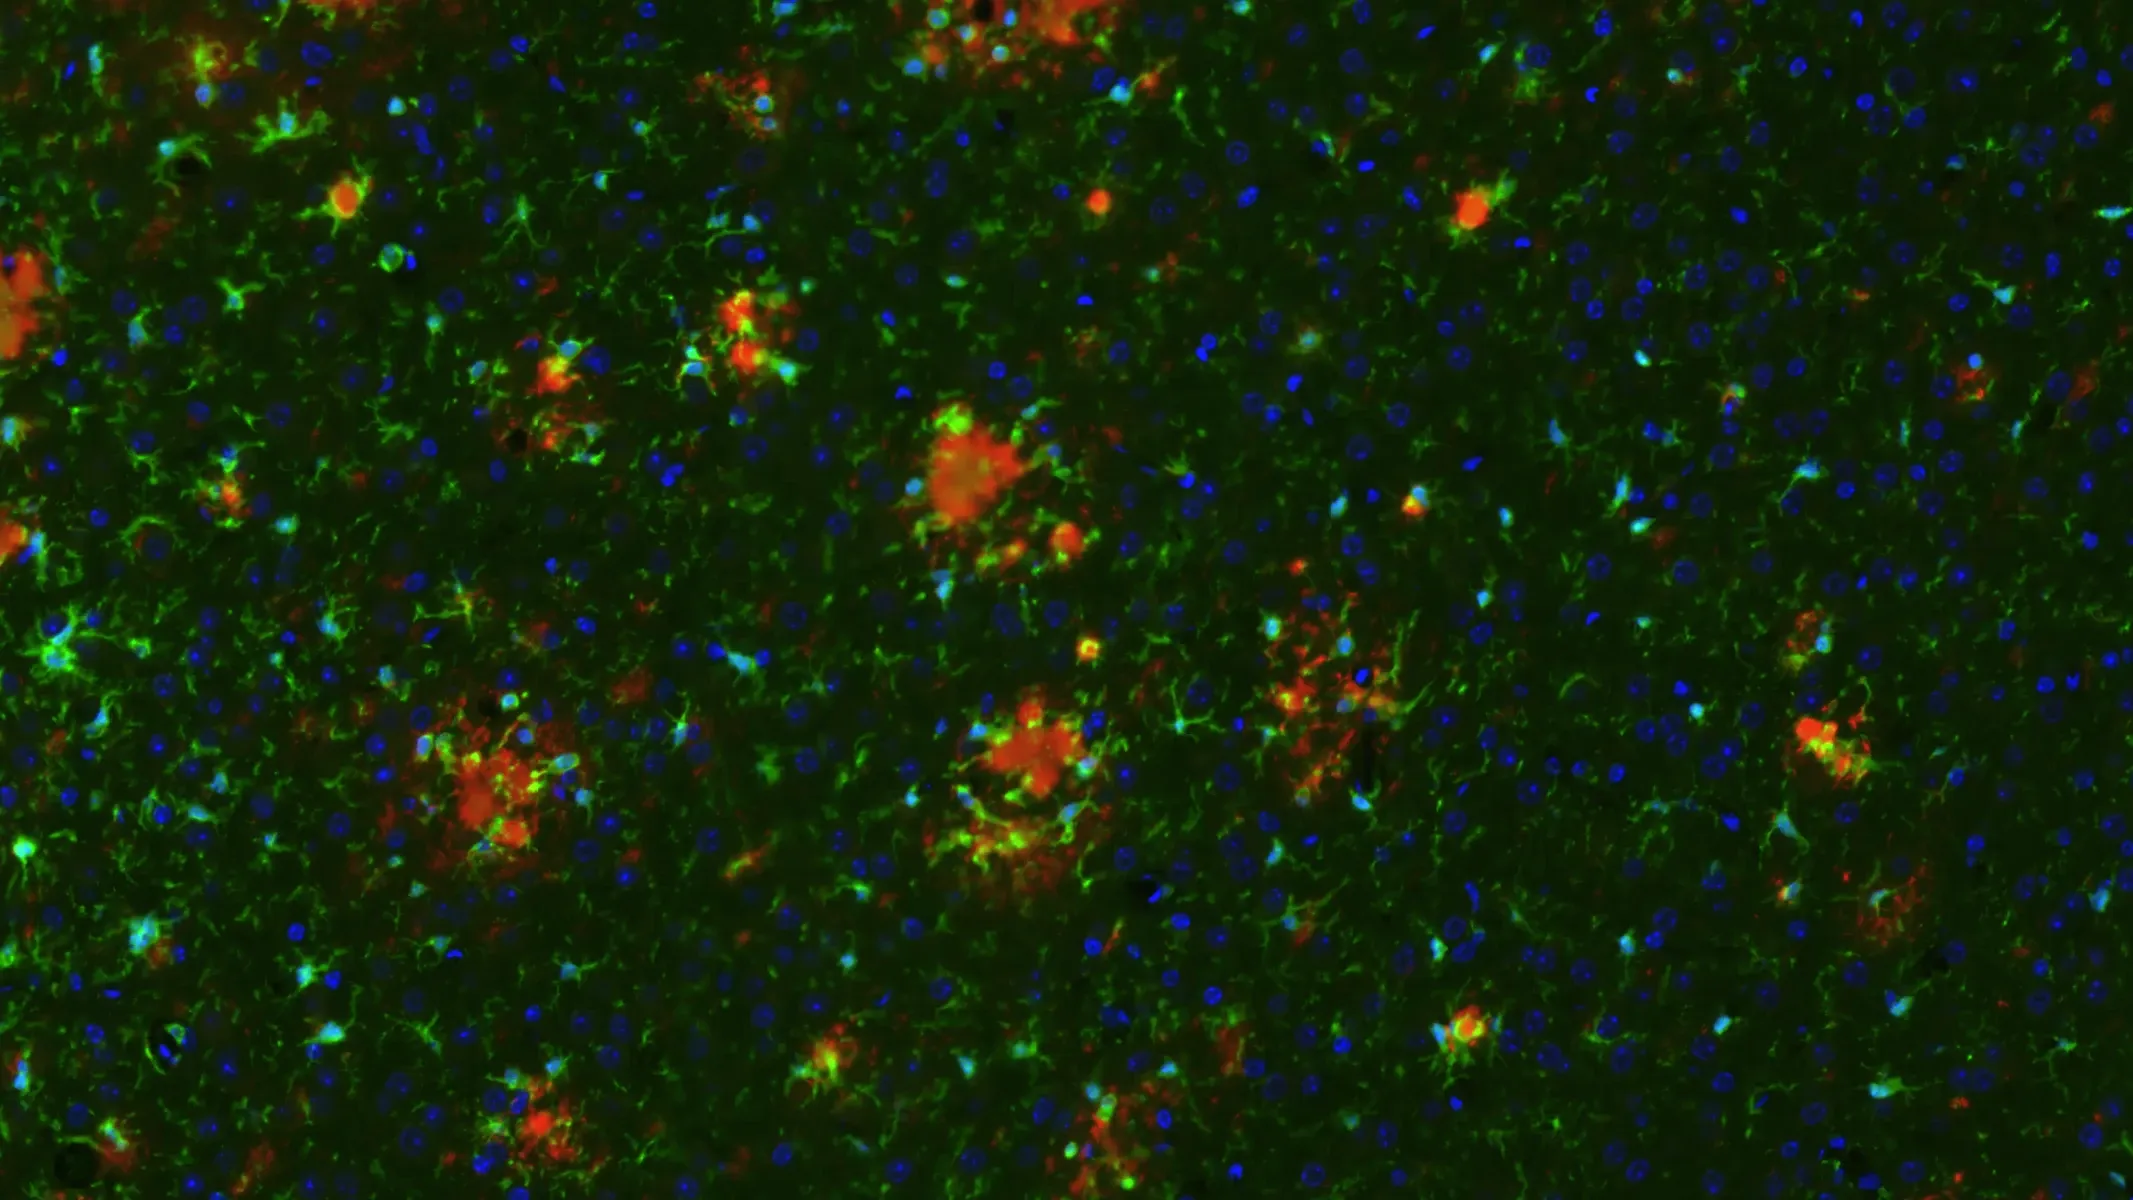
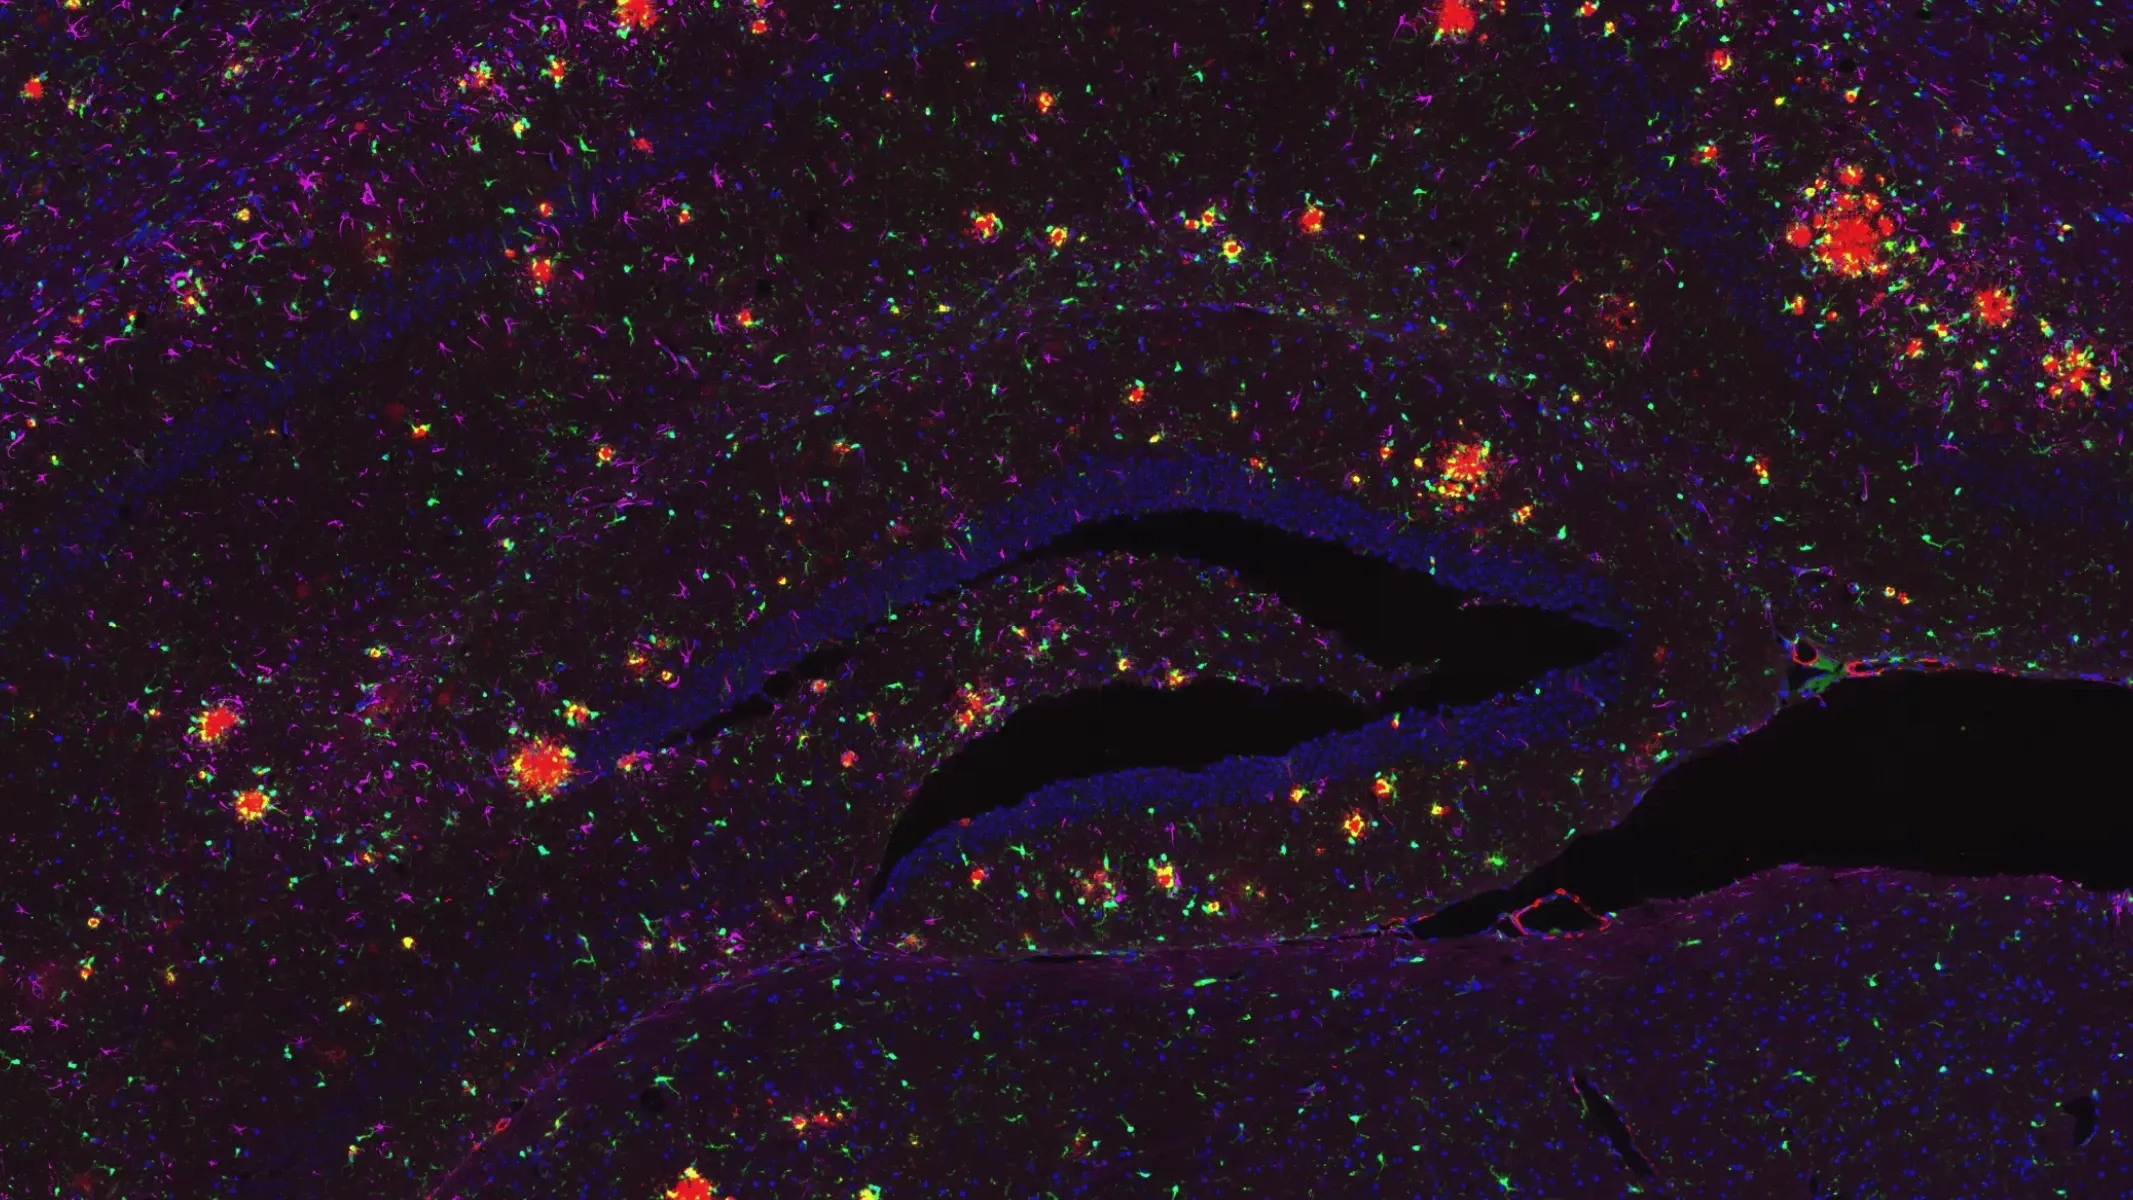
Amyloid-β and Phosphorylated Tau in APP/PS1/hTau Mice (Middle Brain; Low Magnification)
Low magnification image showing phosphorylated tau (in neuronal soma and processes) and fibrillar amyloid-β (plaques and vascular pathology). Note the extensive phosphorylated tau in the piriform cortex. For reference, an illustration with atlas labels for this approximate brain level is provided below.

Coronal Mouse Brain Section (Bregma -1.0) with Neuroanatomy Labels
Amyloid-β and Phosphorylated Tau in APP/PS1/hTau Mice (Middle Brain; High Magnification)
High magnification image showing phosphorylated tau (in neuronal soma and processes) and fibrillar amyloid-β (plaques and vascular pathology). Note the extensive level of phosphorylated tau in the piriform cortex. Similar pathology is also observed in the anterior cortex (not shown).
Pathological Tau Accumulation in APP/PS1/hTau Mice (Middle Brain; Low Magnification)
Low magnification image showing MC1 and T22 immunostaining reveals the distribution of tau pathology across distinct brain regions. Accumulation of conformationally altered tau (MC1) and oligomeric tau (T22) was observed in the cell soma and neurites in various brain regions of AAV-Tau-injected mice, both at the injection site and in connected distal areas.
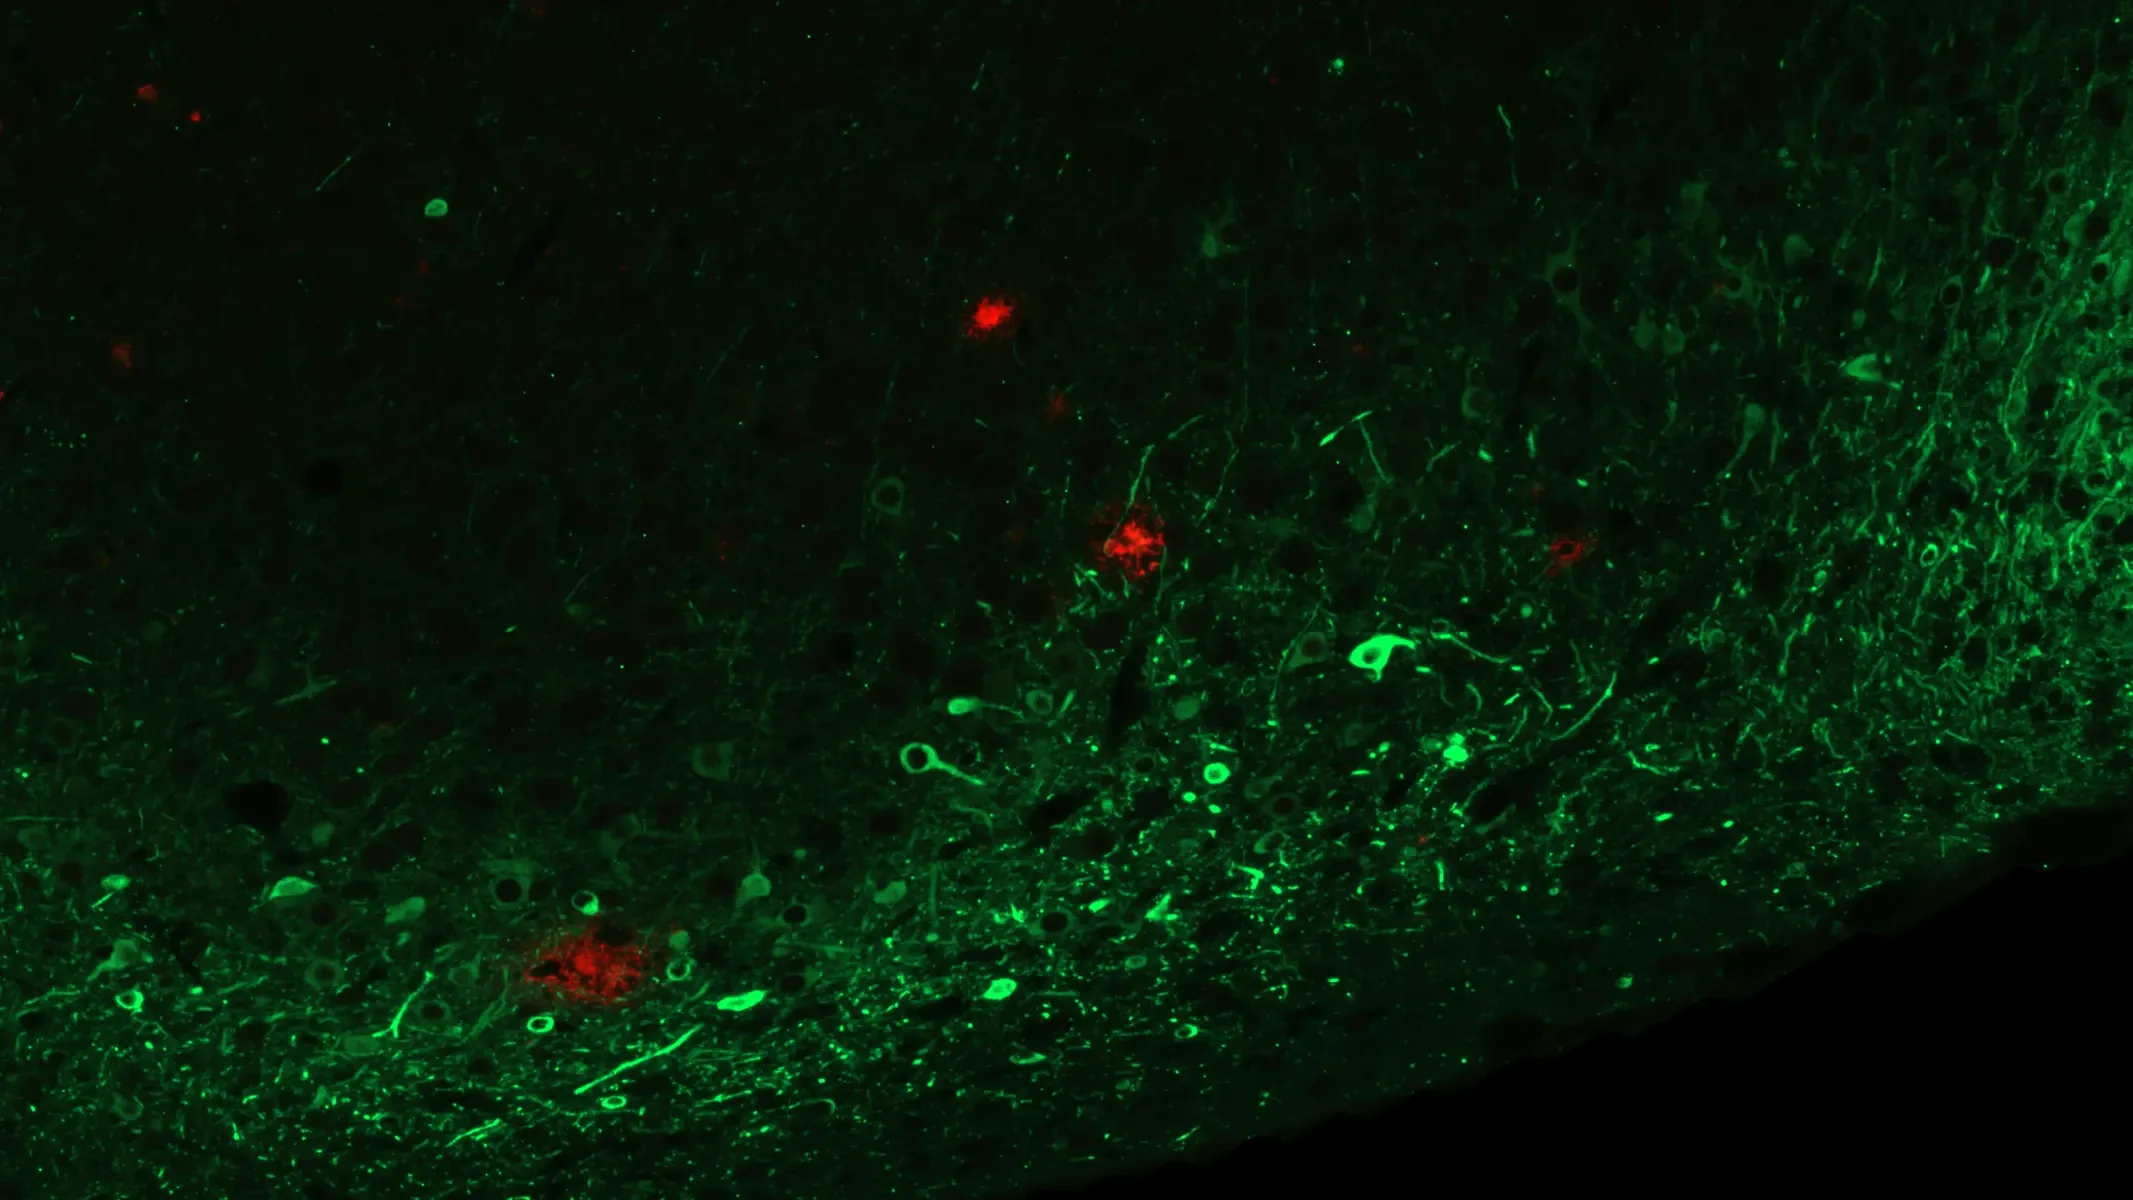
MC1-Positive Misfolded Tau in Piriform Cortex of APP/PS1/hTau Mice (Middle Brain; High Magnification)
High magnification image of the piriform cortex stained with MC1 antibody. Prominent accumulation of misfolded tau indicates early pathological changes. Similar staining was observed at the level of the anterior insula and the lateral entorhinal cortex.
Tau Oligomer Accumulation in Piriform Cortex (T22) of APP/PS1/hTau Mice (Middle Brain; High Magnification)
High magnification image of T22 staining in the piriform cortex reveals accumulation of tau oligomers. Similar staining was observed at the level of the anterior insula and the lateral entorhinal cortex.
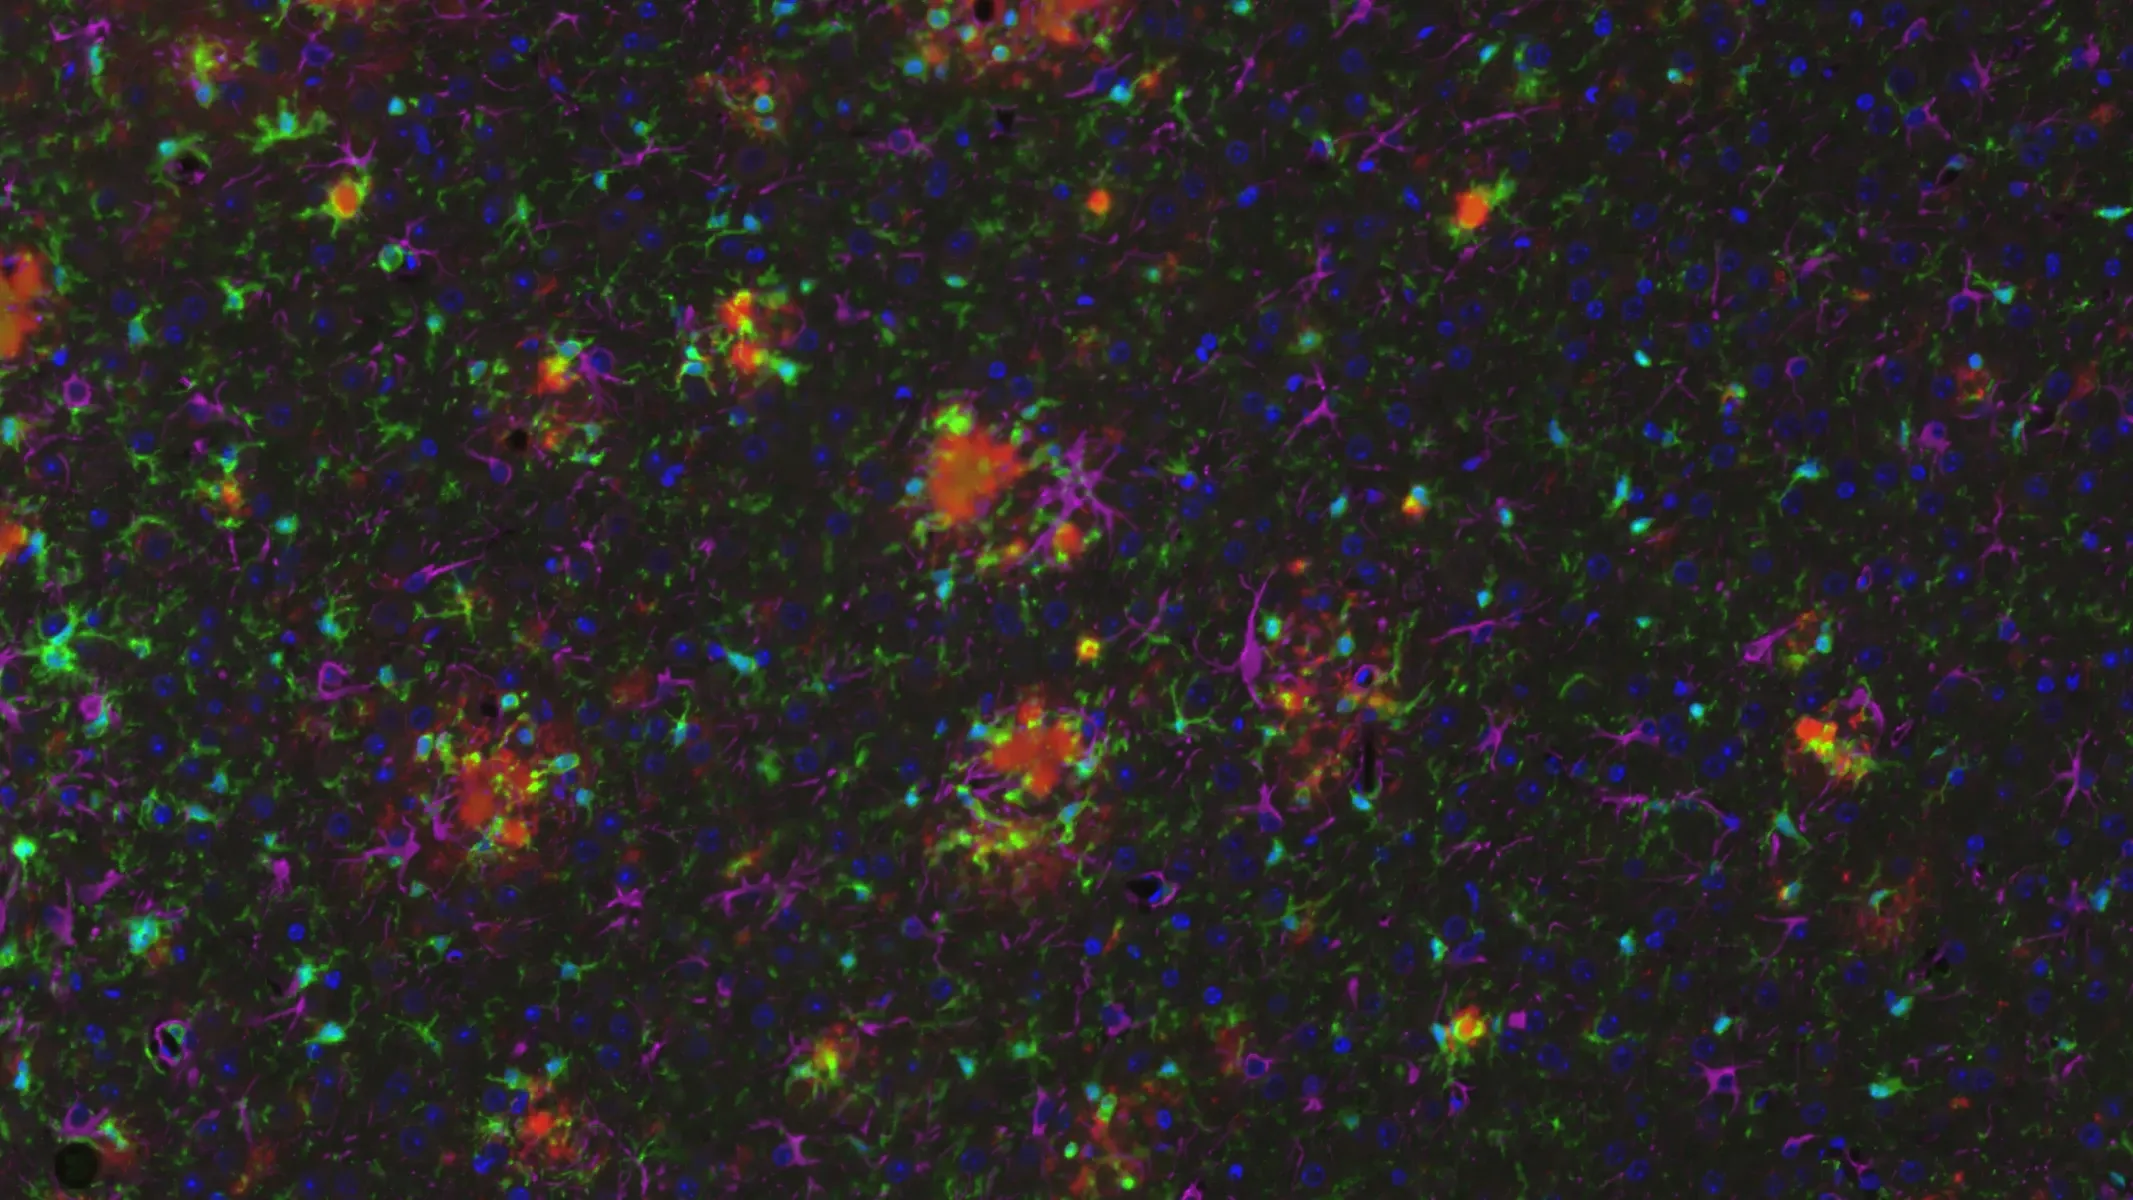
pTau, Microgliosis, and Astrogliosis in APP/PS1/hTau Mice (Middle Brain; High Magnification)
High magnification image showing phosphorylated tau (in neuronal soma and processes), microglia, and astrocytes. Note the extensive level of neuroinflammation in the piriform cortex.
The plots below show the quantitative analysis of Iba-1 and GFAP stain density in brain regions with amyloid-β and tau pathology.

Iba-1 stain density for APP/PS1/hTau compared to APP/PS1 (control) mice in Anterior, Piriform, and Entorhinal Cortex regions; mean ± SEM, t-test, *** p<0.001

GFAP stain density for APP/PS1/hTau compared to APP/PS1 (control) mice in Anterior, Piriform, and Entorhinal Cortex regions; mean ± SEM, t-test, *** p<0.001, ****p<0.0001
Sleep Alterations in APP/PS1/hTau Mice
Sleep is altered in Alzheimer’s disease and has been associated with tau-driven neuropathology. Increased daytime sleep has been observed in later stages of the disease.
We have performed an assessment of sleep-wake cycles in the APP/PS1/hTau model using the non-invasive PiezoSleep system. The plot below shows the increased level of sleep in the dark phase in APP/PS1/hTau mice compared to APP/PS1 mice (corresponding to daytime sleep in humans).

Percentage of sleep in the light and dark phases measured by the PiezoSleep system.
Brain Atrophy in the APP/PS1/hTau Model
We have acquired in vivo anatomical MRI data from wild-type (WT), WT/hTau, APP/PS1, and APP/PS1/hTau mice at 4 weeks following injection of AAV-hTau or AAV-null (control) vectors. We generated regional volumes and cortical thickness measures using our fully-automated NIGHTWINGTM image processing platform. The figures below show MRI atlases and quantitative measures in several brain regions.

Anatomical MRI with segmented regions, and plots of regional volumes assessed in wild-type (hashed), and APP/PS1 (solid), AAV-null and hTau mice. **p<0.01,***p<0.001, ****p<0.0001

Mouse brain surface rendering with segmented entorhinal cortex, as well as a plot of the regional thickness assessed in wild-type (hashed), and APP/PS1 (solid), AAV-null and hTau mice. *p<0.05, **p<0.01, ***p<0.001, ****p<0.0001
Note that APP/PS1 mice do not show any brain atrophy compared to WT mice. The injection of AAV-hTau induced highly significant reductions of regional volumes and cortical thickness. Interestingly, the APP/PS1/hTau mice appear to have greater brain atrophy compared the the WT/hTau mice, suggesting a potential modulatory role of amyloid-β.
Translation of Mouse MRI Brain Atrophy Data to Human Alzheimer's Disease
Our team at Biospective has performed a rigorous analysis of the relationship between amyloid-β, tau, and cortical thickness in human Alzheimer’s disease. This analysis was performed using Amyloid PET, Tau PET, and 3D Anatomical MRI data from the ADNI study. We have found that tau, rather than amyloid-β, is primarily responsible for cortical thinning, as well as regional cerebral glucose metabolism, which can be appreciated in the figure below.

t-Statistic maps (thresholded for statistical significance) demonstrating the effect of tau and amyloid-β on both cortical thickness and cerebral glucose metabolism.
We have further demonstrated that the correlation between tau and cortical thickness is increased as the amyloid-β burden increases, which is apparent in the video below.
Statistical maps showing increased regional correlation between tau and cortical thickness as a function of amyloid-β load.
This human neuroimaging data corresponds well with our mouse MRI data showing that tau is the primary driver of brain atrophy with an apparent increase in the presence of amyloid-β.
Summary
This novel amyloid-β/tau co-pathology mouse model recapitulates several features of Alzheimer’s disease. In terms of the neuropathology, we have observed parenchymal (including diffuse, dense-core, and neuritic plaques) and vascular Aβ aggregates, phosphorylated tau in cell bodies and processes (including dystrophic neurites), microgliosis, and astrogliosis. We plan to further explore the relationships between the misfolded proteins and neuroinflammation in this model.
One of the most interesting observations is the neurodegenerative phenotype in the APP/PS1/hTau mice. The regional brain atrophy observed via structural analysis of the anatomical MRI scans can provide a robust way to evaluate the effects of potential interventions and serve as a translational biomarker given the widespread use of neuroimaging in AD clinical trials.
Based on the quantifiable in-life and post-mortem measures that we have reported, APP/PS1/hTau mice can serve as a useful model for preclinical evaluation of novel disease-modifying therapeutics for Alzheimer’s disease.
Please feel free to further explore the microscopy image in the viewer.
We would be happy to discuss this model and our characterization if you would like to Contact Us.
Table of Contents
Control Panel
Section: Coronal Section 1
0
1
2
3
4
Channels
Share link to
 Click to copy link
우리의 APP/PS1/hTau 모델에 대한 특성 분석, 검증된 측정 방법, 그리고 전임상 신경과학 CRO 서비스에 대해 자세히 알아보세요.
알츠하이머 병 및 타우병증 모델에 대해 더 알아보세요
자주 묻는 질문
이 아밀로이드-β 및 타우 공병리 모델에서 뇌 위축이 관찰되나요?
네. 가장 흥미로운 관찰 결과 중하나는APP/PS1/hTau 마우스에서 관찰된신경퇴행성 표현형입니다.해부학적 MRI 스캔의구조적분석을통해 관찰된 뇌 부위별 위축(부피 및 피질 두께)은 잠재적 치료법의 효과를 평가하는 강력한 방법을 제공하며, 알츠하이머 병(AD) 임상 시험에서 신경영상 기술의 광범위한 활용을 고려할 때 번역적 바이오마커로 활용될 수 있습니다.
이 아밀로이드-β 및 타우 공병리 모델에서병리가 진행됨에 따라 관찰되는 생리학적 변화가 있습니까 ?
네. APP/PS1/hTau 모델에서 비침습적 PiezoSleep 시스템을 사용하여 수면 구조를 분석한결과, APP/PS1/hTau 마우스에서APP/PS1 마우스에 비해 어두운 단계에서 수면 시간이 증가했으며, 이는 인간에서의 낮 수면과일치합니다 . 특히, 수면 장애는 알츠하이머 병의 진행과 연관되어 있으며, 타우 단백질에 의한 신경병리와 관련이 있습니다. 낮 시간대 수면 증가 현상은 질병의 후기 단계에서 특히 두드러집니다.
이 모델은 인간 알츠하이머 병에 적용가능할까요 ?
네. MRI 기반 뇌 위축 정량화 및 PET 포도당 대사 평가를 통해 동물 연구와 인간 임상 시험을 연결하는 유용한 번역적 바이오마커를 제공합니다. Biospective는 알츠하이머 병 및 진행성 초핵성 마비, 피질기저부 퇴화, 전두측두엽 치매와 같은 기타 신경퇴행성 질환에서 MRI 및 PET 평가를 위한 파이프라인을 개발했습니다.
우리는MRI 및 PET 바이오마커의 활용을 설명하는여러 자료와 혁신발표를발표했습니다. 포함된 내용은 다음과 같습니다 :
- 타우 관련 위축은 베타-아밀로이드 및 APOE ε4와 독립적입니다 (혁신 발표 )
- MCI에서 뇌 포도당 대사 감소 는 타우에 의해 유발됩니다 (혁신 발표)
- MCI 및 알츠하이머 병에서의 타우 PET의 장기 적 변화 (자료)
- 진행성 수핵성 마비(PSP)를 위한 영상 바이오마커 (자료)
- 코르티코바질 퇴행과 다른 타우병증을 구분하기 위한 영상 바이오마커 (자료)
- 전두측두엽 치매 및 임상 시험에서의 신경영상 (자료)
- 진행성 수초핵 마비 임상 시험을 위한 MRI 기반 질병 진행 측정 (혁신 발표)
- MRI 및 코르티코바질 퇴화 (혁신 발표)
- 전두측두엽 치매 (FTD) 및 MRI 뇌 위축 (혁신 발표)
- 확산 MRI 및 전두측두엽 치매 (FTD) (혁신 발표)
연구들은 타우(tau)와 베타-아밀로이드(β-amy loid ) 가 뇌 위축에 미치는 영향에 대해 어떤 결과를 보여주고 있나요?
Biospective의 연구 결과는 타우 병리가 APOE ε4 유전자형과 무관하게 베타-아밀로이드보다 뇌 위축 및 포도당 대사 감소와 더 밀접하게 연관되어 있음을 보여줍니다. 이러한 발견은 타우 중심의 신경퇴화 모델을 지지합니다. 우리는 최근Alzheimer's & Dementia에논문을 게재했습니다:
이 주제에 대한InnovationPresentations도 발표했습니다:
관련 콘텐츠
알츠하이머 병 및 타우병에 대한 최신 정보와 동물 모델에서 치료제 평가를 위한 번역 생물표지자의 사용과 관련된 최선의 실천 방법.
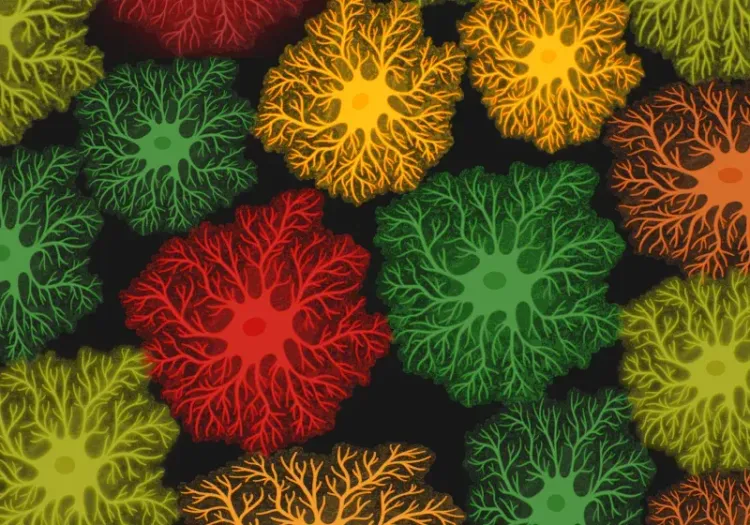
알츠하이머병의 성상교세포 형태
성상교세포 형태학적 분석의 개요와 신경 퇴행성 질환 연구 및 신약 개발에 대한 응용.