Neurodegeneration & Neuroinflammation in the AAV-Synuclein Mouse Model
模型概述
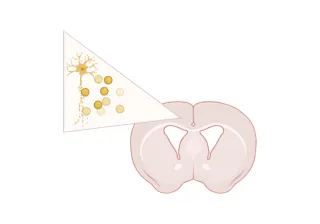
在Biospective,我们开发并应用严格表征的啮齿类动物模型,这些模型能高度再现人类帕金森病的关键特征——包括α-突触核蛋白聚集、多巴胺能神经元丧失、神经炎症、运动功能障碍及睡眠紊乱。这些模型旨在支持对疾病机制、病理进展及早期治疗效果的研究,具有强烈的转化医学相关性。
我们的动物模型体系注重可重复性、表型特征明确性,并整合行为学、影像学、生化、分子及组织病理学终点指标,实现全面的临床前评估。这一科学基础使研究者能够探索致病通路、评估候选治疗干预措施,并生成可靠数据以指导药物研发工作。
α-Synuclein Preformed Fibril (PFF) 模型
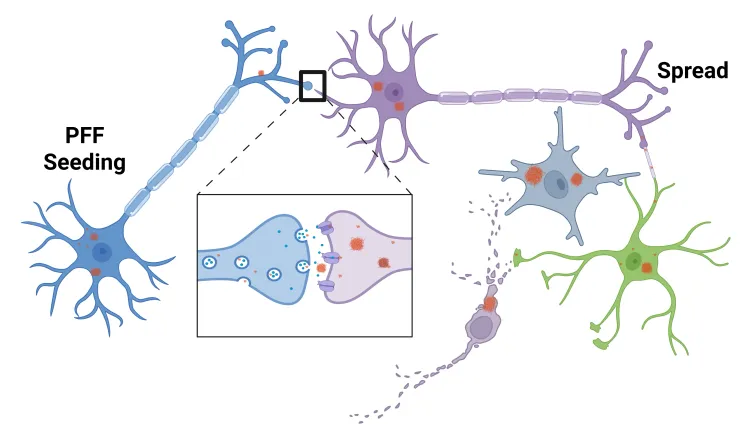
人类帕金森病特征性的异常折叠α-突触核蛋白病理性扩散,可通过向动物脑内注射预成型纤维(PFFs)进行建模。该"PFF播种与扩散模型"可在过表达人源α-突触核蛋白的转基因小鼠,或野生型小鼠及大鼠中诱导形成。
α-突触核蛋白PFF模型诱导
- 重组α-突触核蛋白预成型纤维(PFFs)注射
- 适用对象
- 过表达A53T突变型α-突触核蛋白的M83转基因小鼠
- 野生型小鼠或大鼠
经验证的α-突触核蛋白PFF注射部位
- 前嗅核(AON)
- 内侧前脑束(MFB)
- 纹状体 +/- 覆盖脑皮质
α-突触核蛋白PFF疾病特征模型
- α-突触核蛋白以明确时空模式扩散
- 神经炎症
- 神经退行性变
- 可测量的行为障碍
- 运动功能缺损
- 非运动症状(如睡眠障碍)
这些α-突触核蛋白PFF帕金森病模型具有高度可重复性,适用于测试疾病修饰疗法。
在Biospective公司,我们拥有十余年在α-突触核蛋白PFF帕金森病模型中开展临床前研究的经验,用于评估:
- 生物分布
- 靶点结合
- 作用机制
- 治疗效果
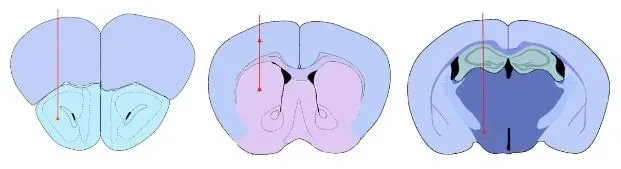
我们验证的注射部位:前嗅核(AON)、纹状体±覆盖脑皮质,以及内侧前脑束(MFB)。
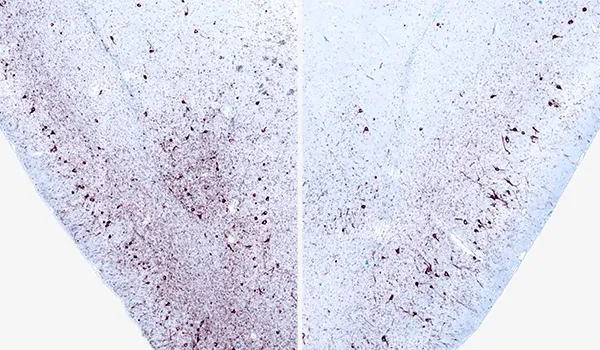
单侧α-突触核蛋白PFF注射至M83+/-小鼠AON后12周,同侧(左)与对侧(右)梨状皮层中磷酸化α-突触核蛋白(pSyn129)的免疫组化染色。
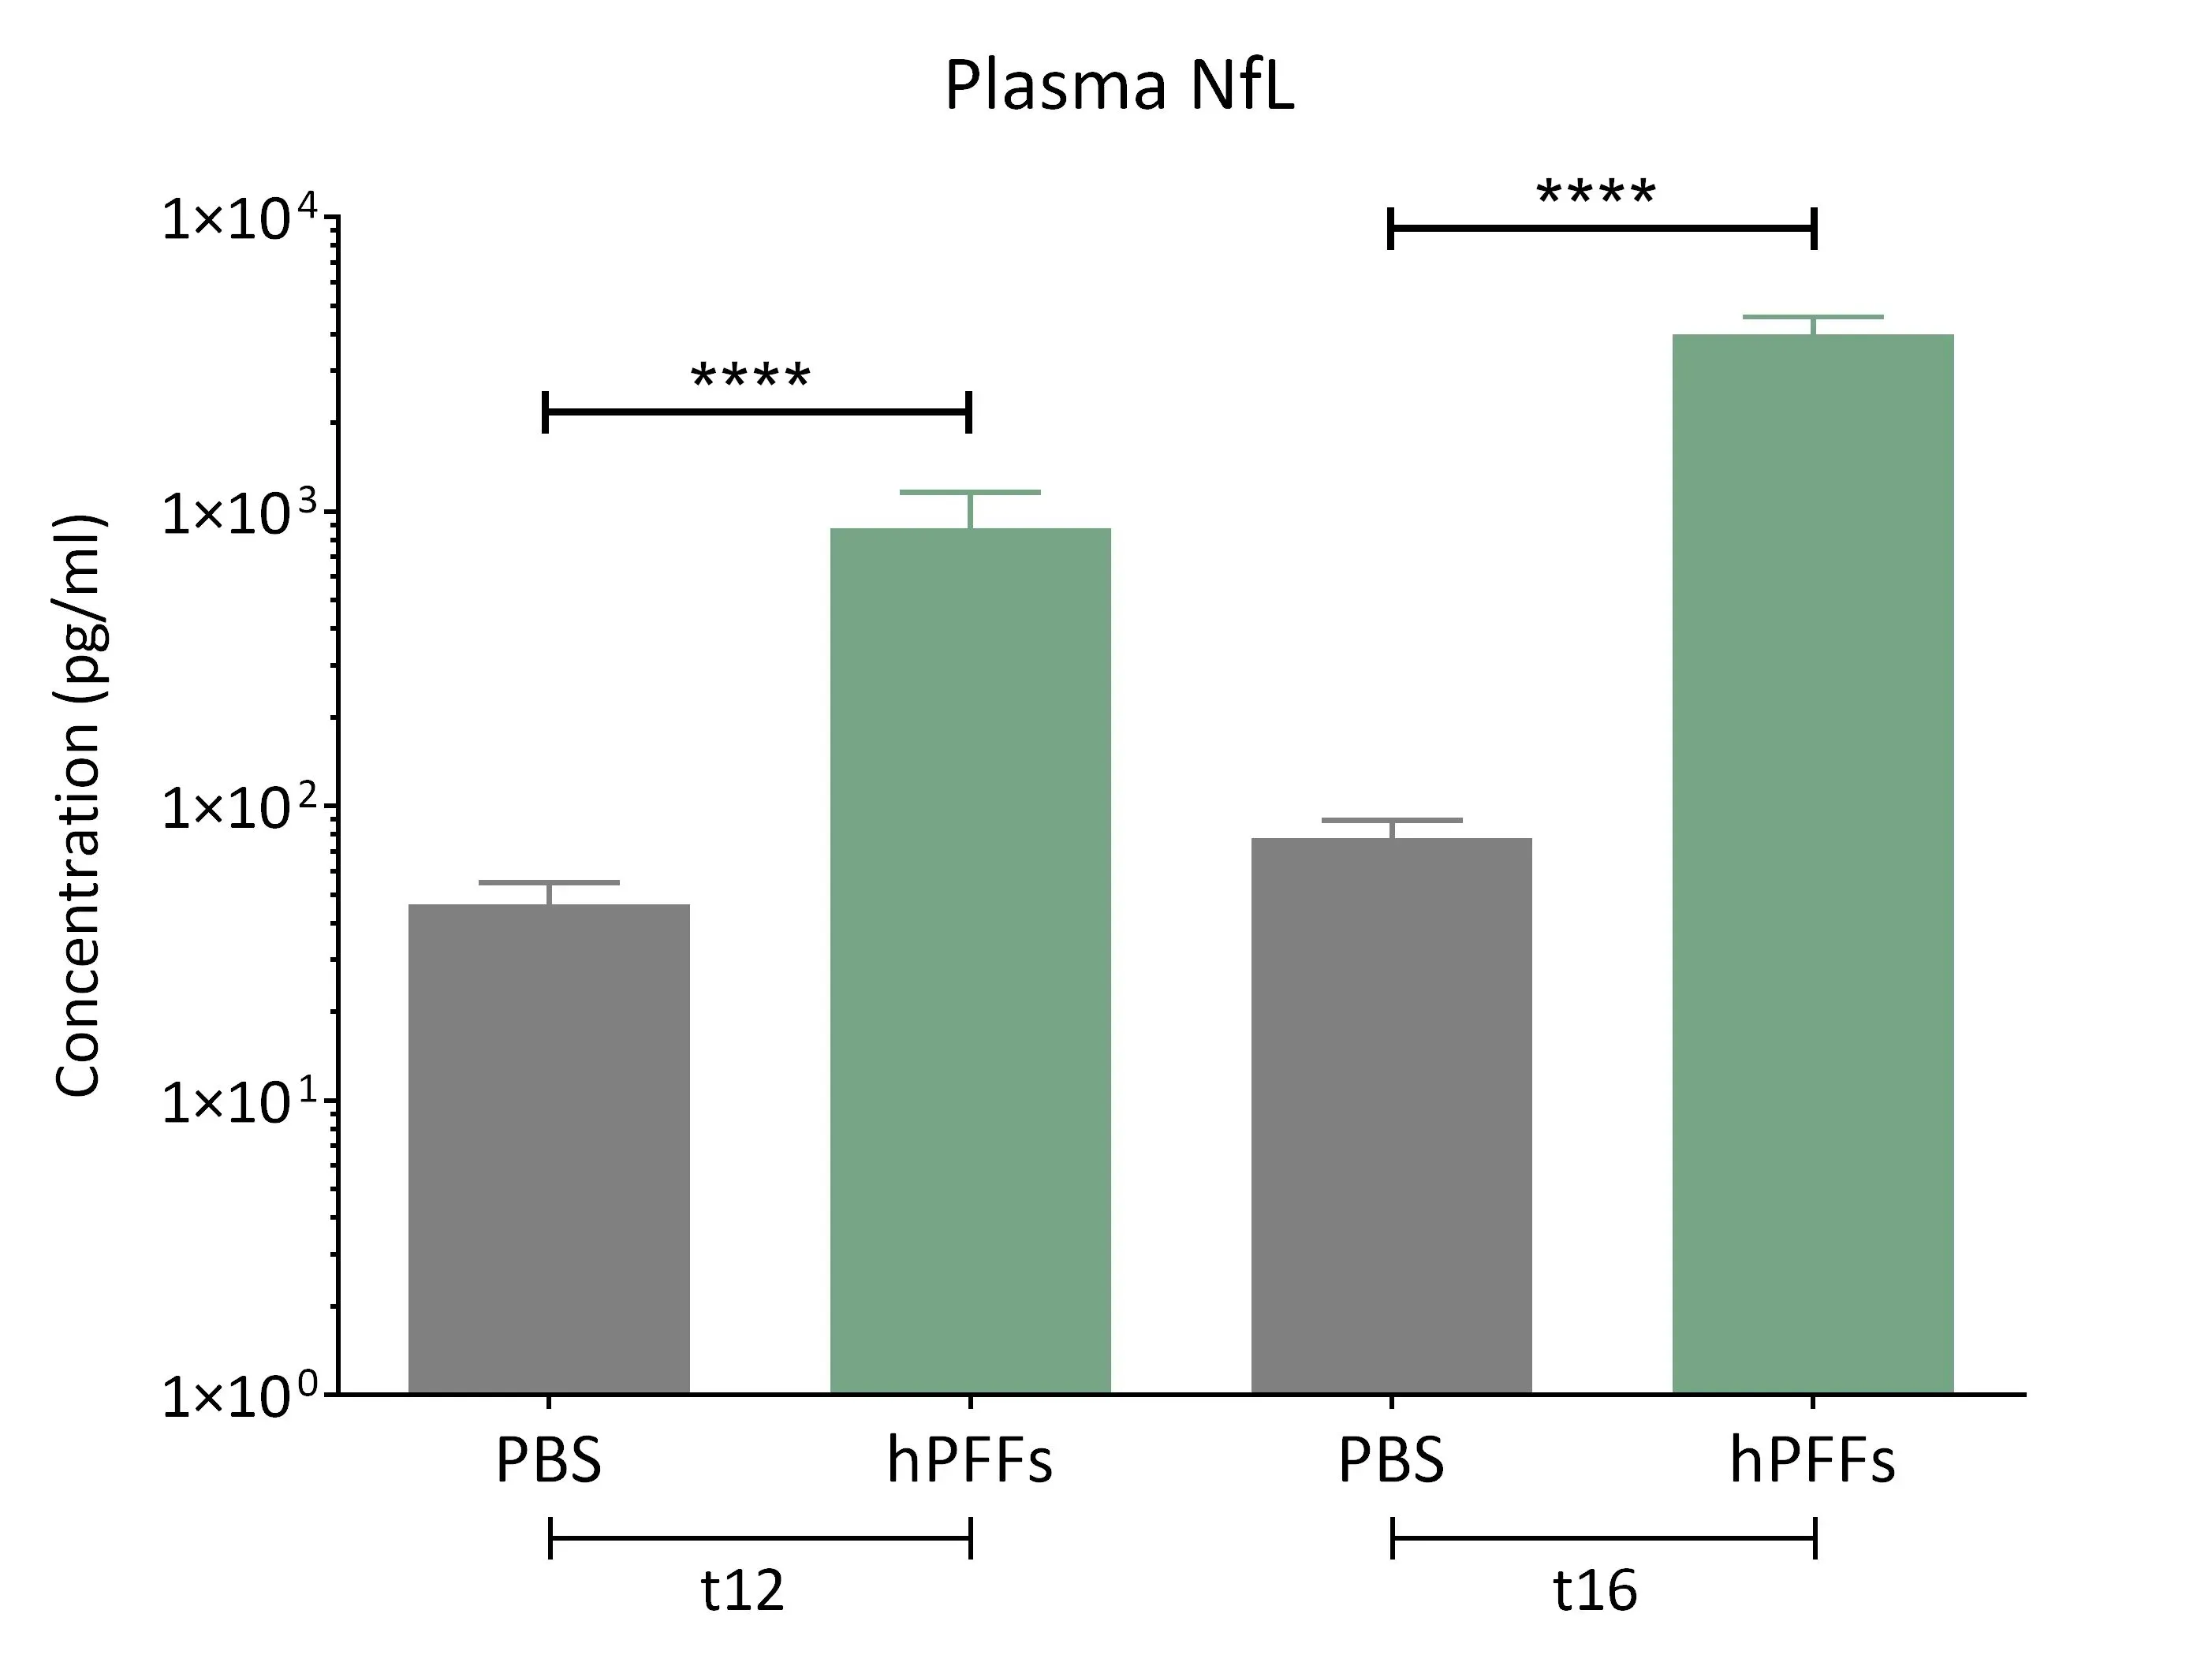
在α-突触核蛋白纤维种子小鼠的血浆中观察到神经丝轻链(NF-L)水平显著升高。
AAV A53T α-Synuclein小鼠模型
通过注射腺相关病毒(AAV)载体,可在成年啮齿类动物脑内诱导α-突触核蛋白病理变化。在此帕金森病小鼠模型中,专家使用配备自动化微注射器的数字立体定位装置(确保高精度与精准度),将过表达A53T突变型人α-突触核蛋白的AAV载体,经立体定位注射至野生型(C57BL/6)小鼠或基因工程小鼠的致密黑质区域。
AAV-A53T α-突触核蛋白模型诱导
- 立体定位注射过表达A53T突变人α-突触核蛋白的腺相关病毒(AAV)载体
AAV-A53T α-突触核蛋白验证注射部位
- 黑质致密部(SNc)
AAV-A53Tα-突触核蛋白疾病特征模型
- 黑质致密部多巴胺能神经元丧失及同侧纹状体去神经支配
- 黑质致密部与纹状体中磷酸化α-突触核蛋白聚集
- 神经炎症
- 神经退行性变
- 可通过以下测试测量的单侧运动功能缺损:
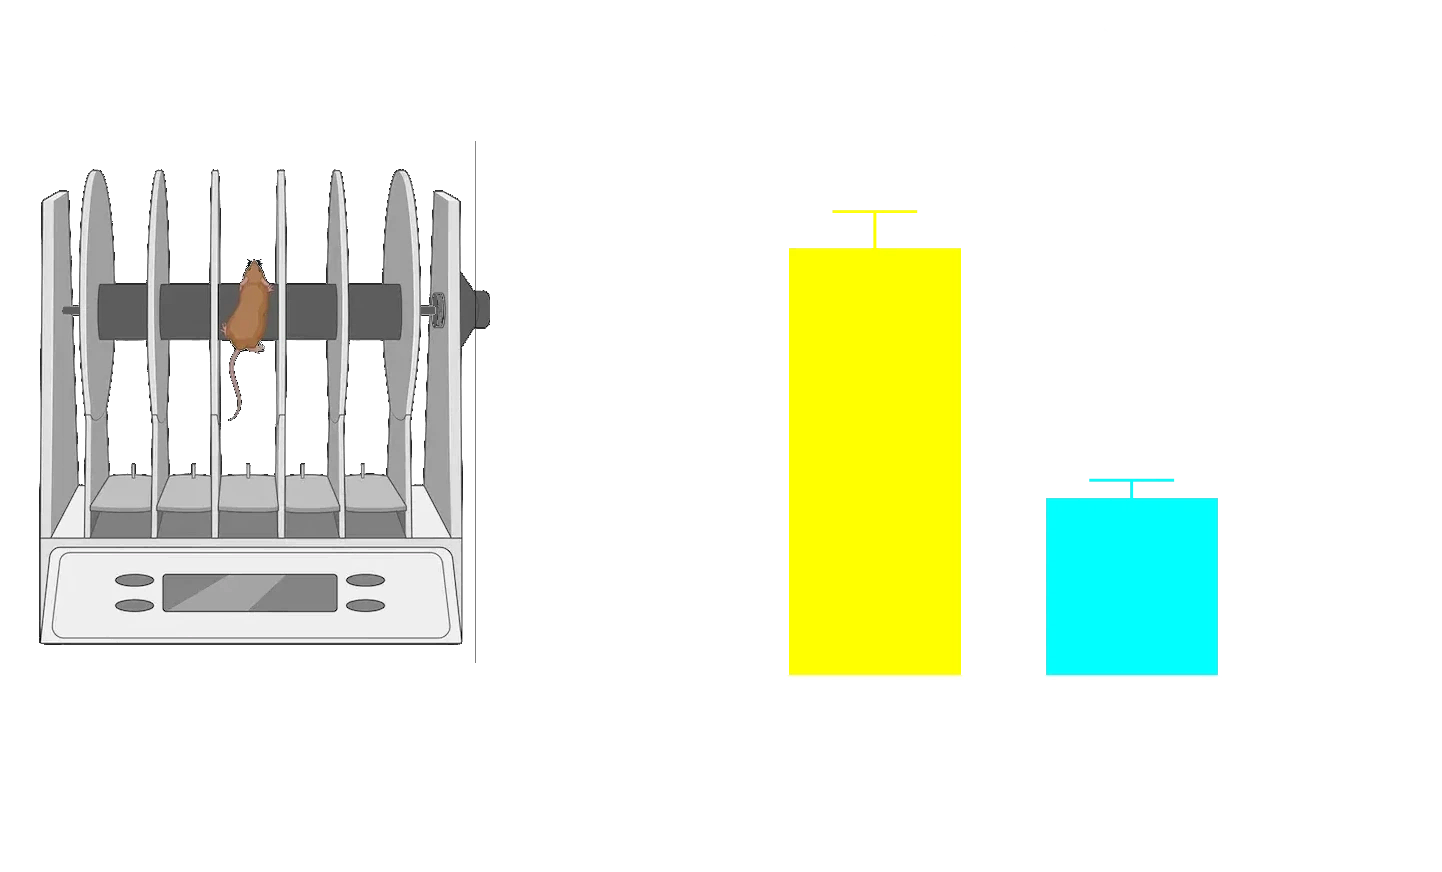
- 旋转杆测试
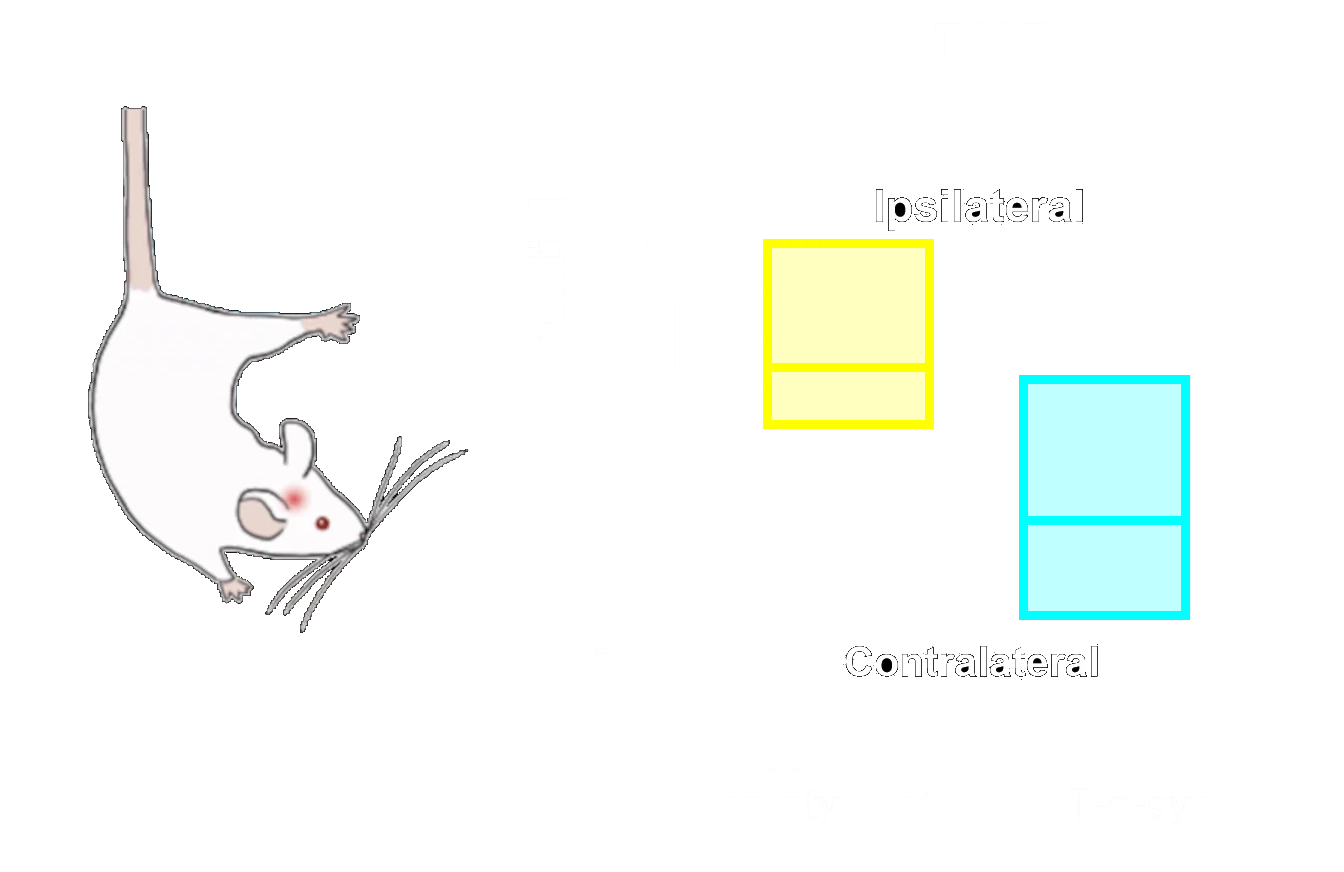
- 悬尾摆动测试(TSST)
- 圆柱测试
- 后肢抓握测试
在Biospective,我们还能对这些AAV-A53T α-突触核蛋白模型进行无创成像研究(如MRI体积测量、[18F]FDG PET、[18F]DOPA PET),以生成具有临床转化价值的影像生物标志物(如局部脑萎缩、脑葡萄糖代谢低下、多巴胺能末梢丧失)。
AAV-A53T α-突触核蛋白帕金森病模型提供了一个强大且灵活的研究平台,特别适用于探究治疗药物(如小分子药物、反义寡核苷酸、基因疗法、生物制剂)对帕金森病致病机制及功能障碍的影响。
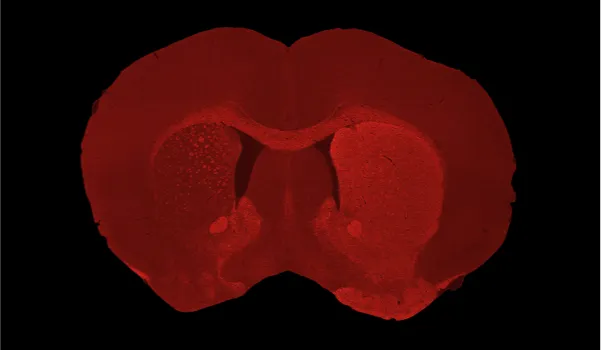
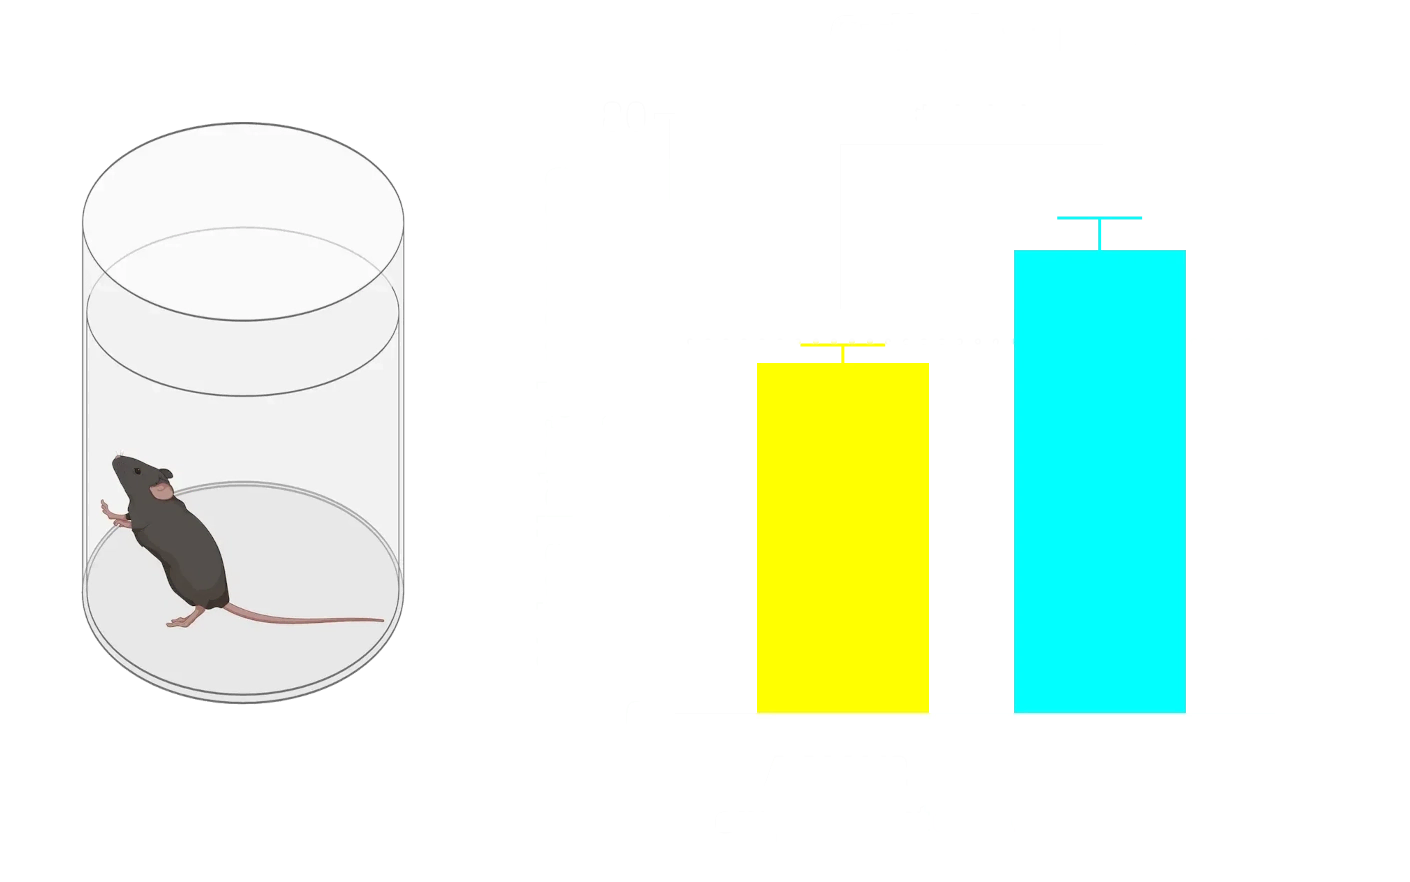
单侧AAV-hA53Tα-Syn病毒注射至C57BL/6小鼠黑质致密部后,同侧(左半球)尾状核-壳核区域出现严重多巴胺能神经元丧失及多巴胺能去神经支配现象。
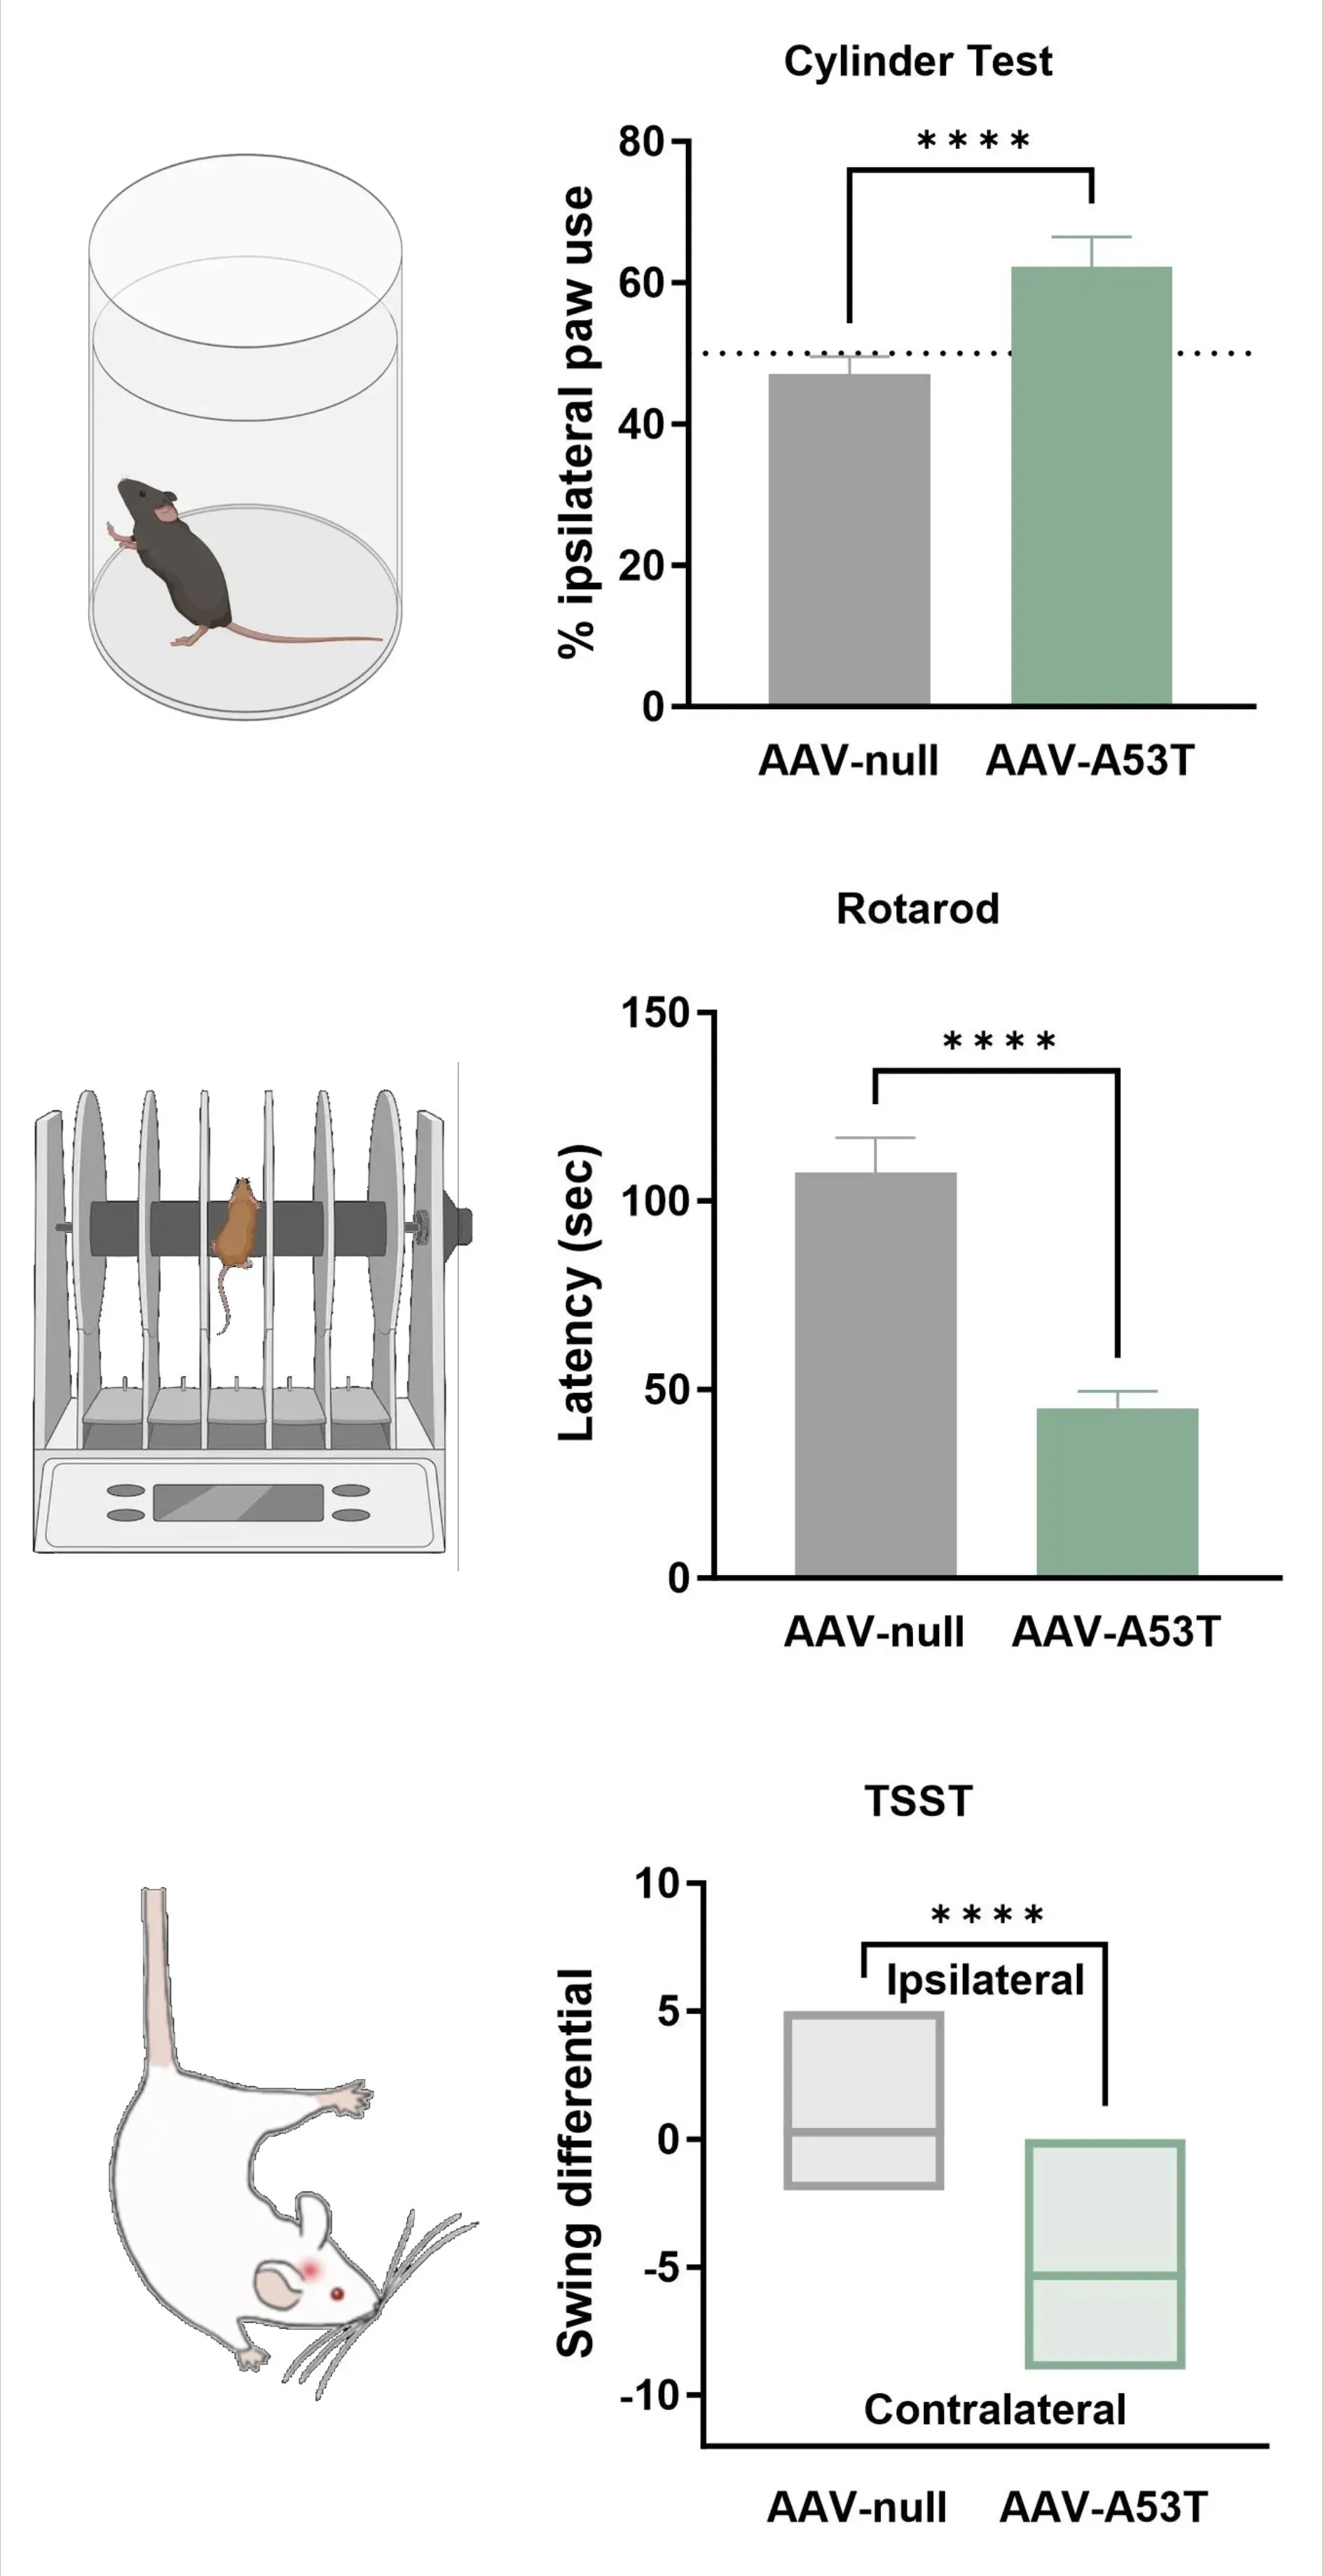
多巴胺能神经支配的丧失与单侧运动功能缺损相一致,包括:同侧足掌使用增加(圆筒测试)、跌落潜伏期缩短(旋转杆测试)以及对侧摆动增加(悬尾摆动测试)。
我们帕金森病模型的哪些特征可转化应用于人类疾病?
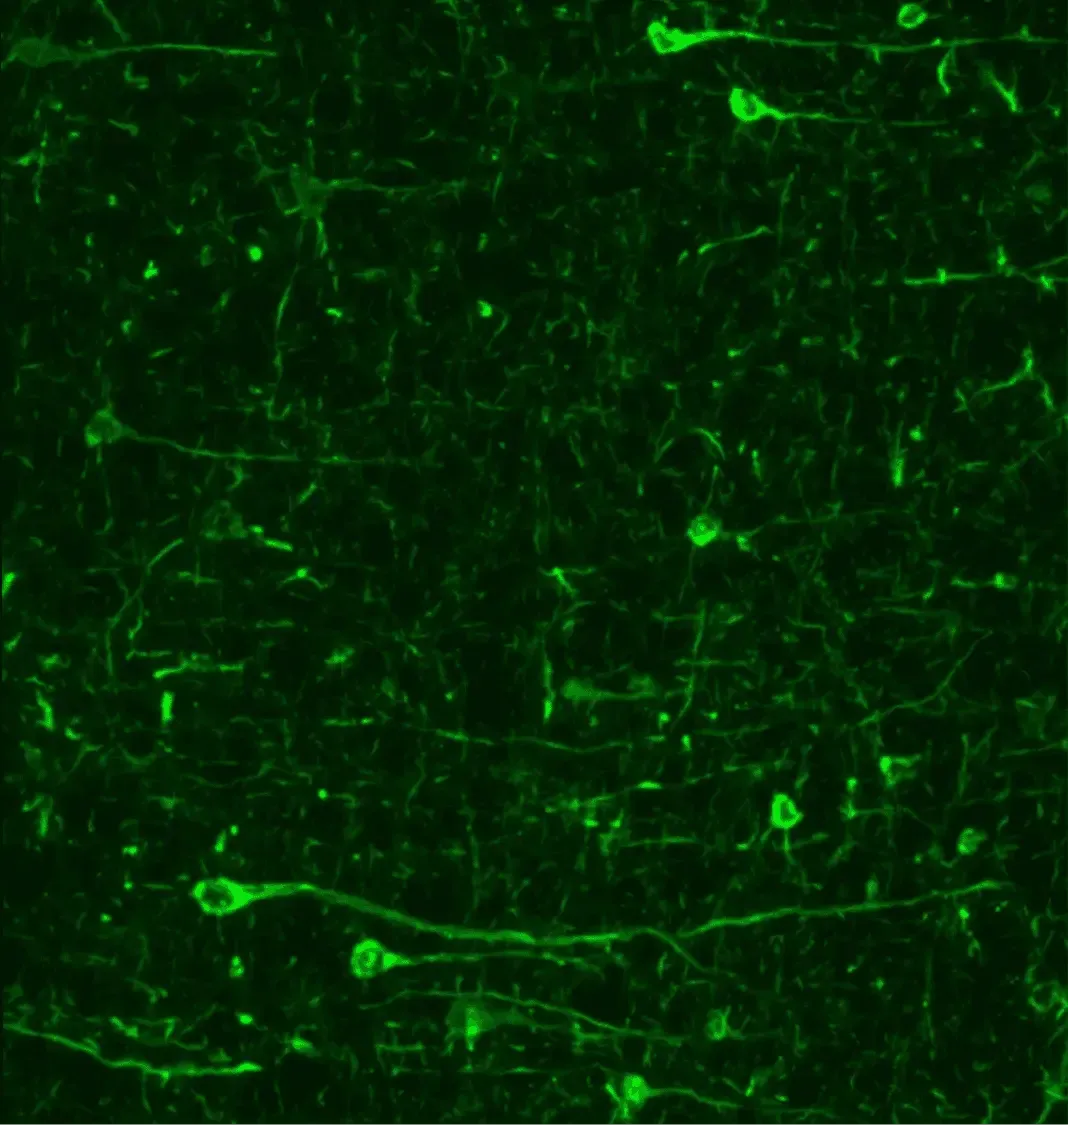
帕金森病动物模型中磷酸化突触核蛋白(pSyn129)的免疫荧光分析显示,该蛋白在神经元胞体及突触中显著富集。
α-突触核蛋白聚集物
错误折叠的α-突触核蛋白聚集物是人类帕金森病的关键病理特征。在黑质致密部及其他脑区的多巴胺能神经元中,可观察到路易小体和路易神经突。这种错误折叠的α-突触核蛋白病理遵循特定的时空进展模式(Braak, 2003)。
在我们采用AAV和PFF诱导的帕金森病动物模型中,观察到:
- 神经元胞体及突触中磷酸化α-突触核蛋白水平显著升高
- PFF模型中病理的强力播种与扩散
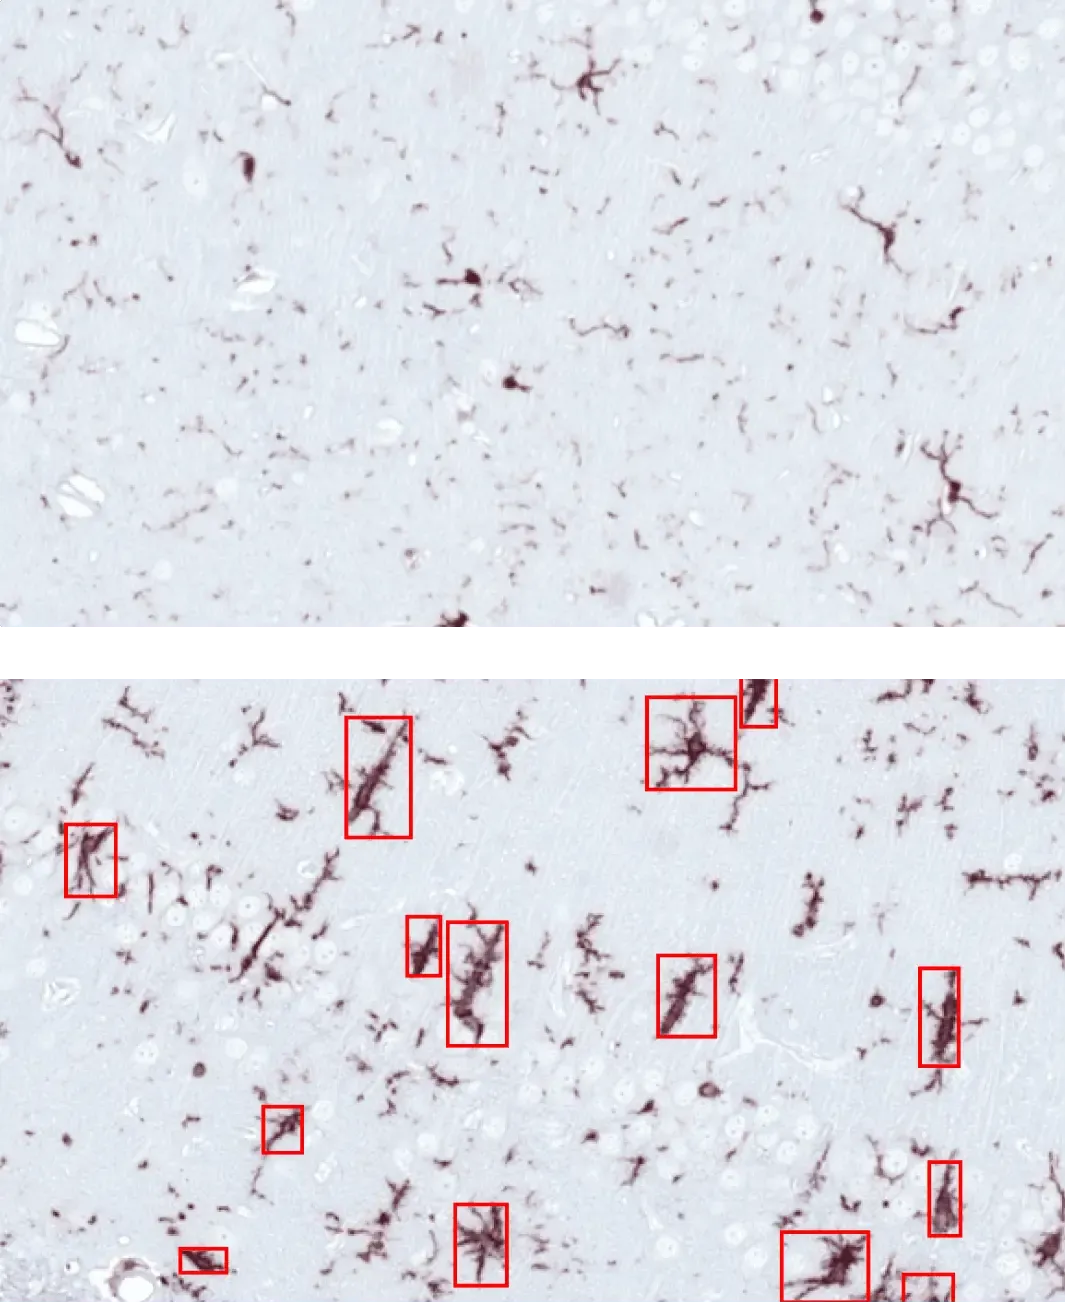
向AON注射PBS(上)或α-突触核蛋白PFFs(下)的小鼠海马区中活化的胶质细胞(红色方框)。
活化小胶质细胞与反应性星形胶质细胞
神经炎症是帕金森病的关键病理特征,其中活化小胶质细胞与反应性星形胶质细胞在发病机制中发挥核心作用(Kam, 2020;Chen, 2023)。
在我们构建的AAV和PFF诱导的帕金森病小鼠模型中,我们观察到:
- 神经炎症反应呈现独特时空分布模式
- 通过自主研发的计算机视觉、机器学习及 深度学习算法检测到的微胶质细胞与星形胶质细胞形态改变
详见我们的神经炎症研究计划:小胶质细胞、星形胶质细胞与神经退行性疾病
参见创新成果:帕金森病α-突触核蛋白小鼠模型中的小胶质细胞激活机制
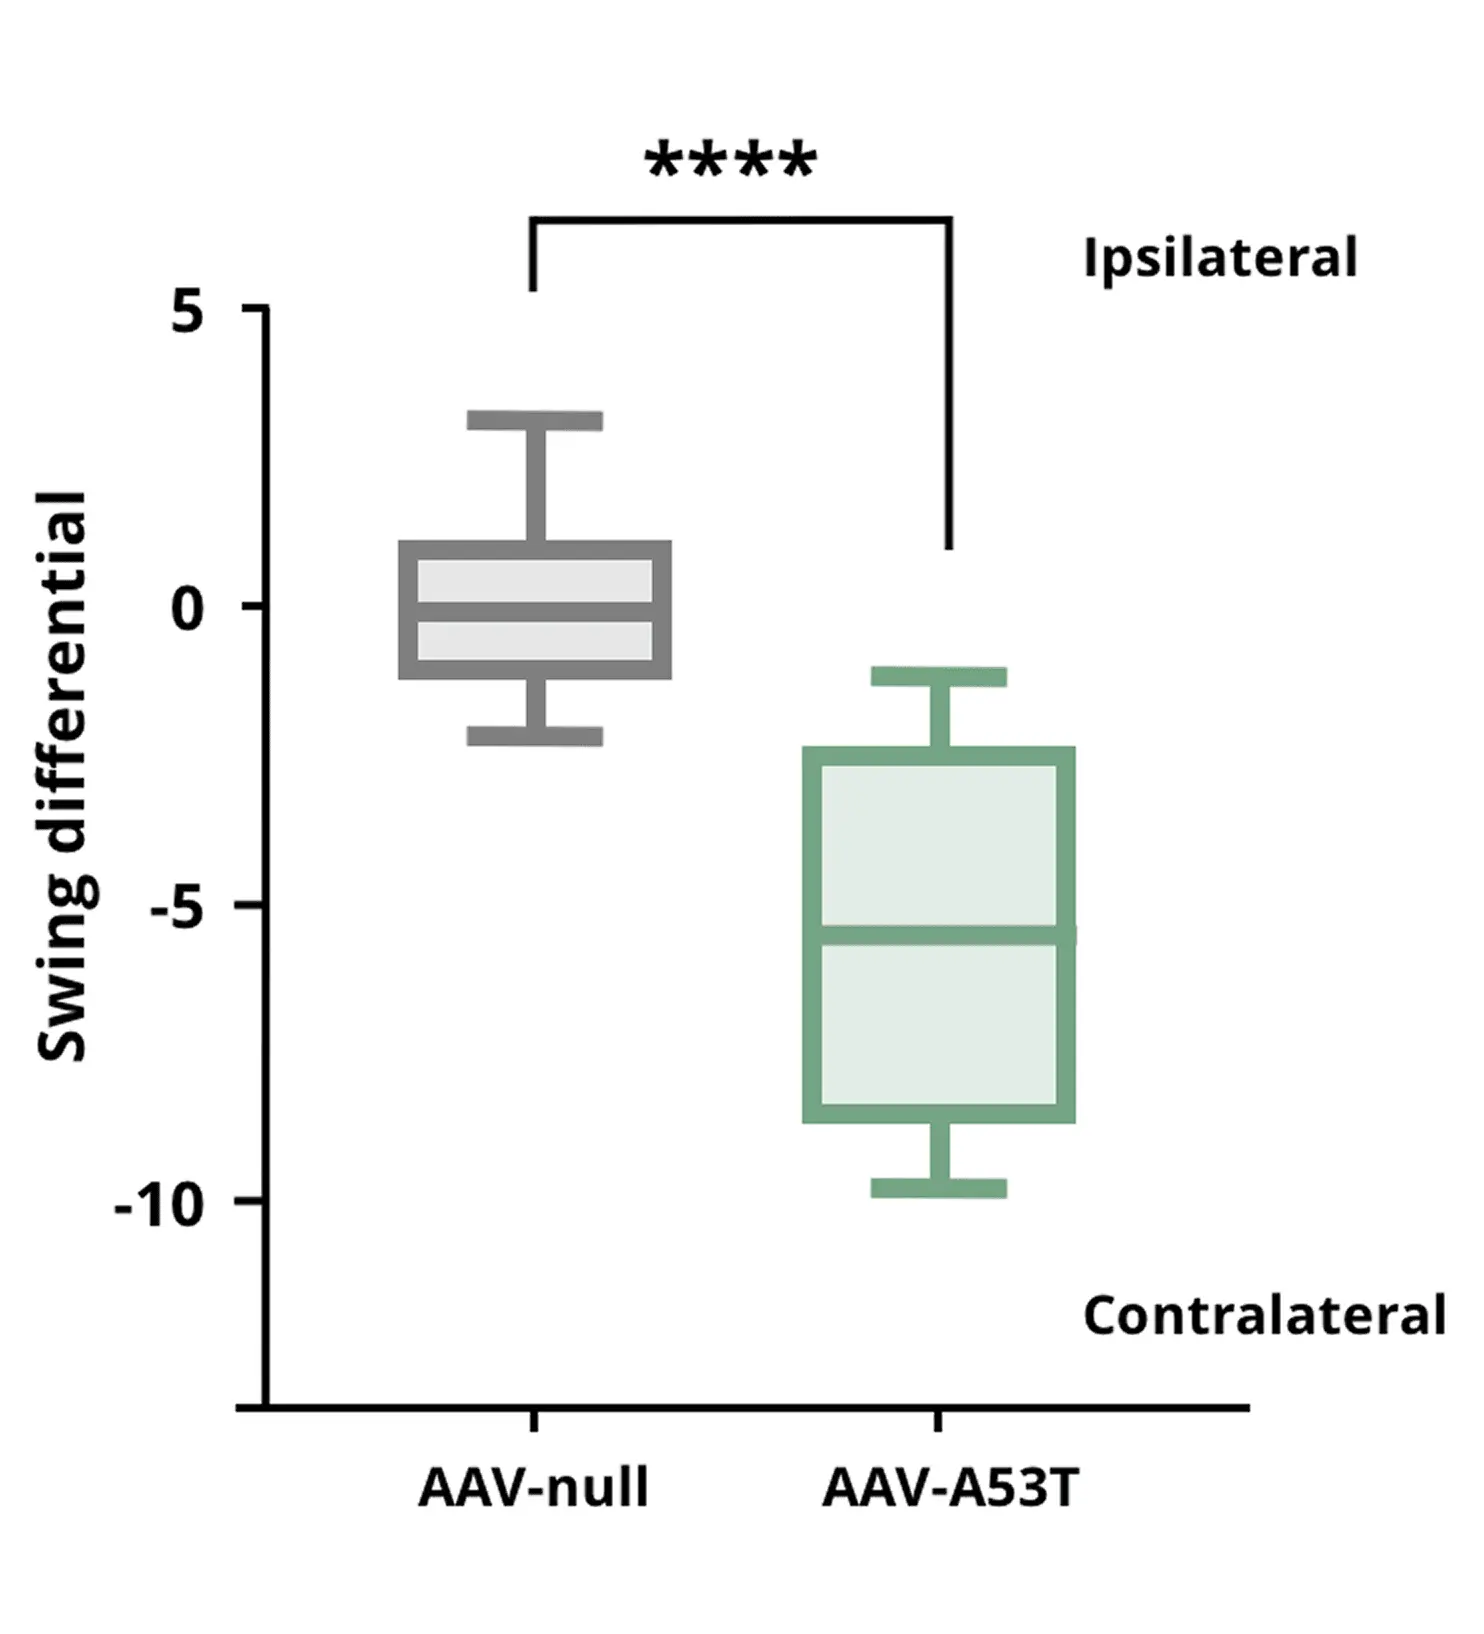
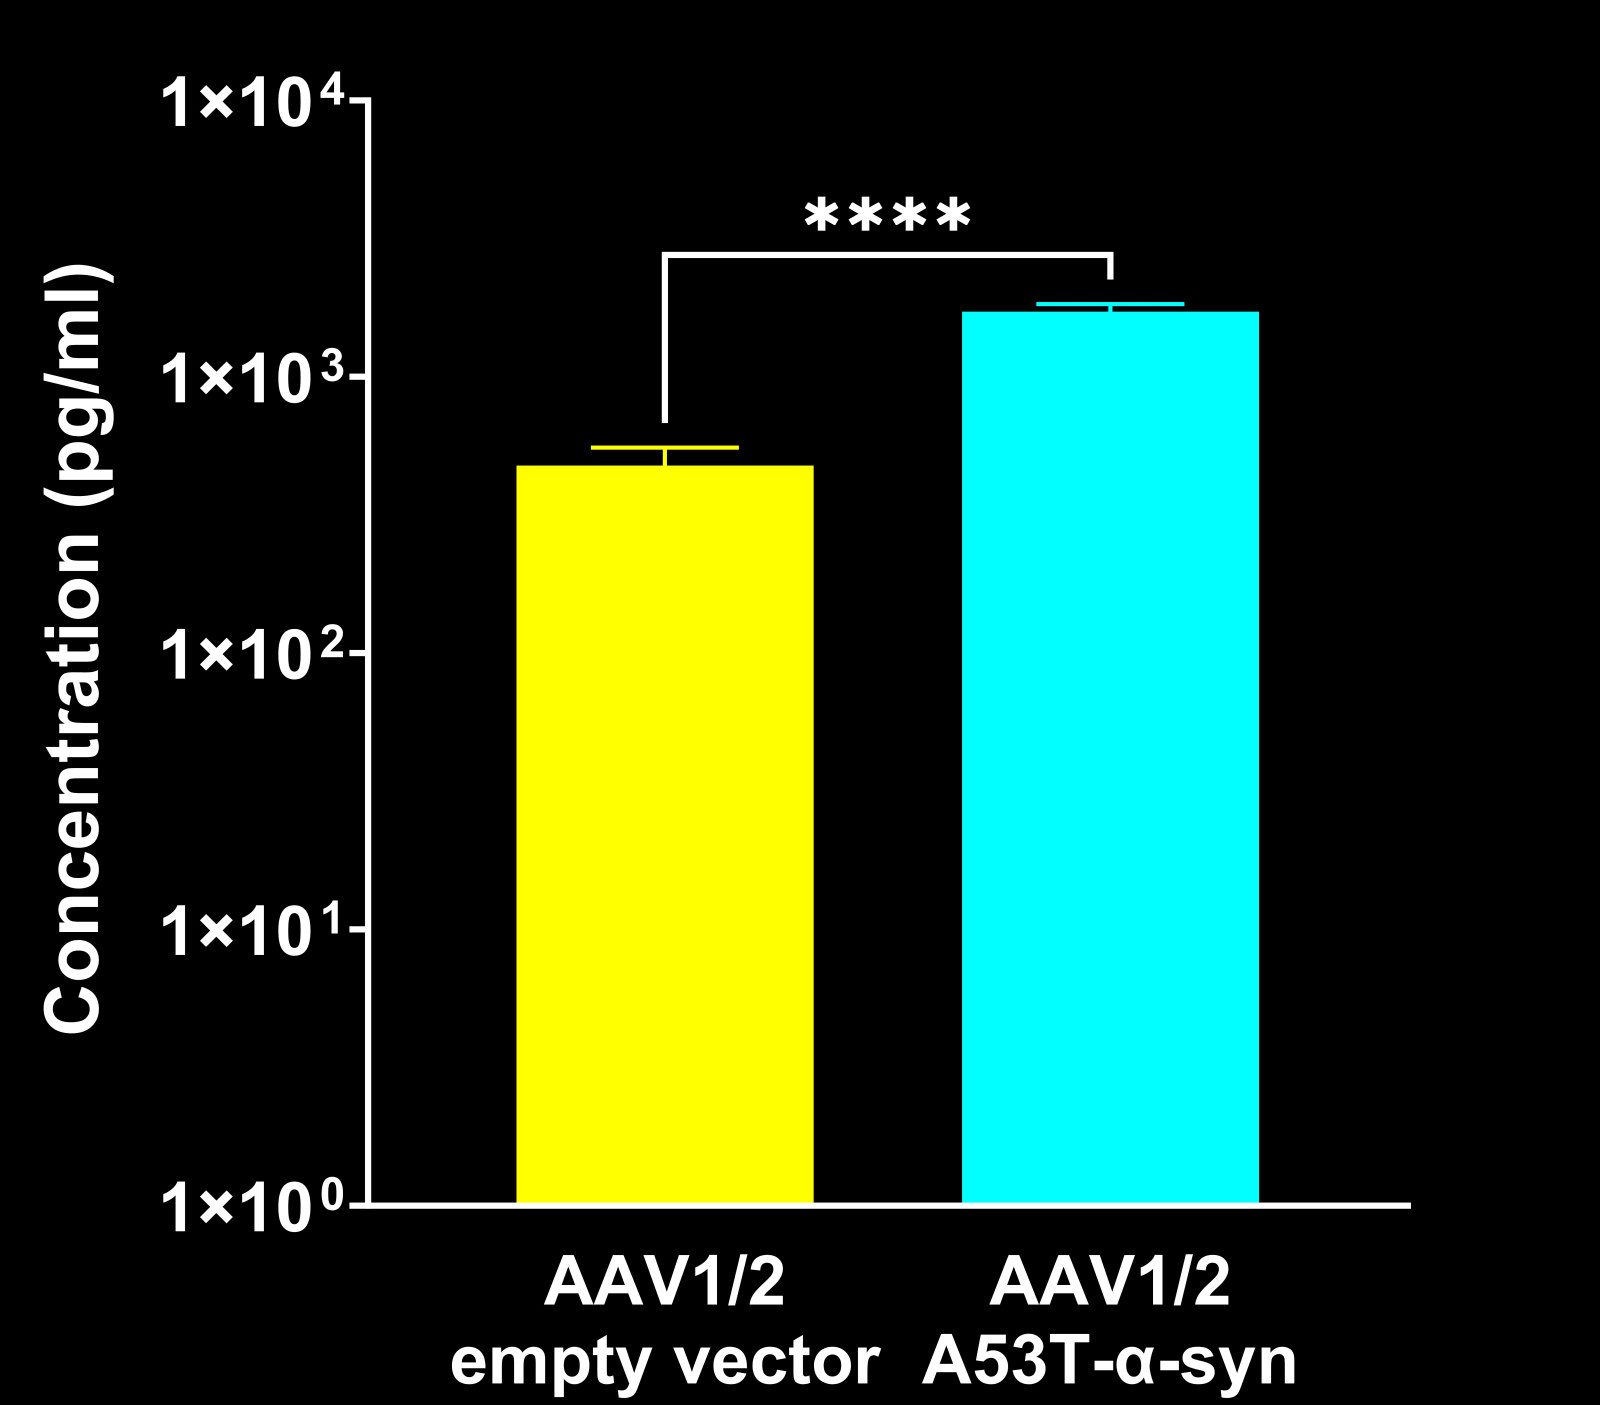
尾悬摆动测试显示,与AAV阴性对照组小鼠相比,AAV-A53T α-syn小鼠因单侧多巴胺能功能缺损而呈现增强的对侧摆动。
**** p<0.0001。
多巴胺能神经元丧失与运动功能障碍
锥体外系运动症状是帕金森病的标志性特征,主要由黑质致密部(SNc)多巴胺能神经元丧失及纹状体去神经支配(如尾状核和 壳核)所驱动。
在我们的帕金森病模型中,通过以下方式靶向黑质致密部诱导病理变化:
- 过表达α-突触核蛋白的腺相关病毒(AAV),或
- α-突触核蛋白预成型纤维(PFFs)
参见资源:预成型纤维——细胞与动物模型指南
这些干预措施导致:
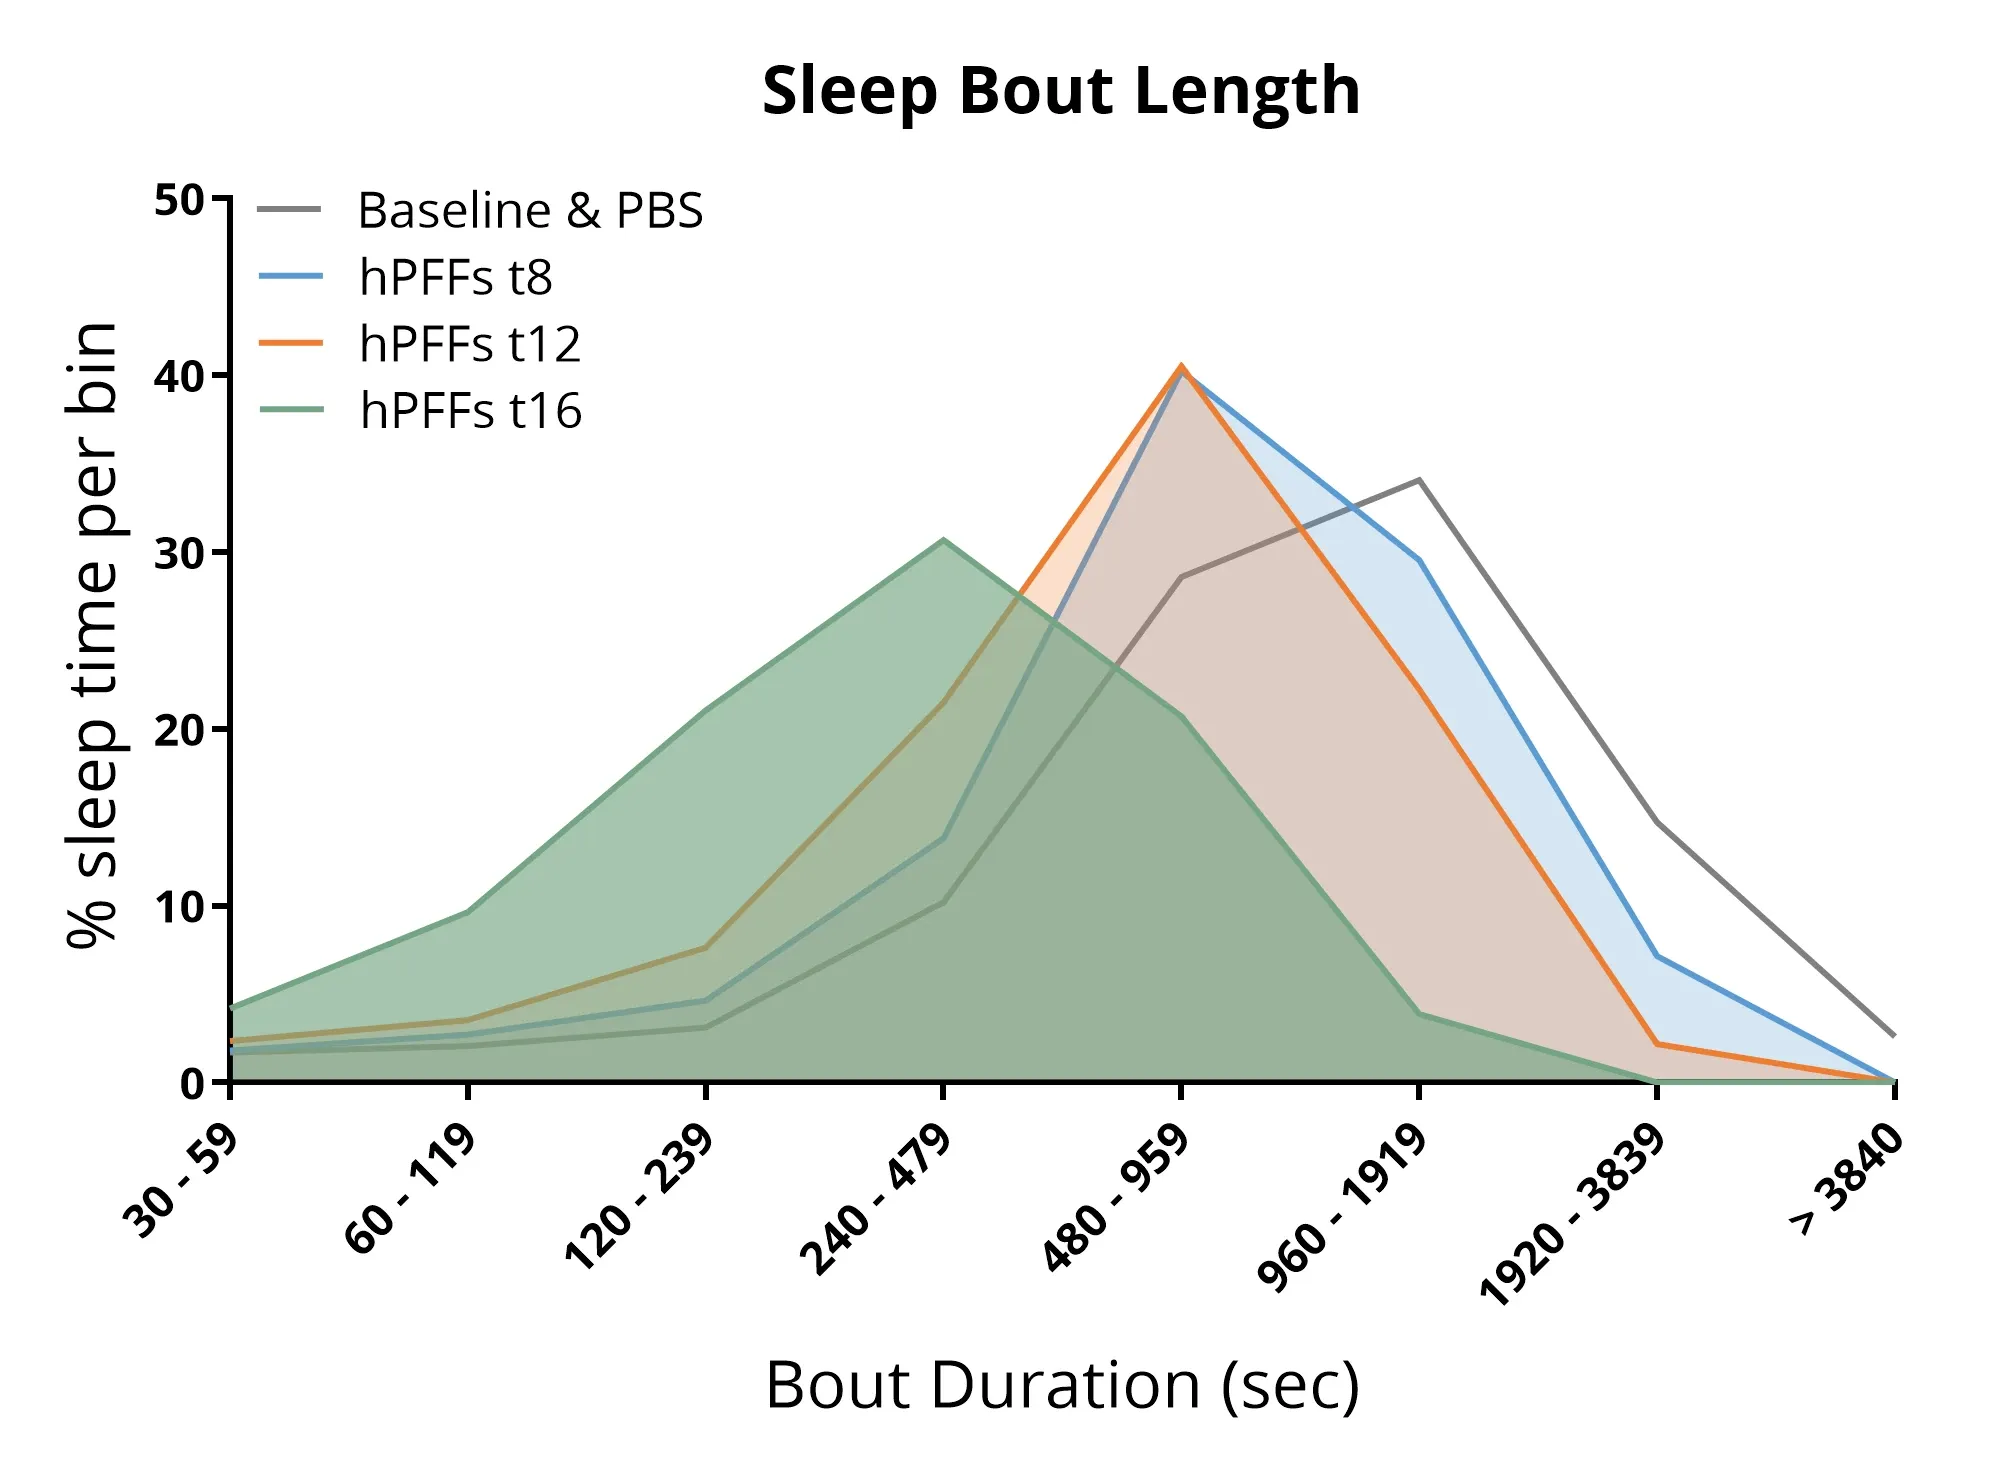
睡眠分析显示,向AON区域注射α-syn PFFs的小鼠呈现睡眠结构紊乱,包括睡眠周期缩短及总睡眠时间减少。
睡眠障碍
睡眠障碍是帕金森病最常见的非运动症状之一,影响高达约85%的患者(Stefani, 2020;Asadpoordezaki, 2025)。
通过在帕金森病小鼠模型中应用非侵入性睡眠监测系统,我们证实:
- 向 A53T转基因小鼠 的AON区域注射α-突触核蛋白PFF会导致:
- 睡眠-觉醒结构 改变
- 总睡眠比例 变化
- 睡眠片段时长紊乱
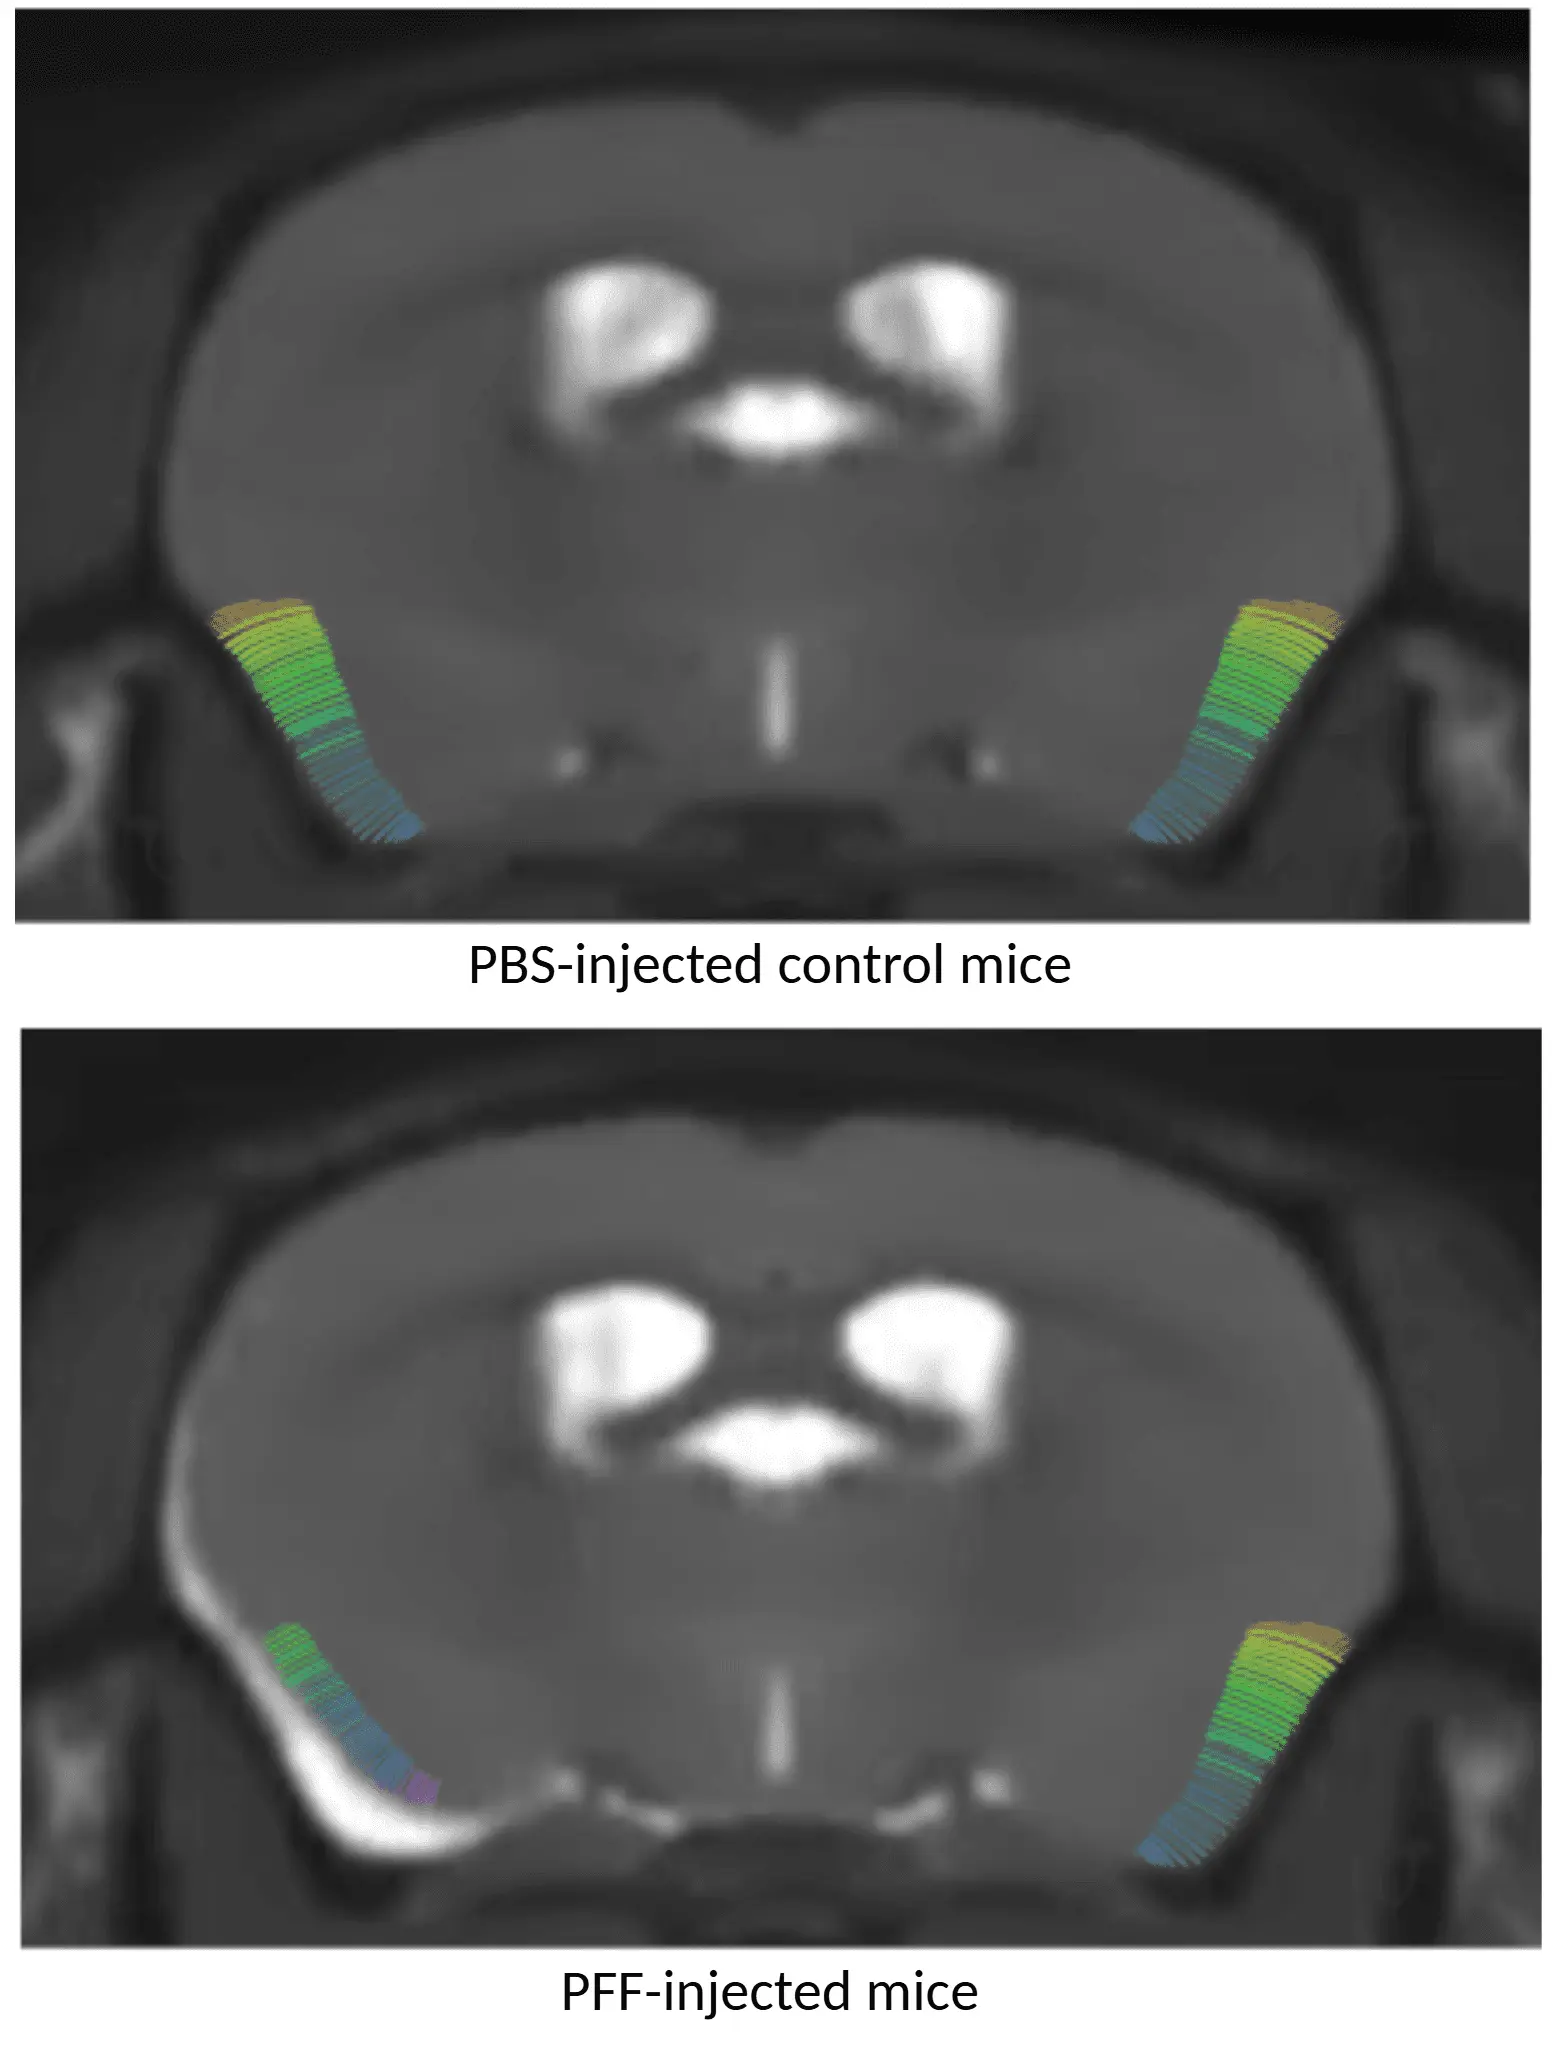
MRI皮层厚度图显示:顶部为注射PBS的小鼠,底部为注射AON α-syn PFF的小鼠,其中接受PFF处理的动物呈现皮层变薄现象。
区域性脑萎缩
多模态脑成像生物 标志物在帕金森病临床试验中应用广泛。基于MRI测量的区域神经解剖体积与皮层厚度,是帕金森病脑萎缩的敏感指标(Tremblay, 2021;Abdelgawad, 2023)。
通过结合全脑高分辨率解剖MRI采集与先进的全自动图像处理分析技术,我们证实:
- 在AAV和PFF诱导的帕金森病小鼠模型中均可重现区域性脑萎缩
详见创新成果:神经退行性疾病小鼠模型脑萎缩分析
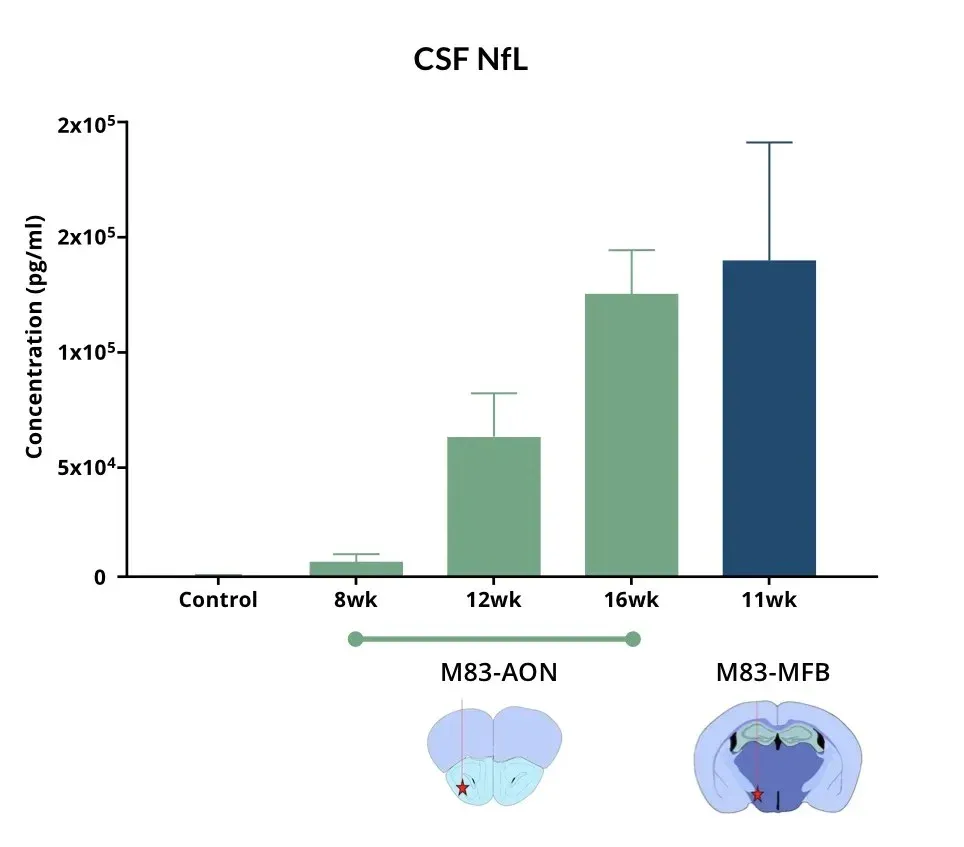
与对照组小鼠相比,AON和MFB区域注射α-Syn PFF的小鼠其脑脊液中神经丝轻链(NF-L)水平升高。
脑脊液与血浆中神经丝轻链水平升高
神经丝轻链(NF-L)在帕金森病患者的脑脊液和血浆中呈升高状态,常被用作帕金森病临床试验中的体液生物标志物(Bäckström, 2020;Urso, 2023;Pedersen, 2024)。在多个帕金森病前临床模型中,也观察到NF-L水平升高的现象。
在我们建立的帕金森病小鼠模型中观察到:
- 在向以下部位注射人α-突触核蛋白蛋白纤维折叠(PFF)后,M83+/-转基因小鼠血浆和脑脊液中NF-L显著升高:
- 嗅球前核(AON)
- 中前脑束(MFB)
详见资源:帕金森病模型中的神经丝轻链
PFF和AAV α-突触核蛋白啮齿动物模型的病理学与表型特征是什么?
下表总结了各模型对人类帕金森病标志性特征的再现程度,便于针对特定研究问题快速比较其适用性。
病理学
本表列举了关键的帕金森病相关病理特征——如α-突触核蛋白聚集、神经炎症及多巴胺能神经元丧失——并比较了这些特征在PFF和小鼠AAV诱导模型中的表现强度。
功能特征
本表比较了与帕金森病病理相关的行为和生理障碍,包括运动缺陷和睡眠-觉醒紊乱,突出了不同小鼠模型的差异。
生物标志物
本表汇总了与疾病进展相关的非侵入性影像学及体液生物标志物。这些生物标志物为评估神经退行性病变及在PFF和AAV诱导动物模型中评估治疗效果提供了定量终点。
|
特征/领域 |
PFF模型 |
AAV模型 |
|
✔️ |
✔️ | |
|
✔️ |
✔️ |
总结:PFF和AAV α-突触核蛋白模型均呈现显著的α-突触核蛋白病理特征,其中PFF模型表现出典型的种子形成与时空扩散模式。两种模型均观察到神经炎症反应,但AAV模型中多巴胺能神经元丧失通常更为严重且具有区域选择性。 两种模型均出现运动功能障碍,但AAV模型发病更早且程度更重,且尚未评估其睡眠相关表型。基于MRI的脑萎缩及NF-L升高在两种小鼠模型中均可作为神经退行性变的临床转化生物标志物。
帕金森病小鼠模型的特征有哪些?
下方的"图像交互"功能可供您探索我们对AAV-A53T-Synuclein小鼠模型的表征,包括体内实验数据及高分辨率的多重免疫荧光组织切片图像。
您可通过左侧面板轻松浏览"图像故事"。
使用鼠标左键可在高分辨率显微图像中自由平移。通过 鼠标/触控板(上/下滚动)或左上角的+/-按钮可实现图像缩放。 右 上角控制面板支持 切换通道/分割结果的显示状态、调整颜色配置及图像参数。
建议使用 全屏模式以获得 最佳交互体验。


Characterization of our AAV-A53T-Synuclein mouse model, including in vivo data and high-resolution images of entire Multiplex Immunofluorescence tissue sections.
Share link to
 Click to copy link
帕金森病动物模型综述:PFF与AAV α-突触核蛋白模型的比较
PFF与AAV α-突触核蛋白啮齿动物模型共同构成了研究帕金森病机制及评估治疗策略的互补平台。两者均能重现该疾病的核心病理特征,包括强烈的α-突触核蛋白聚集和可测量的神经炎症,但在关键表型的表达和进展方面存在差异。 PFF模型为研究病理播种与扩散提供了有力框架,而AAV模型则呈现更显著的区域性选择性多巴胺能神经元丧失,伴随更早发且更严重的运动功能障碍。尽管AAV模型尚未评估睡眠相关表型,但两种模型均支持采用MRI脑萎缩检测及生物体液中神经纤维长链蛋白(NF-L)水平作为神经退行性变的转化生物标志物。 综合而言,这些模型能够在多样化的实验目标中,对帕金森病相关通路及治疗效果进行全面评估。
了解更多关于我们帕金森病小鼠模型的表征、经验证的测量方法以及我们提供的临床前神经科学合同研究组织服务。
相关内容
有关帕金森病的最新信息,以及在帕金森病动物模型中评估治疗药物的最佳实践。
预成型纤维素——细胞与动物模型指南
预成型纤维诱导的细胞与动物模型综述:用于多种神经退行性疾病中改变疾病进程疗法的临床前测试。
小胶质细胞、星形胶质细胞与α-突触核蛋白在帕金森病中的作用
α-synuclein在帕金森病及其他α-synuclein相关疾病中对小胶质细胞和星形胶质细胞的影响。
帕金森氏病药物研发的α-Synuclein模型
腺相关病毒(AAV)在小鼠和大鼠模型中诱导α-突触核蛋白表达的概述,用于疾病治疗药物的临床前研究。
帕金森病模型中的神经丝轻链
神经丝轻链(NfL;NF-L)水平如何作为帕金森病小鼠和大鼠模型的血液(血浆;血清)和脑脊液生物标志物。
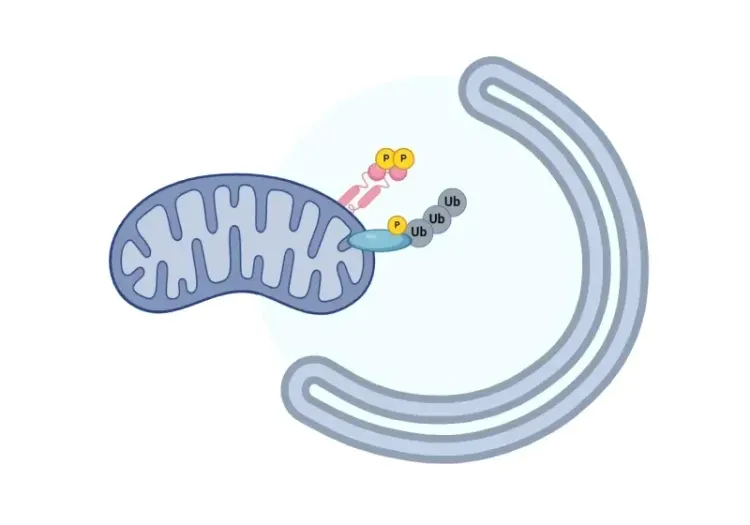
线粒体吞噬与帕金森病
概述受损的线粒体吞噬如何导致帕金森病的神经变性。
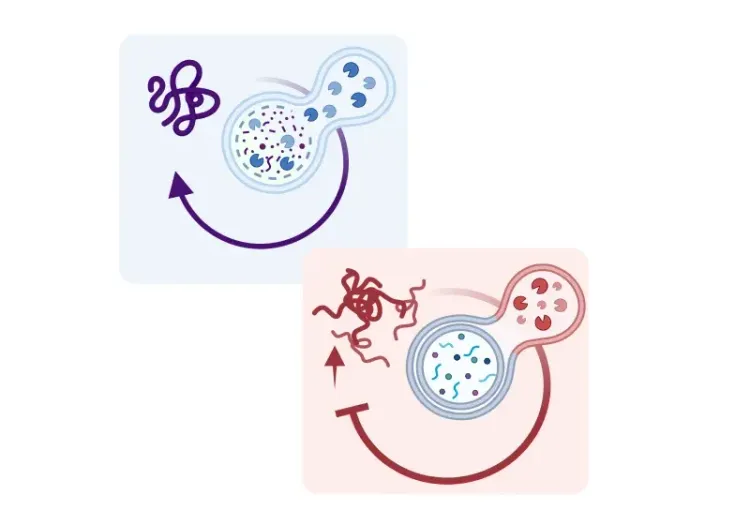
自噬、帕金森氏症和多巴胺能神经元
概述了受损的自动回收功能如何导致帕金森病多巴胺能神经元的病理变化和神经变性。
线粒体功能障碍与帕金森病
概述线粒体功能障碍与帕金森氏病神经退行性病变的关系。