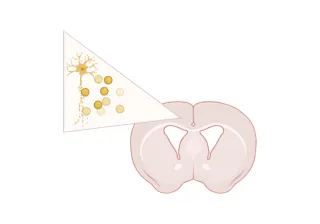
Neurodegeneration & Neuroinflammation in the AAV-Synuclein Mouse Model
모델 개요
바이오스펙티브에서는 인간 파킨슨병의 핵심 특징을 정확히 반영하는 엄격하게 특성화된 설치류 모델을 개발 및 활용합니다. 여기에는 α-시누클레인 응집, 도파민 신경세포 손실, 신경염증, 운동 장애, 수면 장애 등이 포함됩니다. 이러한 모델들은 질병 메커니즘, 병리학적 진행 과정, 초기 치료 효과에 대한 연구를 지원하도록 설계되었으며, 강력한 전환적 관련성을 지닙니다.
당사의 동물 모델 포트폴리오는 재현성, 명확히 정의된 표현형, 그리고 행동학적, 영상학적, 생화학적, 분자생물학적, 조직병리학적 평가 지표의 통합을 중점으로 하여 포괄적인 전임상 평가를 가능하게 합니다. 이러한 과학적 기반을 통해 연구자들은 병인 경로를 탐구하고, 후보 치료법을 평가하며, 신약 개발 노력을 뒷받침할 강력한 데이터를 생성할 수 있습니다.
α-시누클레인 프리폼드 피브릴(PFF) 모델
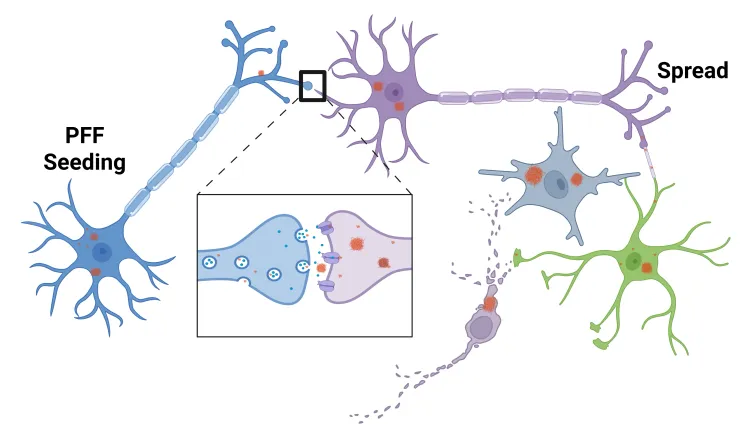
인간 파킨슨병의 특징인 변형된 알파-시누클레인의 병리학적 확산은 α-시누클레인 사전형성 섬유소(PFF) 주사를 통해 동물 뇌에서 모델링될 수 있다. 이 "PFF 시딩 및 확산 모델"은 인간 α-시누클레인을 과발현하는 트랜스제닉 마우스 또는 야생형 마우스나 쥐에서 유도될 수 있다.
알파-시누클레인 PFF 모델 유도
- 재조합 알파-시누클레인 사전형성 섬유소(PFF) 주입
- 적용 대상
- A53T 알파-시누클레인을 과발현하는 M83 형질전환 마우스
- 야생형 마우스 또는 쥐
알파-시누클레인 PFF 검증 주입 부위
- 전방 후각핵(AON)
- 중뇌전방다발(MFB)
- 선조체 +/- 상부 대뇌피질
α-시누클레인 PFF 질환 특징 모델링
- 명확히 정의된 시공간 패턴에 따른 α-시누클레인 확산
- 신경염증
- 신경퇴행
- 측정 가능한 행동 장애
- 운동 기능 저하
- 비운동 증상 (예: 수면 장애)
이 알파-시누클레인 PFF 파킨슨병 모델은 질병 수정 치료제 시험에 있어 높은 재현성을 보입니다.
바이오스펙티브는 파킨슨병 알파-시누클레인 PFF 모델을 활용한 전임상 연구 분야에서 10년 이상의 경험을 보유하고 있으며, 다음을 평가합니다:
- 생체 분포
- 표적 결합
- 작용 기전
- 치료 효능
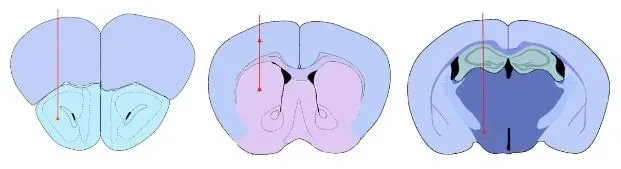
검증된 주사 부위: 전방 후각핵(AON) 선조체 ± 상부 대뇌 피질 내측 전뇌 다발(MFB)
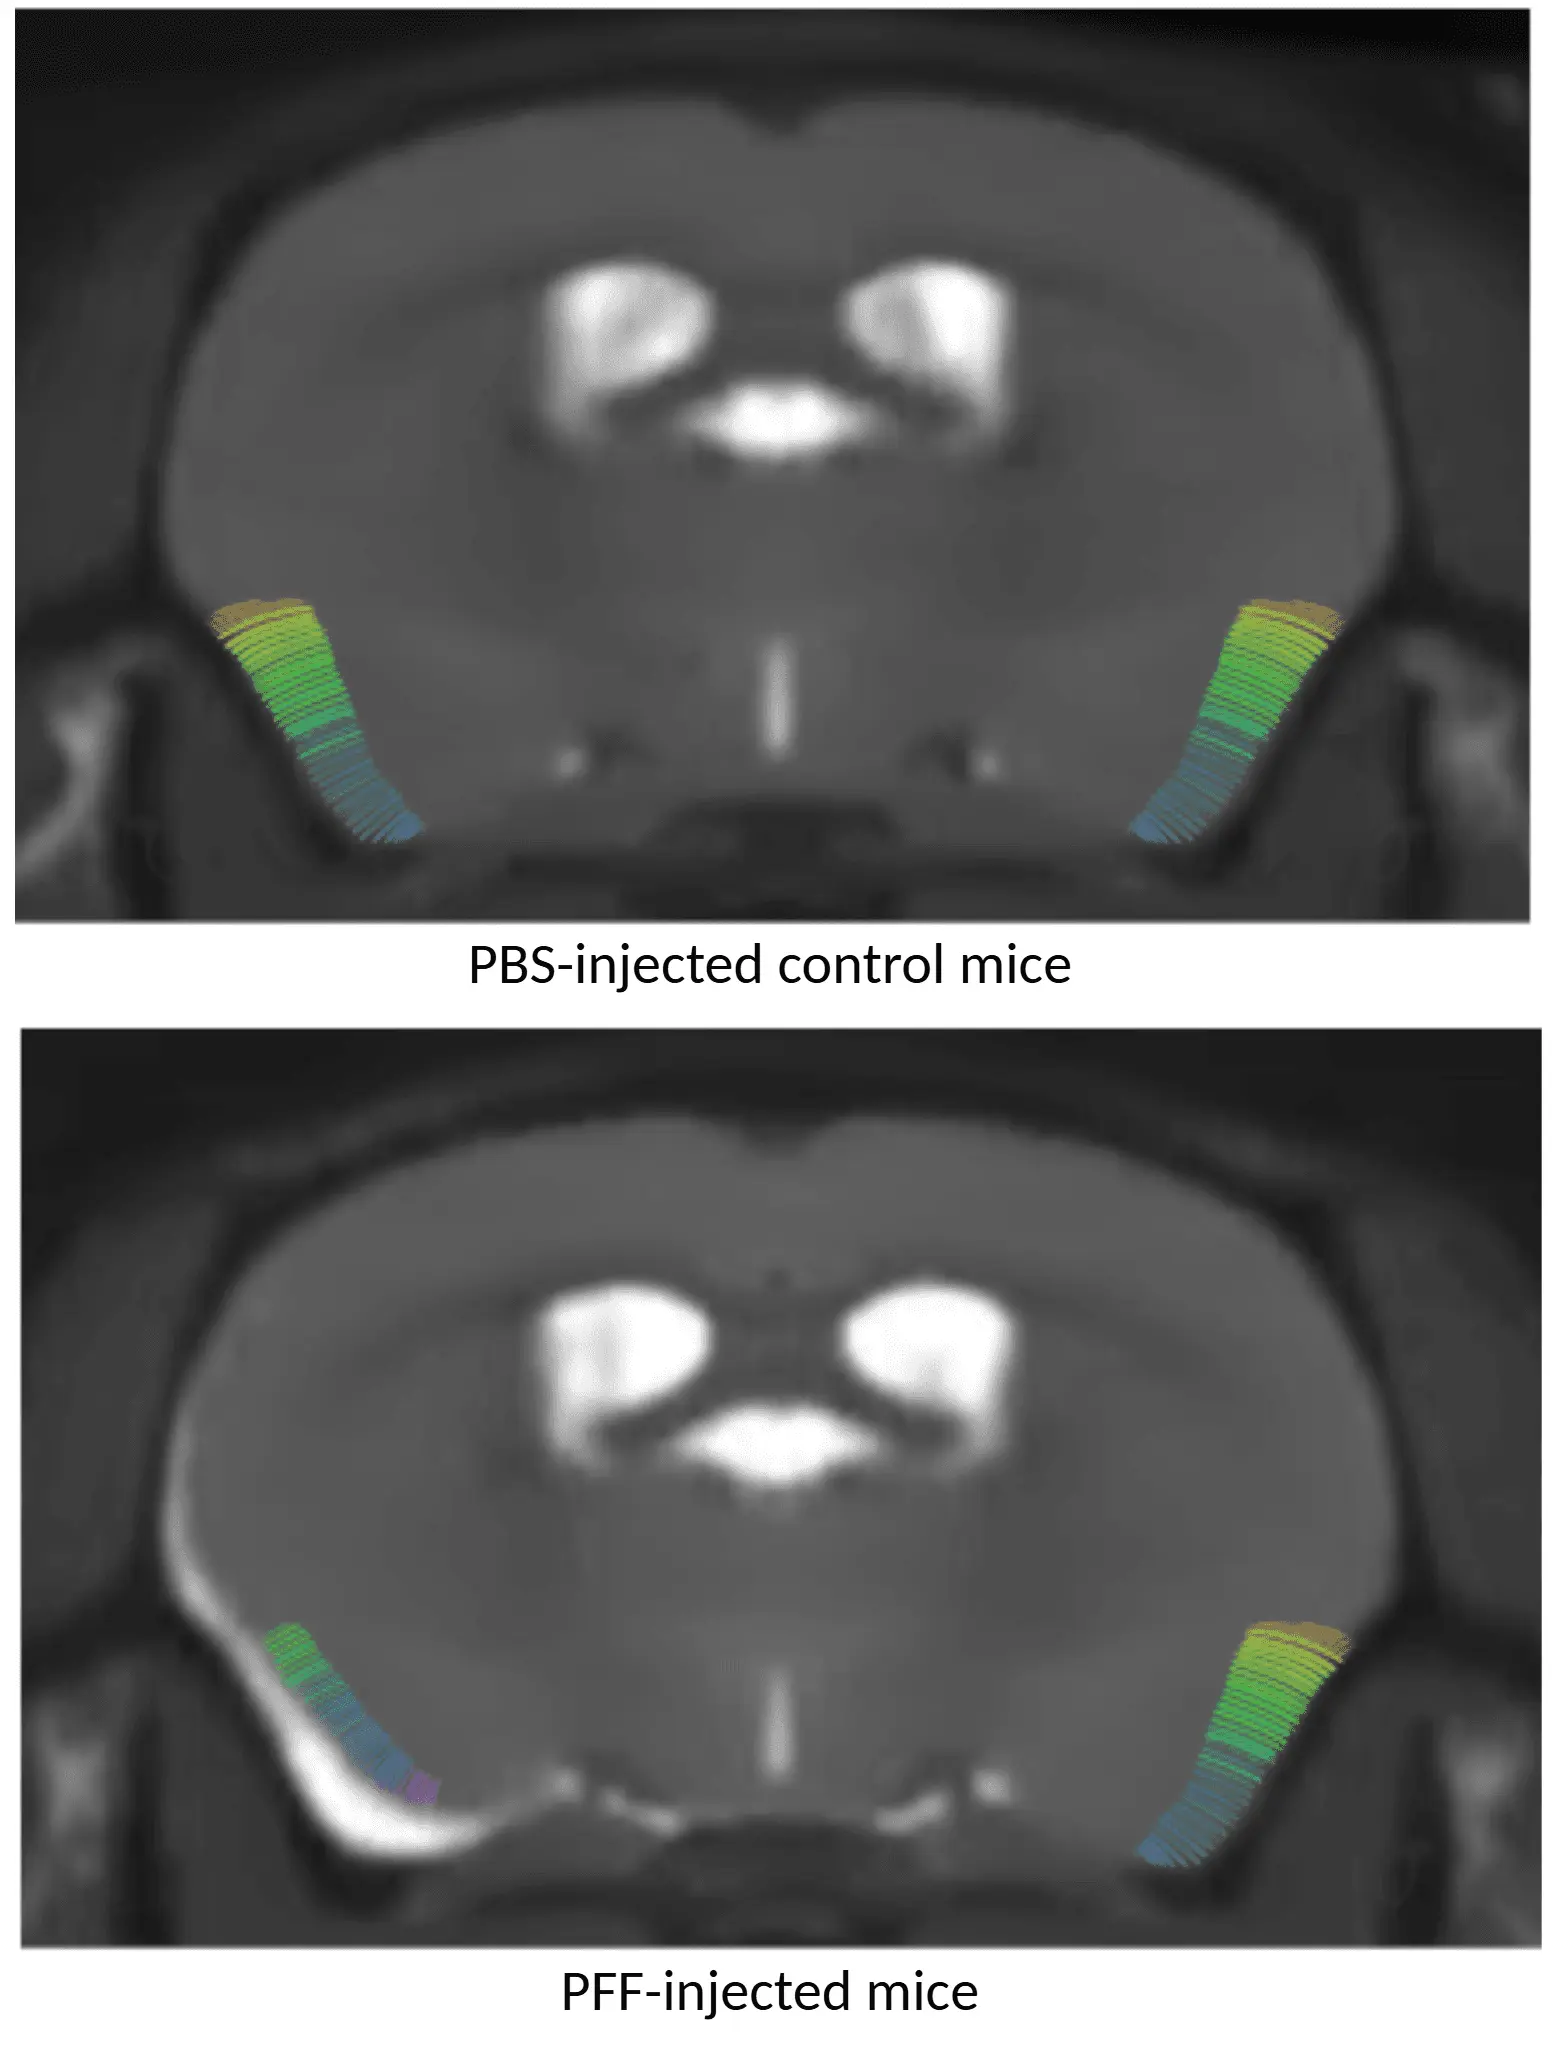
M83+/- 마우스의 AON에 일측성 α-시누클레인 PFF 주입 12주 후, 동측(좌측) 및 대측(우측) 배측 피라미드 피질의 인산화 α-시누클레인(pSyn129) 면역조직화학(IHC) 소견.
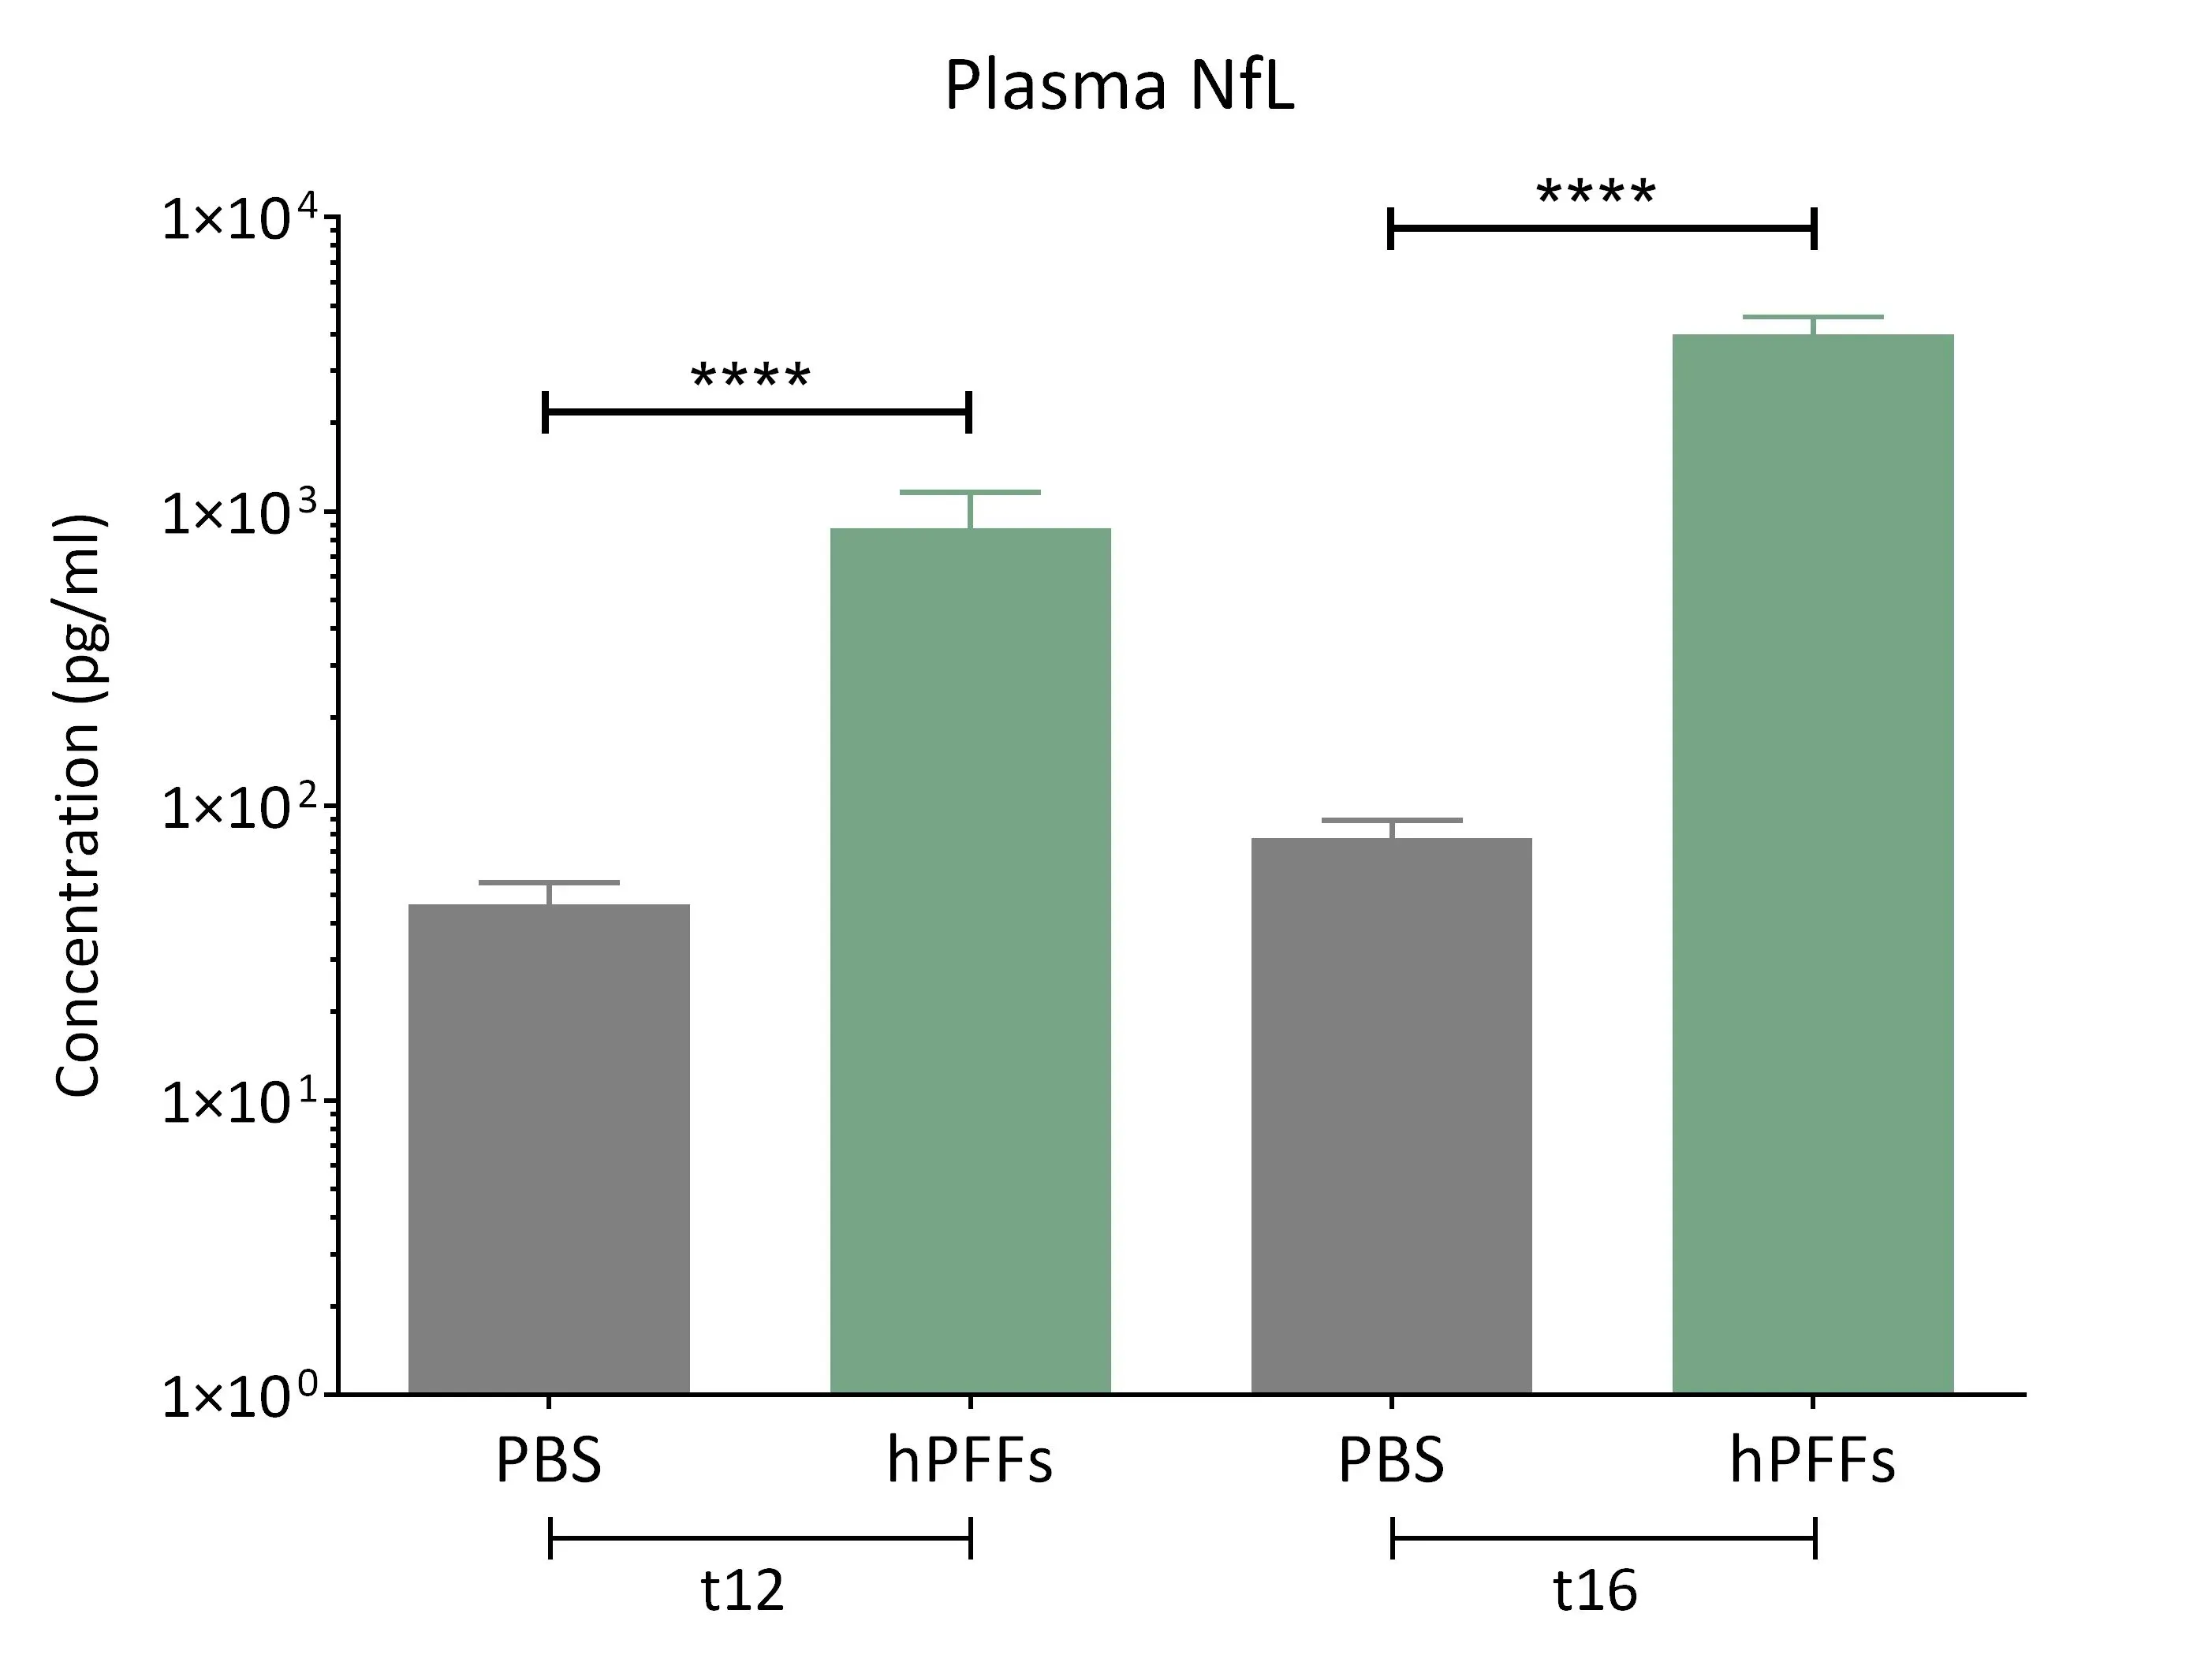
알파-시누클레인 섬유 형성 유도 마우스의 혈장에서는 신경섬유 경량 단백질(NF-L) 수치가 현저히 상승된 것으로 관찰된다.
AAV A53T α-시누클레인 마우스 모델
성체 설치류 뇌에서 α-시누클레인 병리를 유도하기 위해 아데노 관련 바이러스(AAV) 벡터를 주입할 수 있다. 이 파킨슨병 마우스 모델에서는, 야생형(C57BL/6) 마우스 또는 유전자 조작 모델에 대해 전문가들이 자동화된 마이크로 주입기가 장착된 디지털 정위 장치(높은 정확도와 정밀도를 위해)를 사용하여 흑질 밀집부 근처에 A53T 돌연변이 인간 알파-시누클레인을 과발현하는 AAV 벡터를 정위 주입합니다.
AAV-A53T α-시누클레인 모델 유도
- A53T 돌연변이 인간 α-시누클레인을 과발현하는 아데노 관련 바이러스(AAV) 벡터의 정위 주입
AAV-A53T α-시누클레인 검증된 주입 부위
- 흑질 밀집부(SNc)
AAV-A53T α-시누클레인 질환 특징 모델링
- 흑질(SNc) 내 도파민성 뉴런 손실 및 동측 선조체 신경절단
- 흑질 및 선조체 내 인산화 α-시누클레인 응집체
- 신경염증
- 신경퇴행
- 측정 가능한 일측성 운동 장애
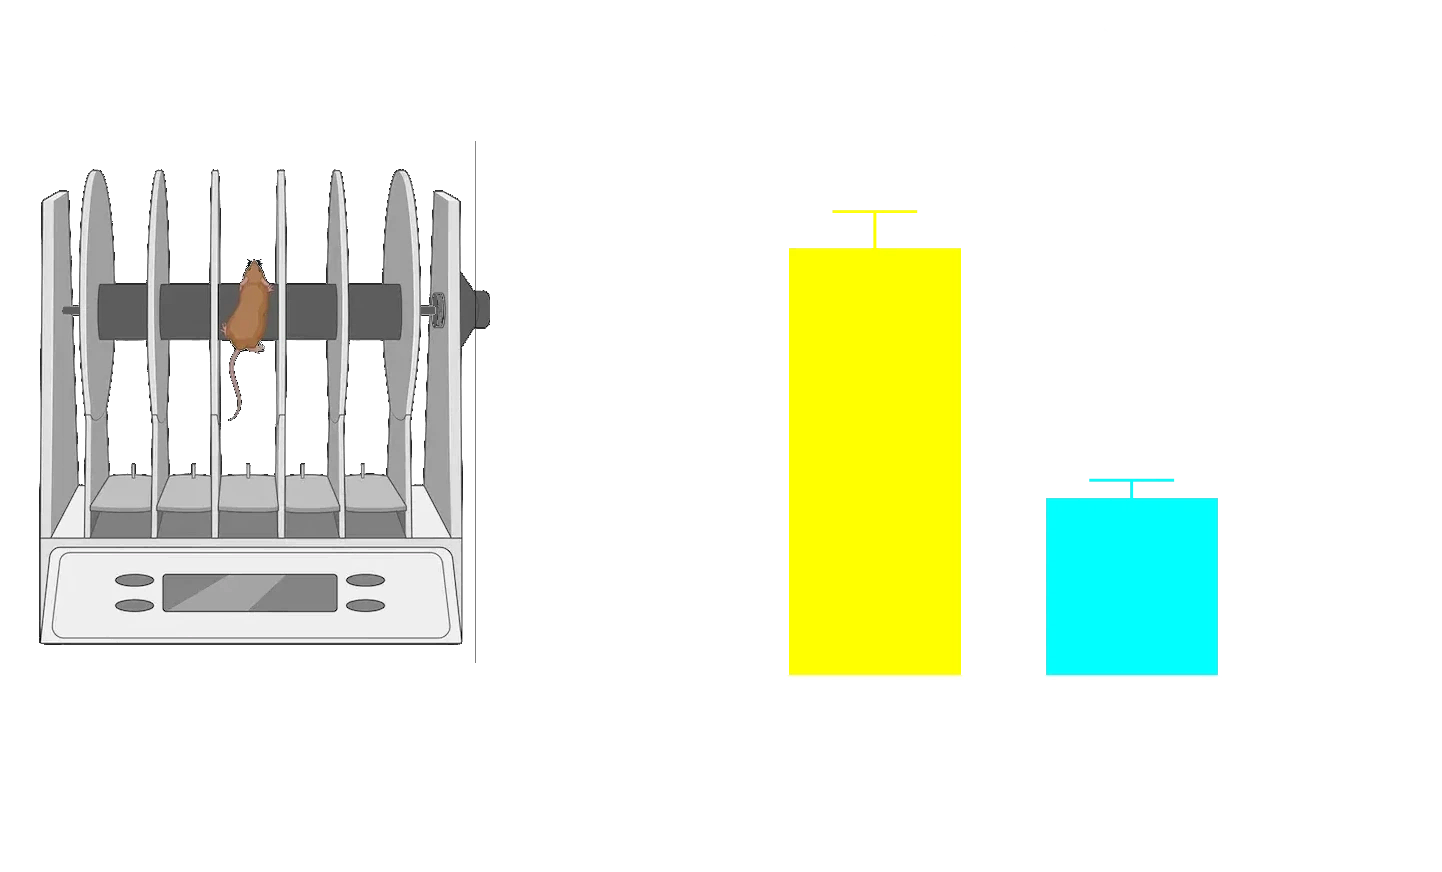
- 회전봉 검사(Rotarod test)
- 꼬리 매달기 흔들기 검사(TSST)
- 실린더 테스트
- 후지 포착 테스트
바이오스펙티브에서는 이러한 AAV-A53T α-시누클레인 모델에 대해 비침습적 영상 연구(예: MRI 체적 측정, [18F]FDG PET, [18F]DOPA PET)를 수행하여 임상적 전환이 가능한 영상 바이오마커(예: 국소 뇌 위축, 뇌 포도당 대사 저하, 도파민성 말단 손실)를 생성할 수 있습니다.
AAV-A53T α-시누클레인 파킨슨병 모델은 치료제(예: 소분자, ASO, 유전자 치료제, 생물학적 제제)가 파킨슨병과 관련된 병리적 기전 및 기능 장애에 미치는 영향을 연구하기에 적합한 강력하고 유연한 시스템을 제공합니다.
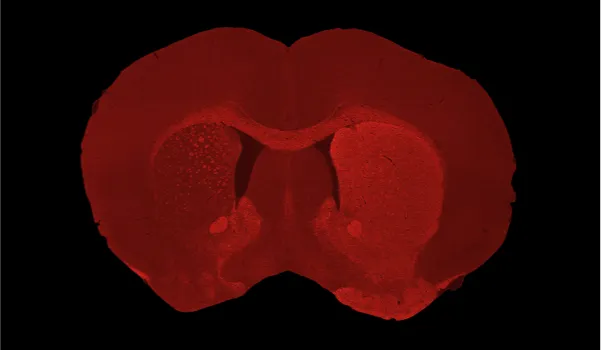
C57BL/6 마우스의 흑질(substantia nigra pars compacta, SNc)에 AAV-hA53Tα-Syn을 단측 주입한 후 동측(좌측 반구)의 꼬리핵-피질핵(caudate-putamen)에서 관찰된 심각한 도파민성 뉴런 손실 및 도파민성 신경절단(denervation).
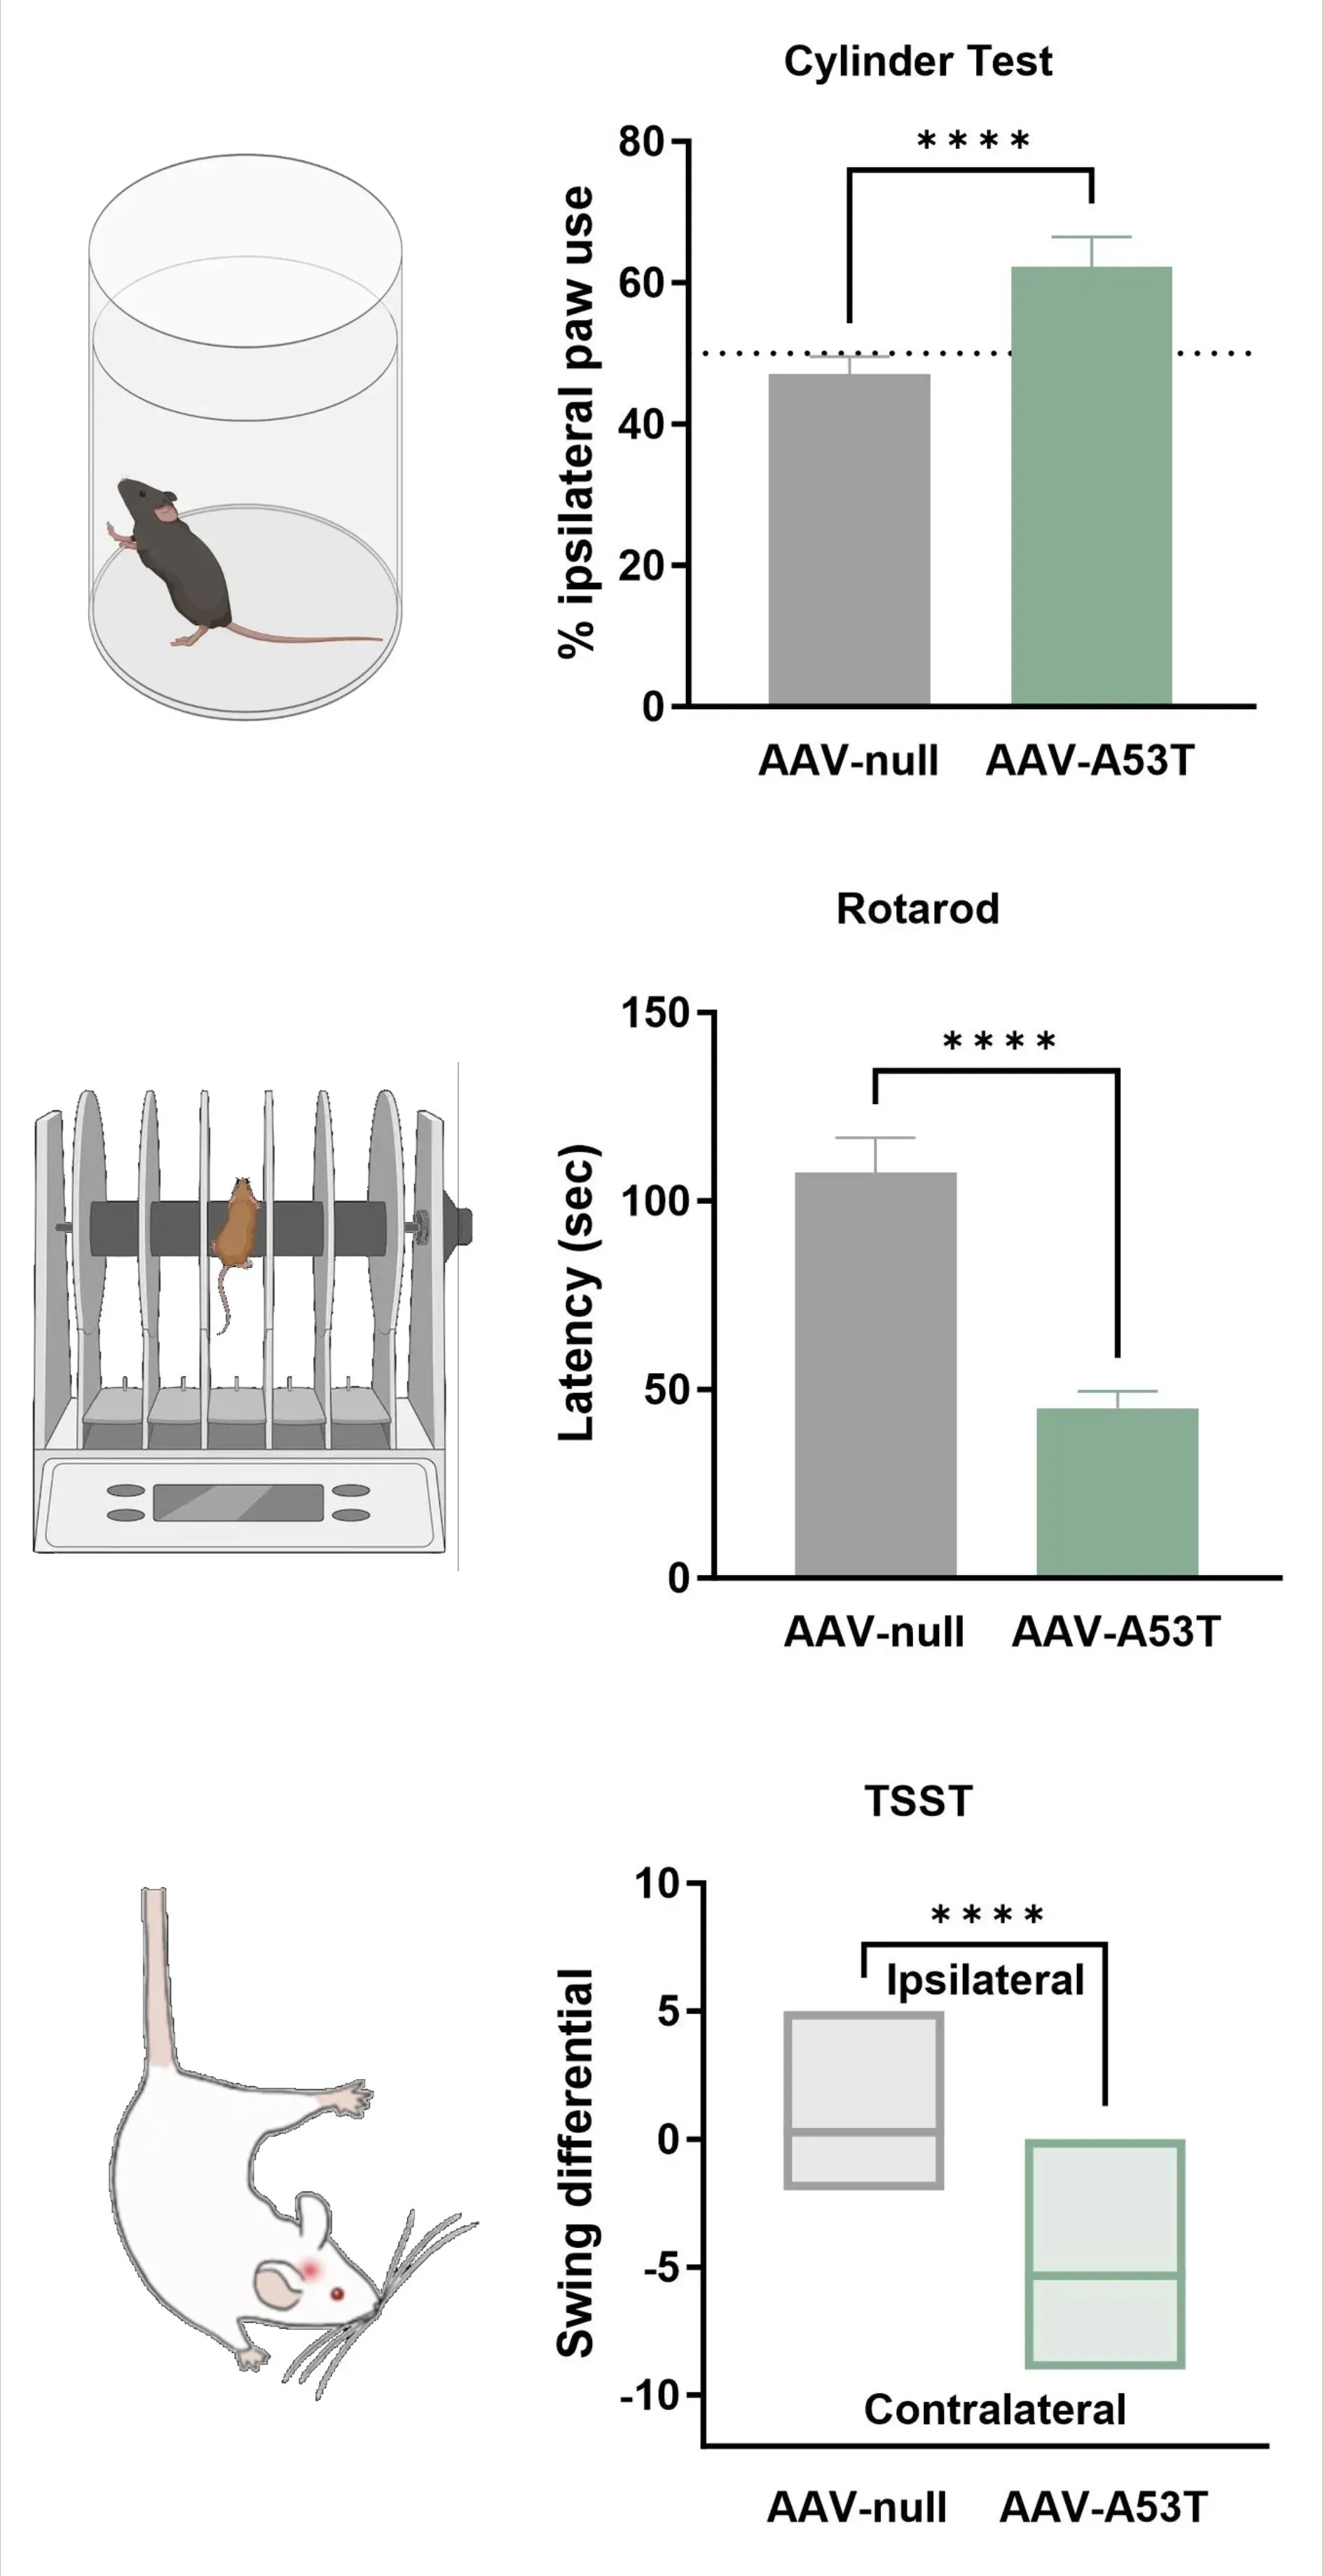
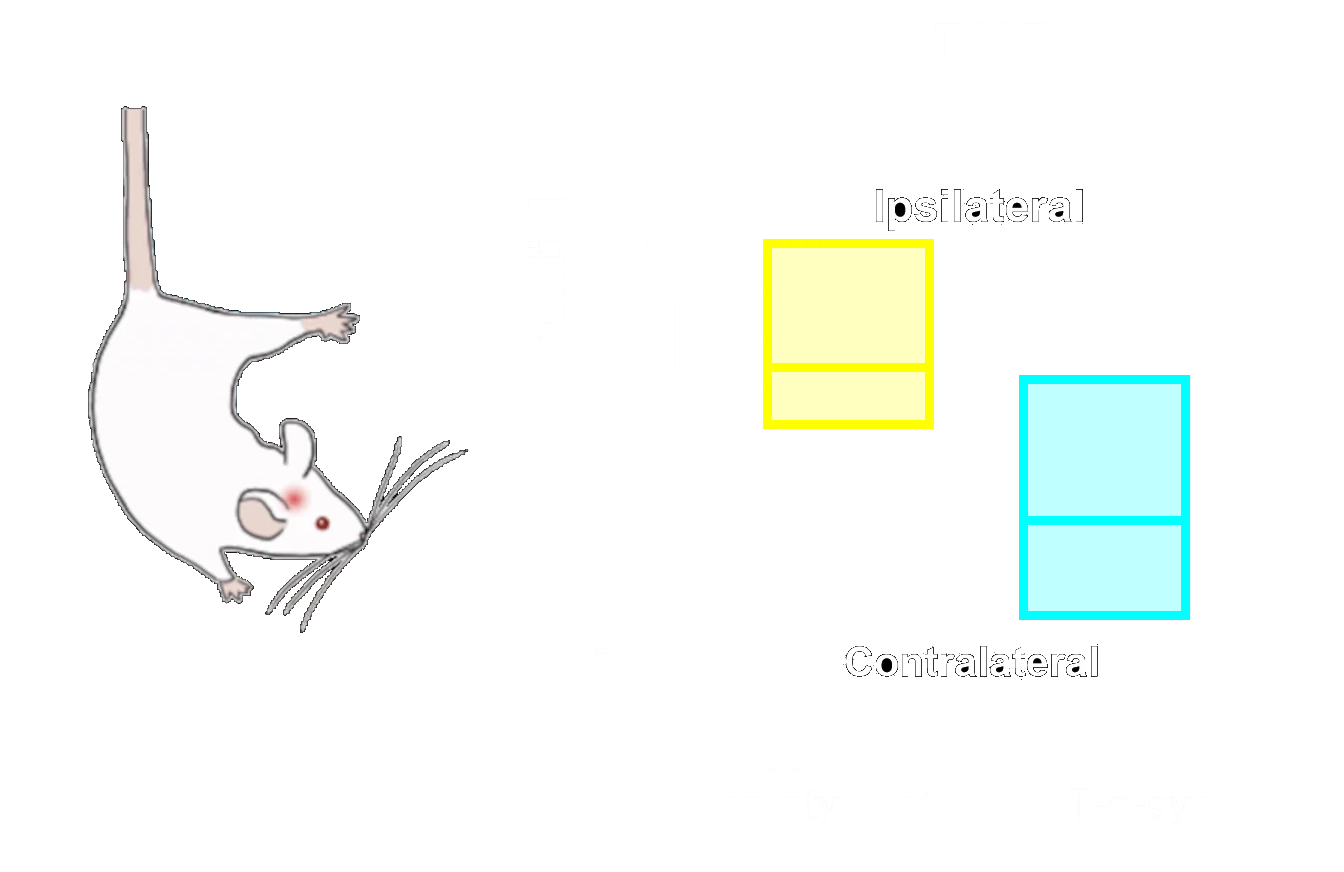
도파민 신경 분포의 상실은 동측 발 사용 증가(실린더 검사), 낙하 지연 시간 감소(로타로드), 대측 흔들림 증가(꼬리 매달림 흔들림 검사)를 포함한 일측성 운동 장애와 일치한다.
우리의 파킨슨병 모델 중 어떤 특징이 인간 질환으로 전환 가능한가?
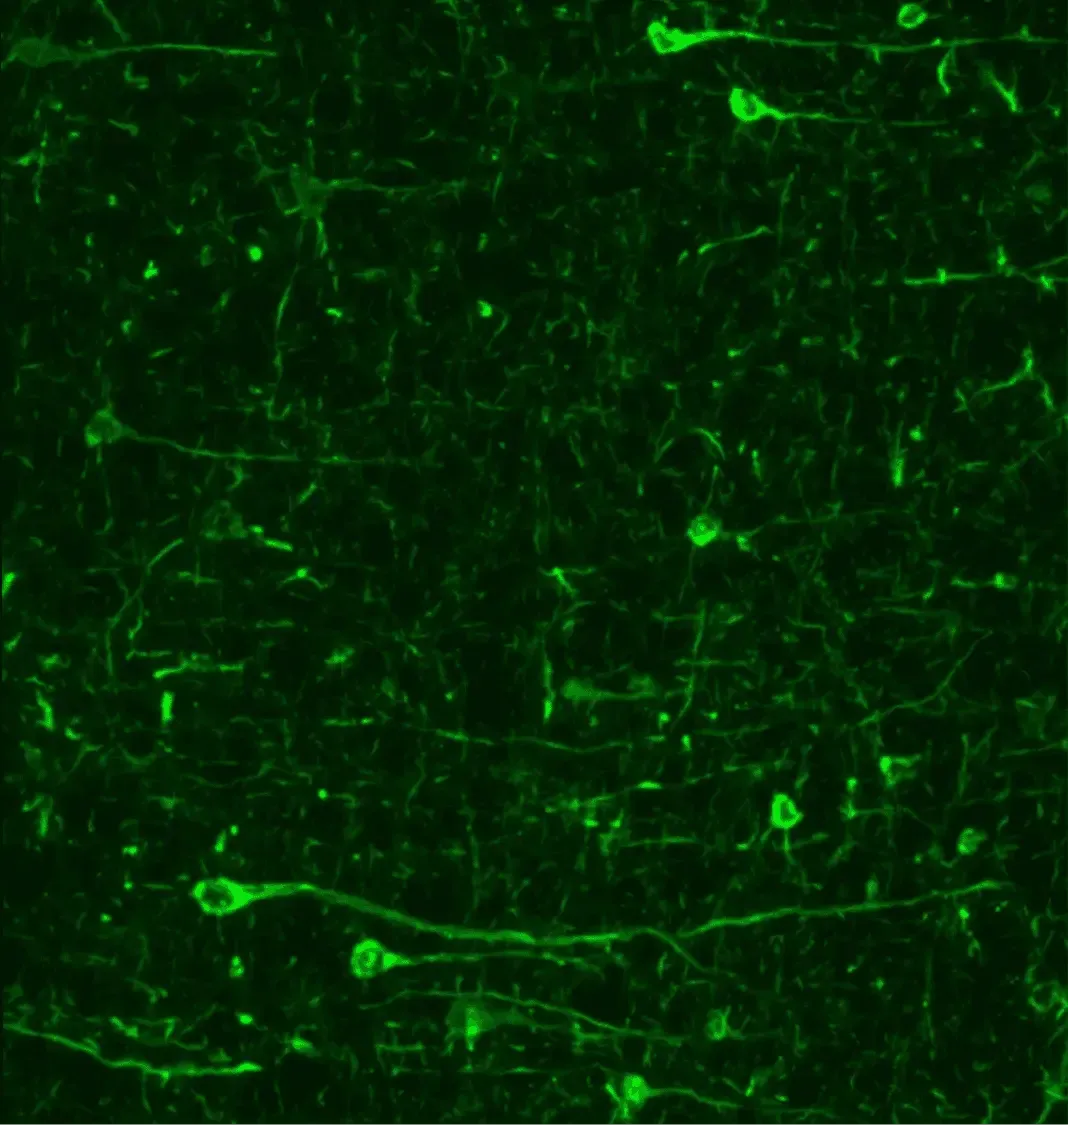
파킨슨병 동물 모델에서 인산화 시누클린(pSyn129)의 면역형광 분석 결과, 신경세포체와 돌기에서 현저한 축적이 관찰된다.
알파-시누클레인 응집체
잘못 접힌 알파-시누클레인의 응집체는 인간 파킨슨병의 핵심 병리학적 특징이다. 루이체와 루이신경돌기는 흑질 밀집부 내 도파민성 뉴런뿐만 아니라 다른 뇌 영역에서도 관찰된다. 이 잘못 접힌 알파-시누클레인 병리는 특정한 시공간적 진행 양상을 보인다(Braak, 2003).
우리의 AAV 및 PFF 유도 파킨슨병 동물 모델에서 관찰된 바는 다음과 같습니다:
- 신경세포체 및 돌기에서높은 수준의 인산화 α-시누클레인
- PFF 모델에서 병리의강력한 시딩 및 확산
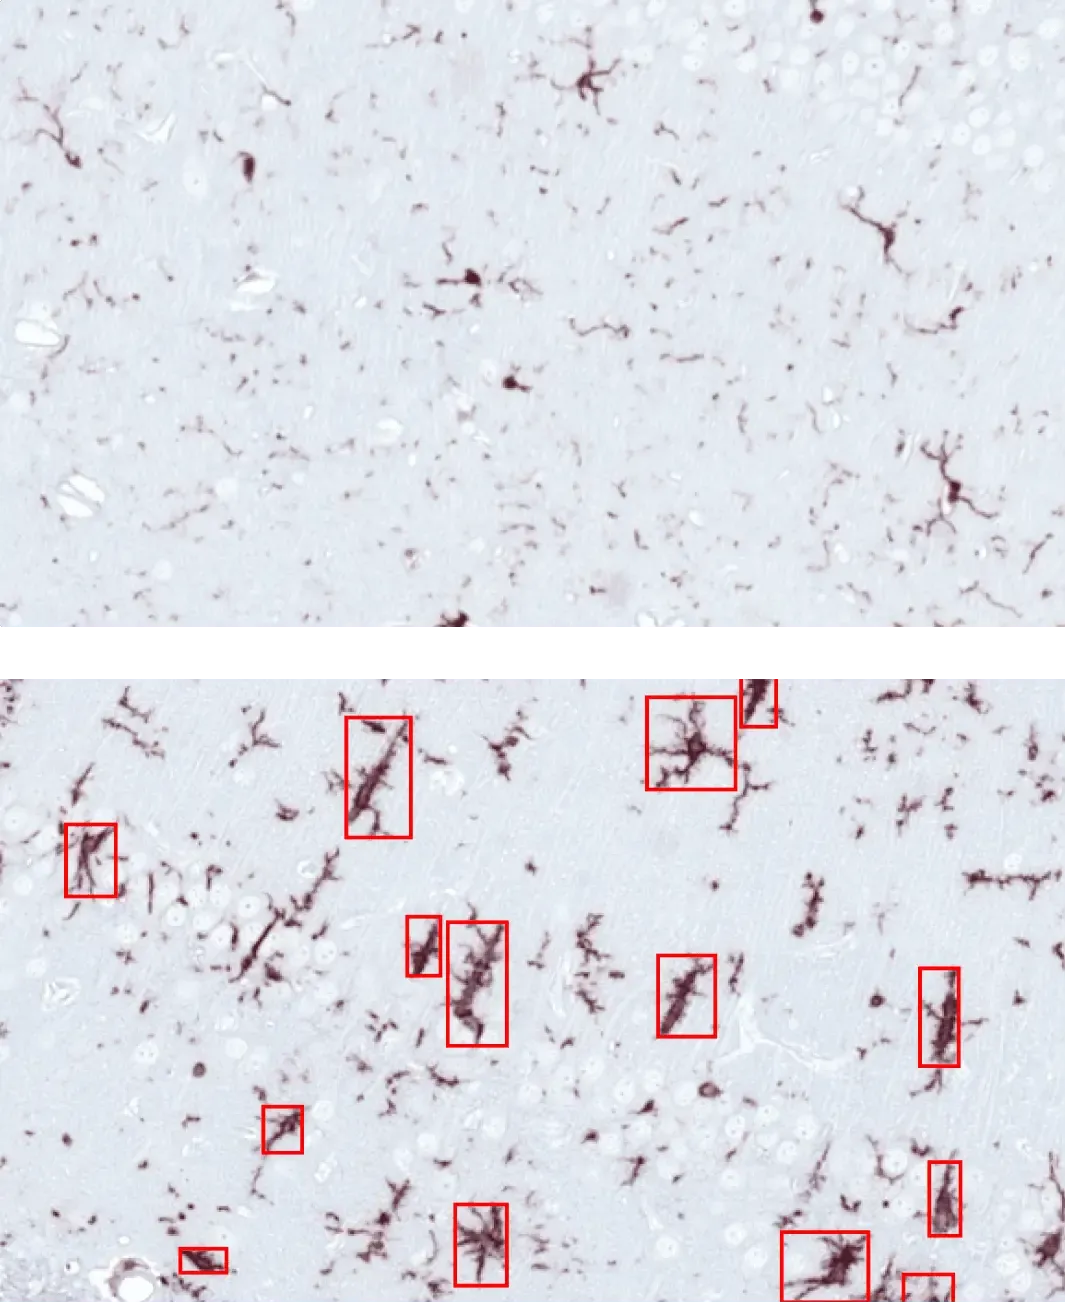
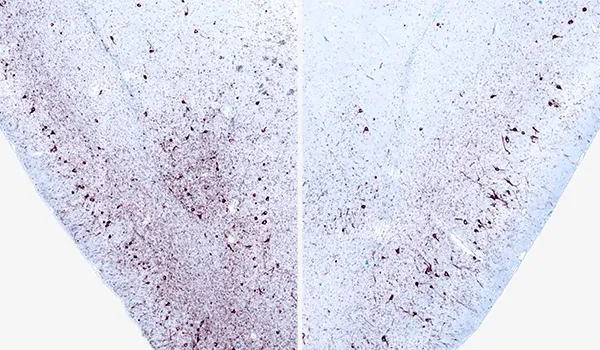
AON에 PBS(위) 또는 α-시누클레인 PFF(아래)를 주입한 마우스의 해마에서 활성화된 미세아교세포(빨간색 박스).
활성화된 미세아교세포 및 반응성 성상세포
신경염증은 파킨슨병의 주요 병리학적 특징으로, 활성화된 미세아교세포와 반응성 성상세포가 병인에서 핵심적인 역할을 합니다(Kam, 2020; Chen, 2023).
우리의 AAV 및 PFF 유도 파킨슨병 마우스 모델에서 관찰된 바는 다음과 같다:
- 신경염증 반응의뚜렷한 시공간적 패턴
- 자체 개발한 컴퓨터 비전,머신 러닝 및 딥 러닝 알고리즘을 통해 검출된미세아교세포 및 성상세포 형태 변화
신경염증 연구 프로젝트: 미세아교세포, 성상세포 및 신경퇴행성 질환 참조
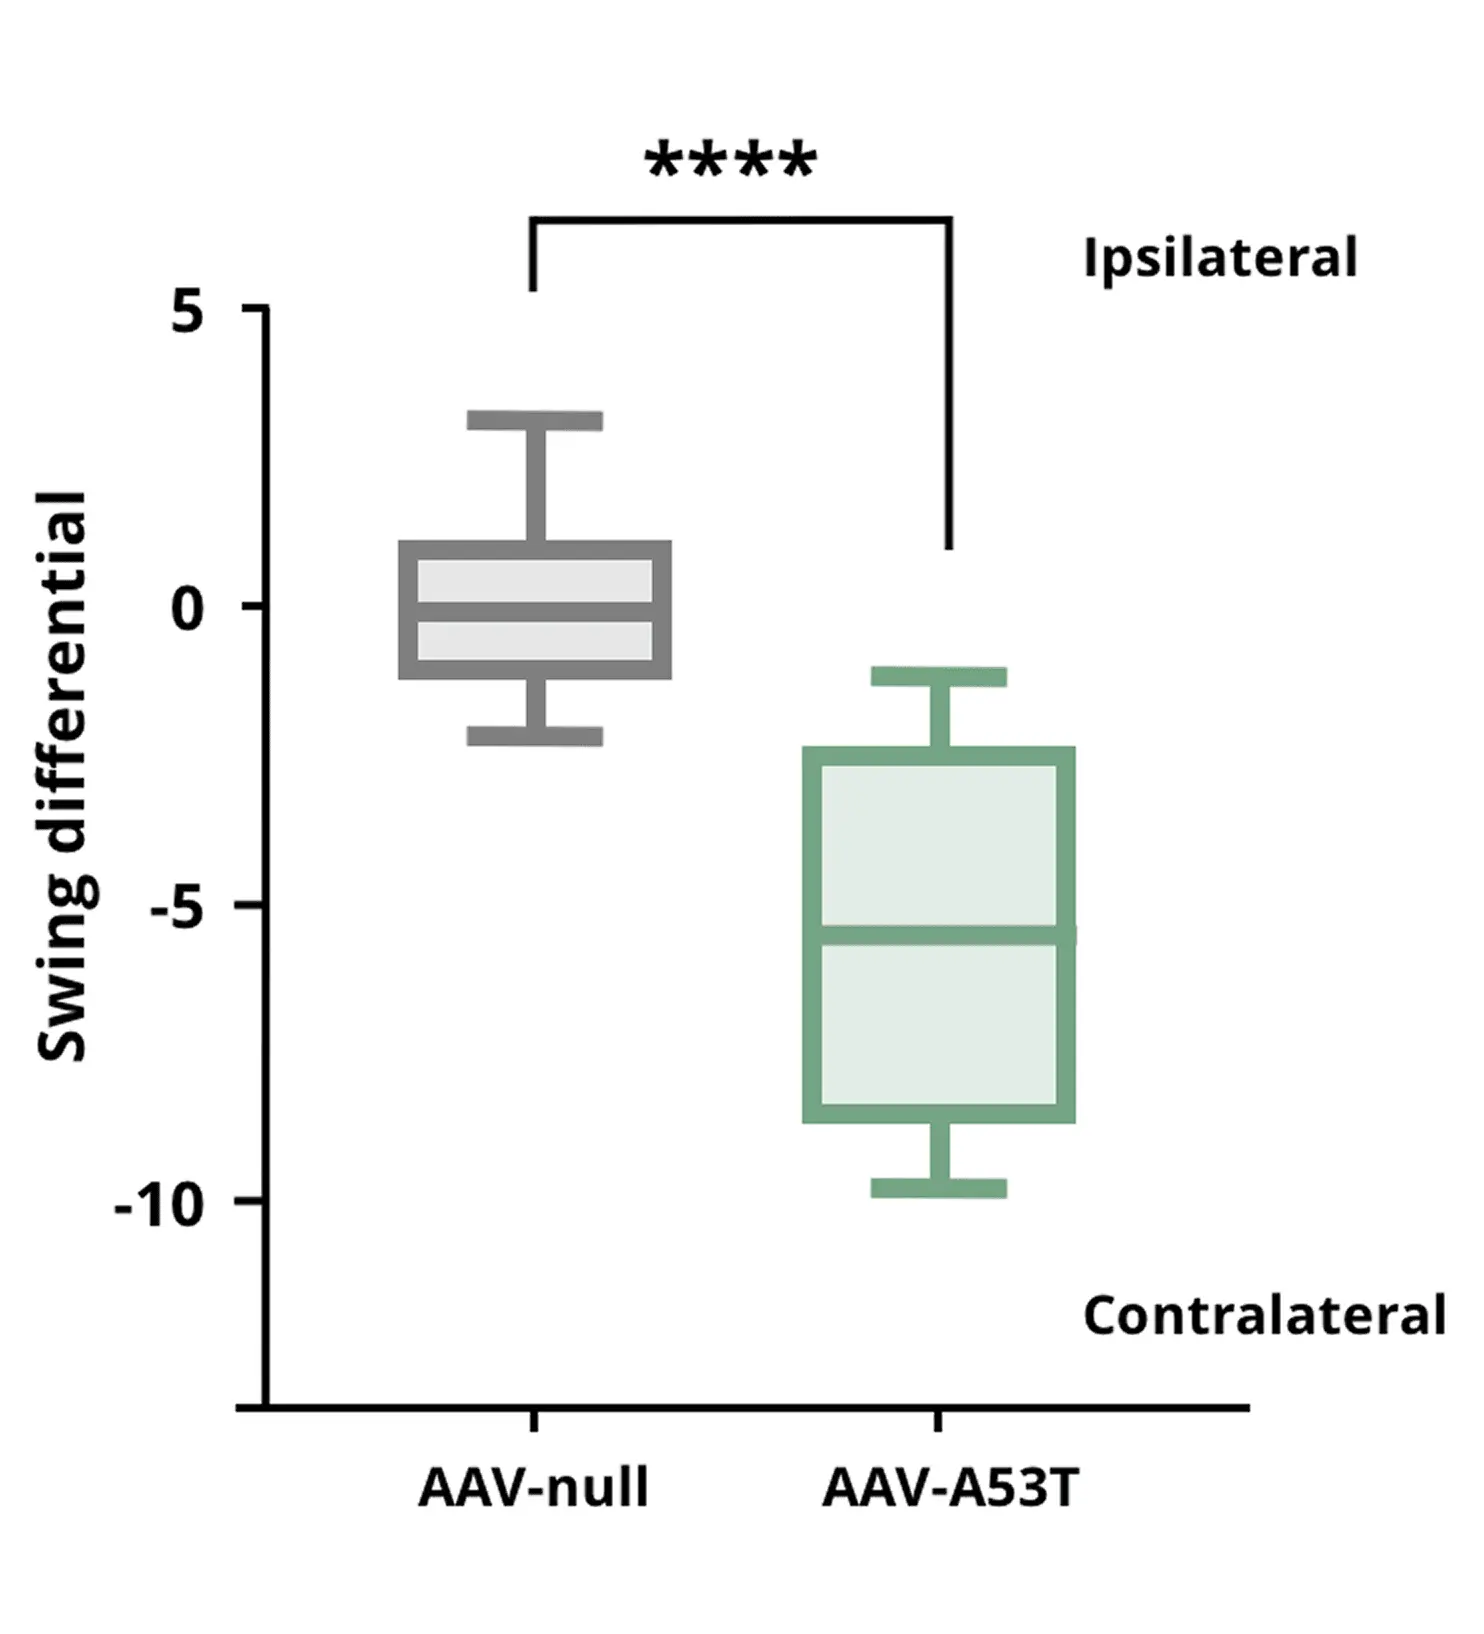
꼬리 매달리기 스윙 테스트 결과, AAV-A53T α-syn 마우스는 AAV-null 대조군 마우스에 비해 일측성 도파민 결핍으로 인해 반대측 스윙이 증가함을 보여준다.
**** p<0.0001.
도파민성 신경세포 소실 및 운동 장애
피라미드 외 운동 증상은 파킨슨병의 특징적인 증상으로, 주로 흑질 밀집부(SNc)의 도파민 신경세포 손실과 선조체(예: 꼬리핵 및 피질하핵)의 신경절제(denervation)에 의해 유발됩니다.
우리의 파킨슨병 모델에서는 다음 방법 중 하나로 흑질(SNc)을 표적하여 병리를 유도합니다:
- α-시누클레인을 과발현하는 AAV(아데노연관벡터) 또는
- α-시누클레인 사전형성 섬유소(PFFs)
참고 자료: 선형 섬유 – 세포 및 동물 모델 가이드
이러한 중재는 다음과 같은 결과를 초래합니다:
- SNc 내도파민성 뉴런의 신경퇴행
- 선조체 내도파민성 말단 손실
- 운동 기능 장애는 다음을 통해 평가됩니다:
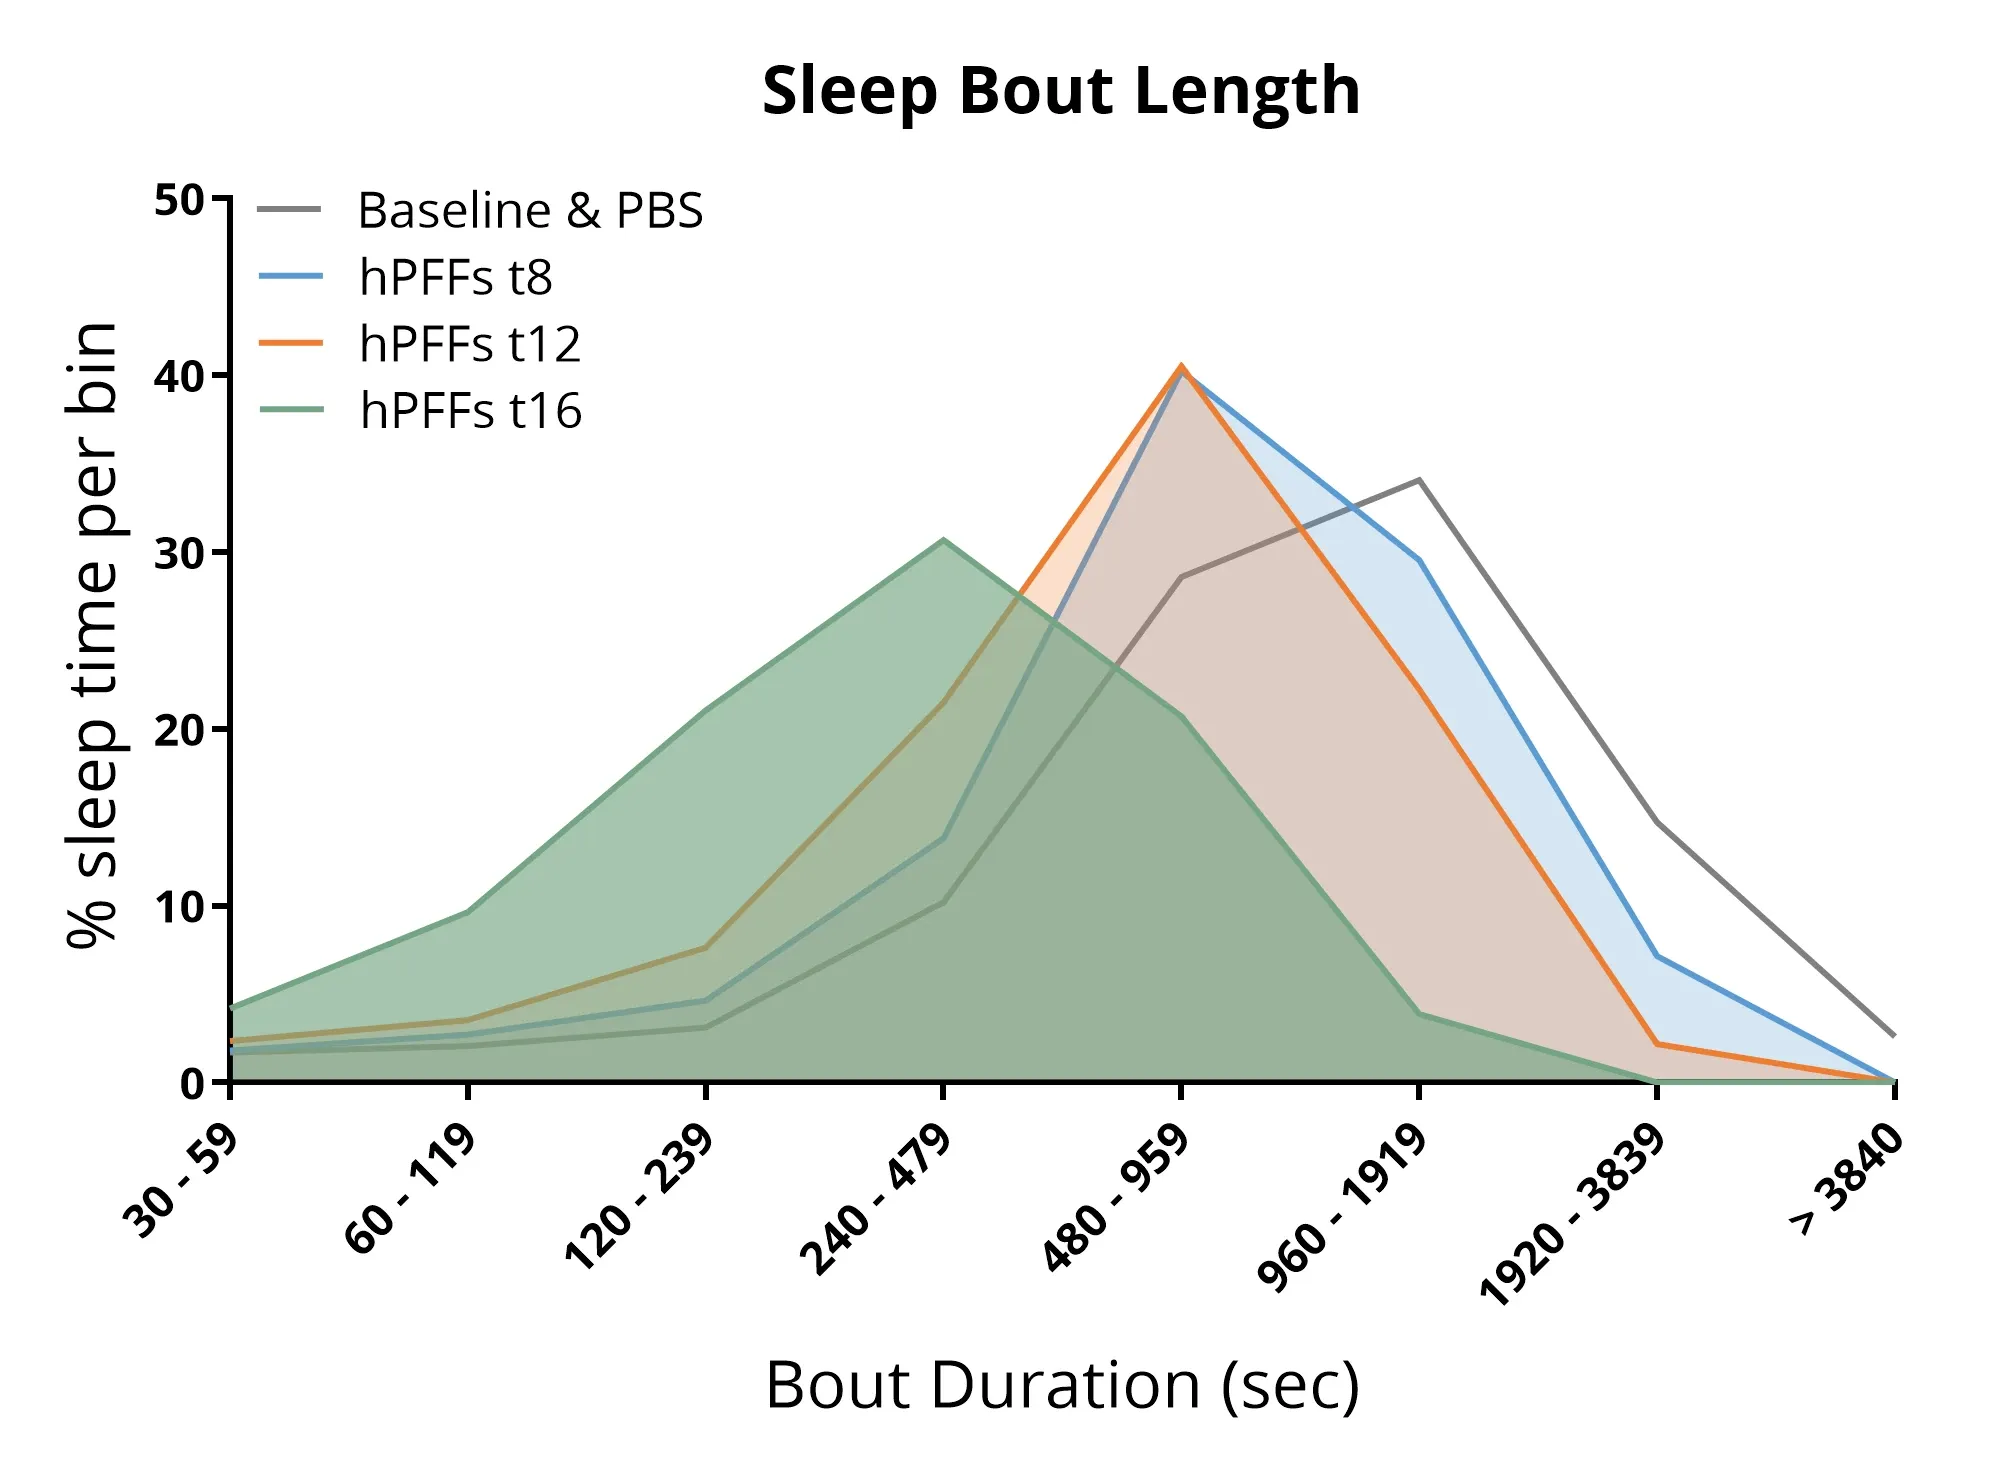
AON에 α-syn PFF를 주입한 마우스의 수면 분석 결과, 수면 구조가 교란되어 수면 단위 길이가 짧아지고 전체 수면 시간이 감소하는 것으로 나타났다.
수면 장애
수면 장애는 파킨슨병의 가장 흔한 비운동 증상 중 하나로, 최대 약 85%의 환자에게 영향을 미칩니다(Stefani, 2020; Asadpoordezaki, 2025).
파킨슨병 마우스 모델에서 비침습적 수면 모니터링 시스템을 활용하여 우리는 다음과 같은 사실을 입증하였습니다:
- A53T 형질전환 마우스의 AON(안와상두엽)에 α-시누클레인 PFF(인산화 접힘 불량체)를 주입하면 다음과 같은 결과가 나타남:
- 수면-각성 구조 변화
- 총 수면 비율 변화
- 수면 단위 길이 교란
PBS를 주입한 마우스(위)와 AON α-syn PFF를 주입한 마우스(아래)의 MRI 피질 두께 지도. PFF 처리된 동물은 피질 얇아짐을 보인다.
지역별 뇌 위축
다중 모달리티 뇌 영상 바이오마커는 파킨슨병 임상 시험에서 널리 사용됩니다. MRI 기반 지역별 신경해부학적 부피 및 피질 두께 측정은 파킨슨병에서 뇌 위축의 민감한 지표입니다(Tremblay, 2021; Abdelgawad, 2023).
전뇌 고해상도 해부학적 MRI 촬영과 첨단 완전 자동화 영상 처리 및 분석을 결합하여 우리는 다음과 같은 사실을 입증하였습니다:
- AAV 및 PFF 유도 파킨슨병 마우스 모델에서재현 가능한 지역별 뇌 위축
혁신 기술 보기: 신경퇴행성 질환 마우스 모델에서의 뇌 위축 분석
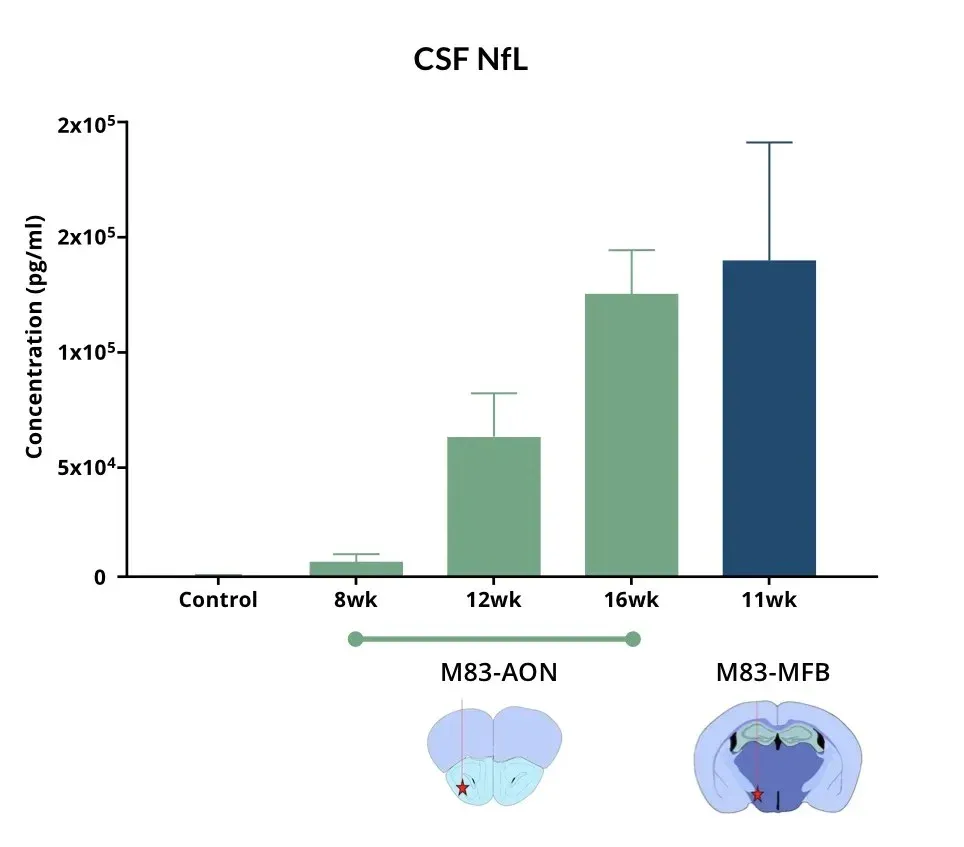
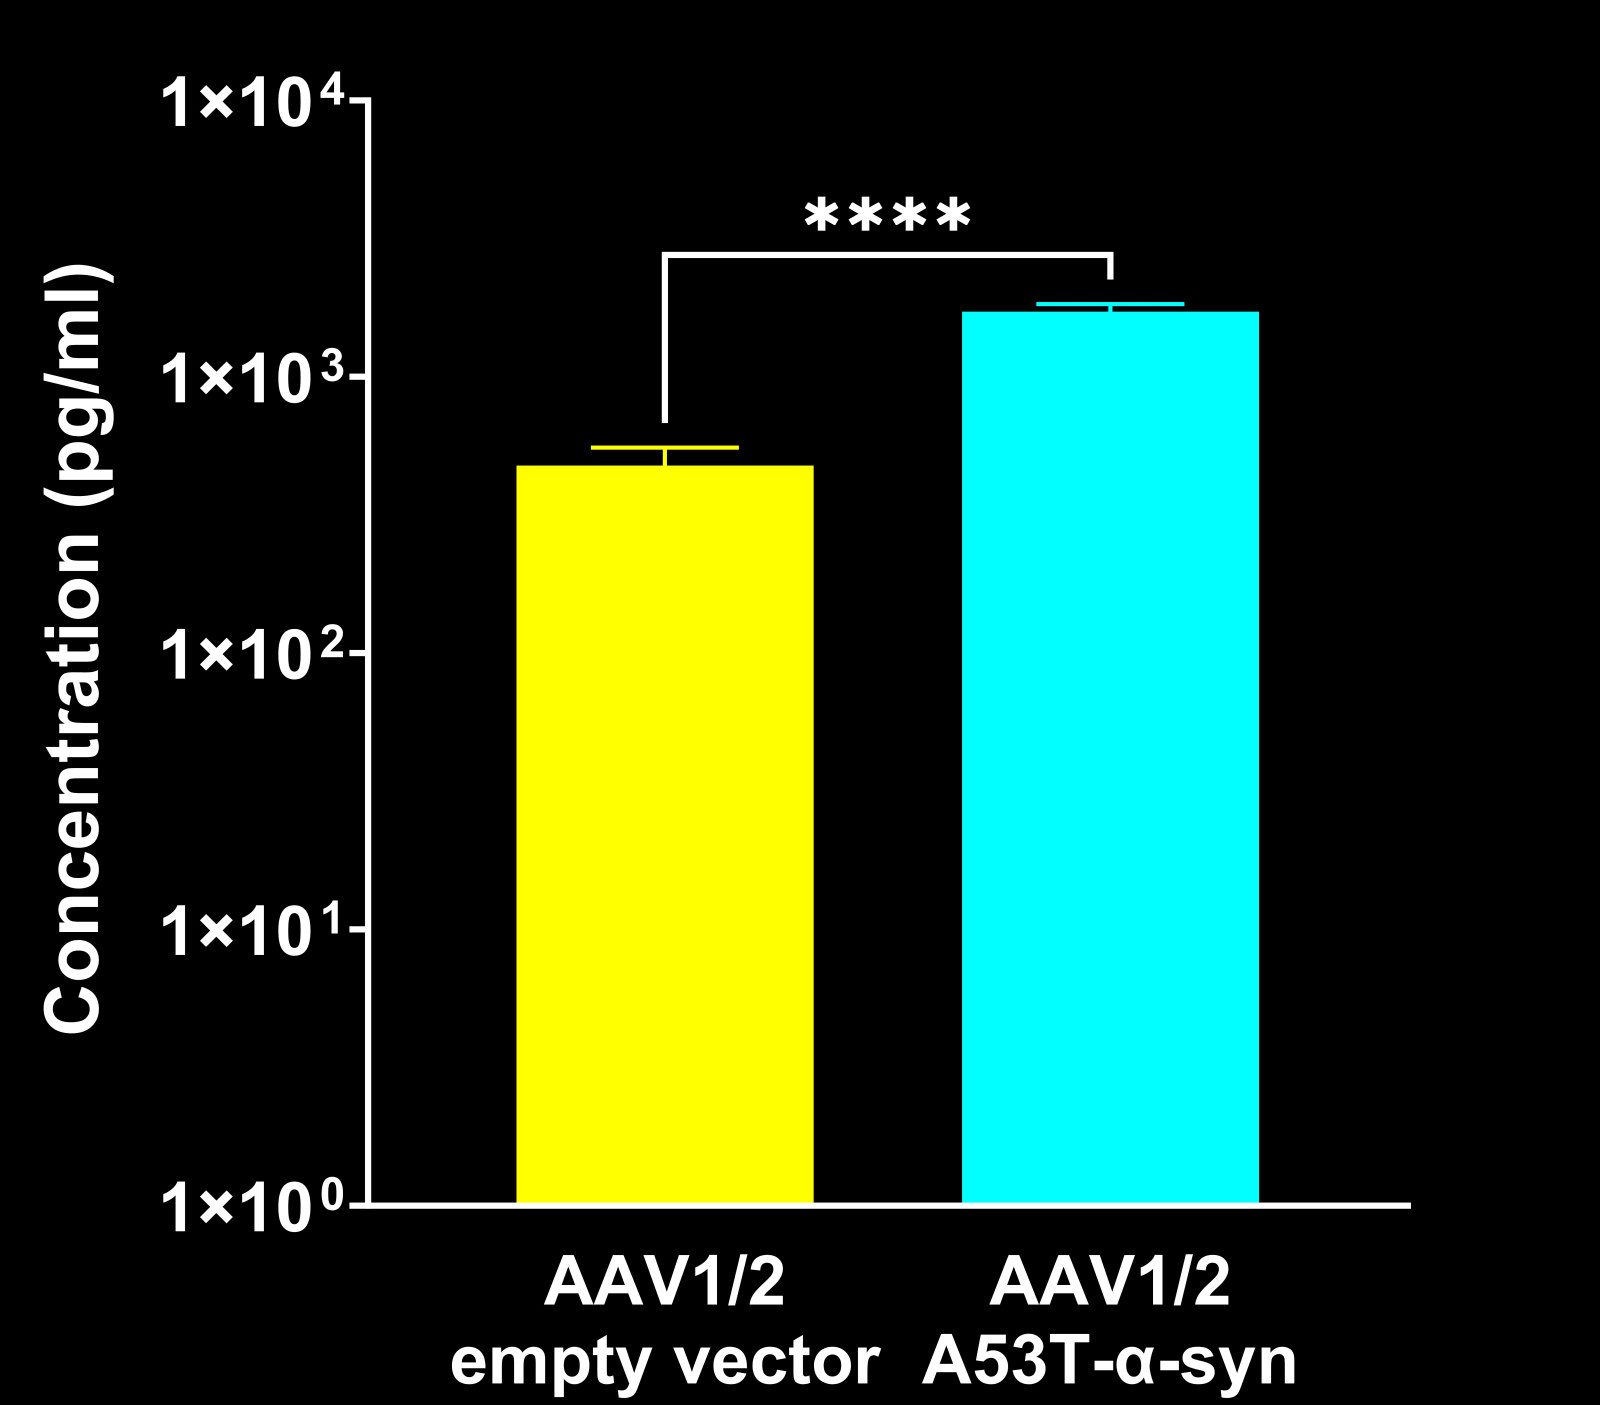
AON 및 MFB에 α-Syn PFF를 주입한 마우스는 대조군 마우스에 비해 뇌척수액 내 NF-L 수치가 상승한다.
뇌척수액 및 혈장 내 신경섬유 경쇄(NF-L) 상승
신경섬유 경쇄(NF-L)는 파킨슨병 환자의 뇌척수액 및 혈장에서 증가하며, 파킨슨병 임상시험에서 체액 바이오마커로 일상적으로 사용됩니다(Bäckström, 2020; Urso, 2023; Pedersen, 2024). 또한 여러 파킨슨병 전임상 모델에서도 NF-L 수치 증가가 보고되었습니다.
우리의 파킨슨병 마우스 모델에서 관찰된 바는 다음과 같습니다:
- 다음 부위에 인간 α-시누클레인을 PFF 주입한 M83+/- 트랜스제닉 마우스에서 혈장 및 뇌척수액 내 NF-L의 현저한 증가:
- 전방 후각핵(AON)
- 중뇌전방다발(MFB)
참고 자료: 파킨슨병 모델에서의 신경섬유 경쇄(NF-L)
PFF 및 AAV α-시누클레인 설치류 모델의 병리학적 및 표현형 프로파일은 무엇인가?
아래 표는 각 모델이 인간 파킨슨병의 특징적 증상을 재현하는 정도를 요약하여, 특정 연구 주제에 대한 관련성을 신속하게 비교할 수 있도록 합니다.
병리학
이 표는 α-시누클레인 응집, 신경염증, 도파민성 뉴런 손실 등 주요 파킨슨병 관련 병리학적 특징을 개요하고, PFF 및 AAV 유도 마우스 모델에서 이러한 특징이 얼마나 강력하게 나타나는지 비교합니다.
| 특징/영역 | PFF 모델 | AAV 모델 |
|
✔️ |
✔️ | |
|
✔️ |
✔️ | |
|
✔️ |
✔️ |
기능적 특징
이 표는 운동 장애 및 수면-각성 장애를 포함한 PD 병리와 관련된 행동 및 생리학적 장애를 비교하여 마우스 모델 간의 차이점을 강조합니다.
생체표지자
이 표는 질병 진행과 관련된 비침습적 영상 및 체액 기반 바이오마커를 요약합니다. 이러한 바이오마커는 PFF 및 AAV 유도 동물 모델 전반에 걸쳐 신경퇴행 평가 및 치료 효과 평가를 위한 정량적 평가 지표를 제공합니다.
|
특징/도메인 |
PFF 모델 |
AAV 모델 |
|
✔️ |
✔️ | |
|
✔️ |
✔️ |
요약: PFF 및 AAV α-시누클레인 모델 모두 뚜렷한 α-시누클레인 병리를 보이며, PFF 모델은 특징적인 시딩 및 확산 시공간 패턴을 나타냅니다. 두 모델 모두에서 신경염증 반응이 관찰되지만, AAV 모델에서는 도파민성 뉴런 손실이 일반적으로 더 심각하고 지역적으로 선택적입니다. 운동 장애는 두 모델 모두에서 발생하지만, AAV 모델에서 더 일찍 발생하고 그 정도가 더 크며, AAV 모델에서는 수면 관련 표현형이 아직 평가되지 않았다. MRI 기반 뇌 위축과 상승된 NF-L은 두 마우스 모델 모두에서 신경퇴화의 임상적 전환 바이오마커 역할을 한다.
파킨슨병 마우스 모델의 특징은 무엇인가?
아래의 "이미지 인터랙티브"를 통해 AAV-A53T-Synuclein 마우스 모델의 특성 분석을 탐색할 수 있습니다. 여기에는 생체 내 데이터와 멀티플렉스 면역형광 조직 절편 전체의 고해상도 이미지가 포함됩니다.
왼쪽 패널을 사용하여 "이미지 스토리" 를 간편하게 탐색할 수 있습니다.
마우스 왼쪽 버튼으로 고해상도 현미경 이미지를 이동할 수 있습니다. 마우스/트랙패드(위/아래) 또는 왼쪽 상단 모서리의 + 및 - 버튼을 사용하여 확대/축소할 수 있습니다. 오른쪽 상단 모서리의 제어판에서 채널 및 분할에 대한 이미지 설정을 토글(켜기/끄기), 색상 변경 및 조정할 수 있습니다.
최상의 상호작용 경험을 위해 전체 화면 모드 사용을 권장합니다.


Characterization of our AAV-A53T-Synuclein mouse model, including in vivo data and high-resolution images of entire Multiplex Immunofluorescence tissue sections.
Share link to
 Click to copy link
파킨슨병 동물 모델 요약: PFF와 AAV α-시누클레인 모델의 비교 분석
PFF 및 AAV α-시누클레인 설치류 모델은 파킨슨병 기전 연구 및 치료 전략 평가를 위한 상호 보완적 플랫폼을 제공합니다. 두 모델 모두 강력한 α-시누클레인 응집 및 측정 가능한 신경염증과 같은 질병의 핵심 병리학적 특징을 재현하지만, 주요 표현형의 발현 및 진행 양상에서는 차이가 있습니다. PFF 모델은 병리의 시드 형성 및 확산 연구에 강력한 프레임워크를 제공하는 반면, AAV 모델은 더 뚜렷하고 지역적으로 선택적인 도파민성 뉴런 손실과 함께 더 빠르고 심각한 운동 장애를 보여줍니다. AAV 모델에서는 수면 관련 표현형이 아직 평가되지 않았지만, 두 모델 모두 신경퇴화의 전환적 바이오마커로서 MRI 기반 뇌 위축 및 생체액 내 NF-L 수치 활용을 지원합니다. 종합적으로, 이러한 모델들은 다양한 실험적 목표를 가로지르며 파킨슨병 관련 경로와 치료 효과를 포괄적으로 평가할 수 있게 합니다.
당사의 파킨슨병 마우스 모델 특성 분석, 검증된 측정 방법 및 전임상 신경과학 CRO 서비스에 대해 자세히 알아보십시오.
관련 콘텐츠
파킨슨병에 관한 최신 정보 및 파킨슨병 동물 모델에서 치료제 평가와 관련된 모범 사례.
사전 형성된 섬유소 - 세포 및 동물 모델 가이드
다양한 신경퇴행성 질환에 대한 질병 수정 치료법의 전임상 시험을 위한 사전 형성된 섬유소 유도 세포 및 동물 모델 개요
미세아교세포, 아스트로사이트 및 알파-시누클린 파킨슨병에서의 역할
알파-시누클레인이 파킨슨병 및 기타 시누클레인 병증에서 미세아교세포와 별아교세포에 미치는 영향.
파킨슨병 치료제 개발을 위한 AAV α-시누클레인 모델
질병 조절 치료제의 전임상 연구에 사용하기 위한 마우스 및 랫드 모델에서 아데노-연관 바이러스(AAV)에 의한 α-시누클레인 발현에 대한 개요.
파킨슨병 모델의 신경원섬유소 가벼운 사슬
신경필라멘트 경쇄(NfL; NF-L) 수치가 파킨슨병 마우스 및 랫트 모델에서 혈액(혈장; 혈청) 및 뇌척수액 바이오마커로 사용될 수 있는 방법.
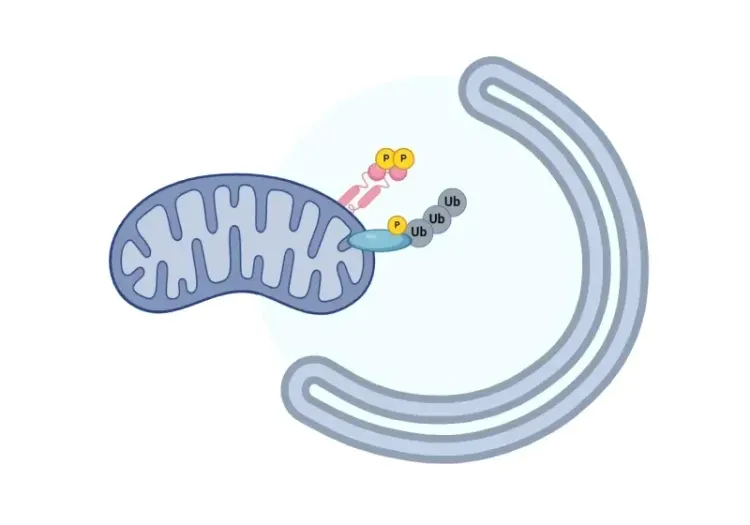
미토파지(Mitophagy)와 파킨슨병
파킨슨병에서 손상된 미토콘드리아가 어떻게 신경 퇴행을 유발할 수 있는지에 대한 개요.
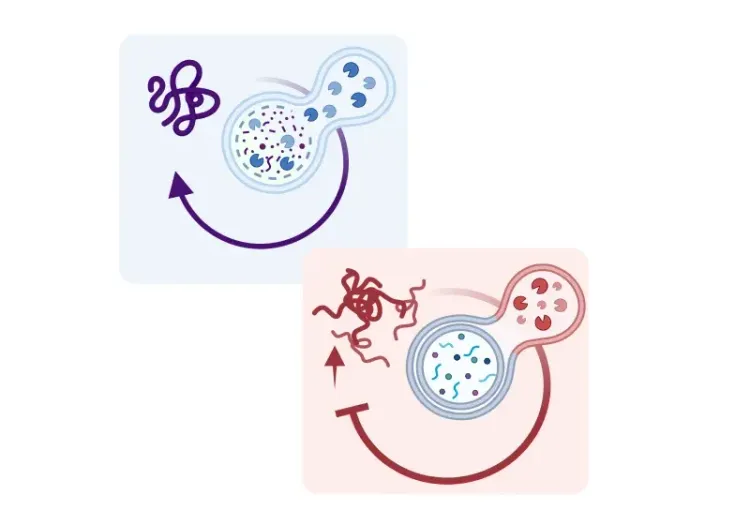
자가포식, 파킨슨병, 도파민성 신경세포
파킨슨병에서 손상된 자가포식 작용이 어떻게 도파민성 뉴런의 병리학적 변화와 신경 퇴화로 이어질 수 있는지에 대한 개요.
미토콘드리아 기능 장애와 파킨슨병
파킨슨병에서 미토콘드리아 기능 장애가 신경 퇴행과 어떻게 연관되어 있는지에 대한 개요.