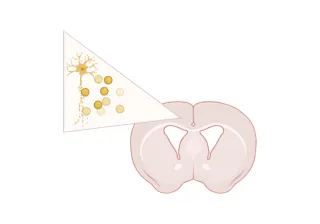
Neurodegeneration & Neuroinflammation in the AAV-Synuclein Mouse Model
モデル概要
バイオスペクティブでは、α-シヌクレイン凝集、ドーパミン作動性ニューロンの喪失、神経炎症、運動障害、睡眠障害など、ヒトのパーキンソン病の主要な特徴を忠実に反映した、厳密に特性評価されたげっ歯類モデルを開発・活用しております。これらのモデルは、疾患メカニズム、病理学的進行、および強力なトランスレーショナルな関連性を有する早期段階の治療効果に関する研究を支援するよう設計されております。
当社の動物モデル群は、再現性の高さ、明確に定義された表現型、行動学的・画像診断・生化学的・分子生物学的・組織病理学的エンドポイントの統合を重視し、包括的な前臨床評価を可能にしております。この科学的基盤により、研究者は病原性経路の解明、治療候補介入の評価、そして創薬開発に資する確固たるデータの創出に取り組むことが可能となります。
α-シヌクレイン前駆体線維(PFF)モデル
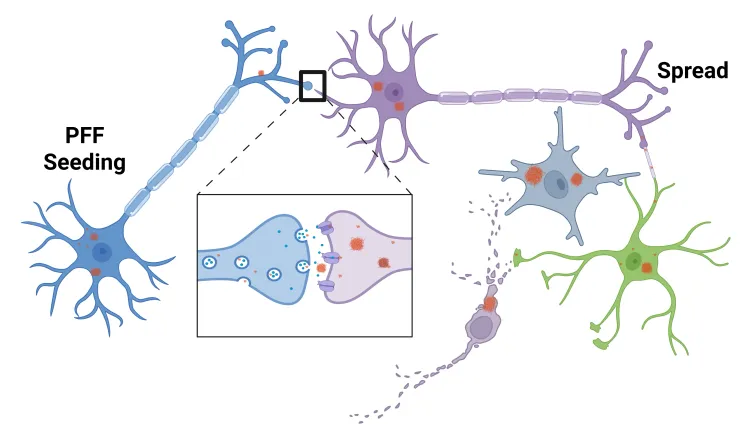
ヒトパーキンソン病の特徴である異常折り畳みα-シヌクレインの病理学的拡散は、α-シヌクレイン既成線維(PFF)の注入により動物脳でモデル化できる。この「PFFシード&拡散モデル」は、ヒトα-シヌクレインを過剰発現するトランスジェニックマウス、あるいは野生型マウスやラットで誘導可能である。
α-シヌクレインPFFモデル誘導
- 組換えα-シヌクレイン既成線維(PFF)の注入
- 適用対象
- A53T型α-シヌクレインを過剰発現するM83トランスジェニックマウス
- 野生型マウスまたはラット
α-シヌクレインPFF検証済み注入部位
- 前嗅球(AON)
- 内側前脳束(MFB)
- 線条体 +/- 上位大脳皮質
α-シヌクレインPFF疾患の特徴をモデル化
- 明確な時空間パターンにおけるα-シヌクレインの拡散
- 神経炎症
- 神経変性
- 測定可能な行動障害
- 運動障害
- 非運動症状(例:睡眠障害)
これらのα-シヌクレインPFFパーキンソン病モデルは、疾患修飾治療薬の試験において高い再現性を有しています。
バイオスペクティブでは、パーキンソン病のα-シヌクレインPFFモデルを用いた前臨床試験を10年以上にわたり実施し、以下の評価を行ってきました:
- 生体内分布
- 標的結合
- 作用機序
- 治療効果
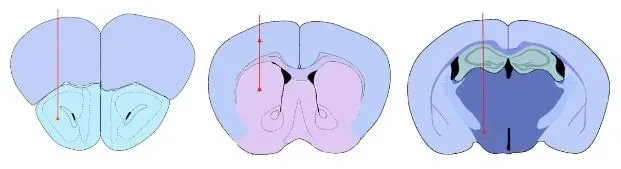
検証済み投与部位:前嗅核(AON)線条体(大脳皮質被覆部を含む場合あり)内側前脳束(MFB)
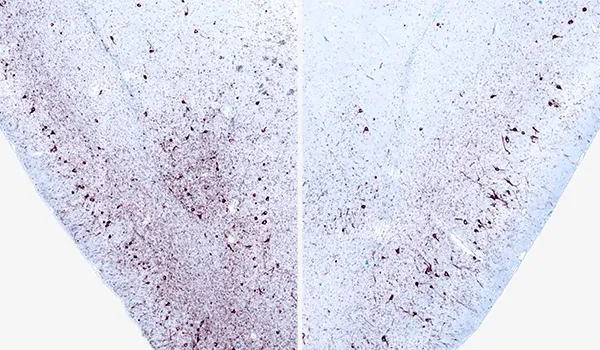
M83+/-マウスにおいてAONへの片側α-シヌクレインPFF注入12週後の、同側(左)および対側(右)梨状皮質におけるリン酸化α-シヌクレイン(pSyn129)の免疫組織化学染色。
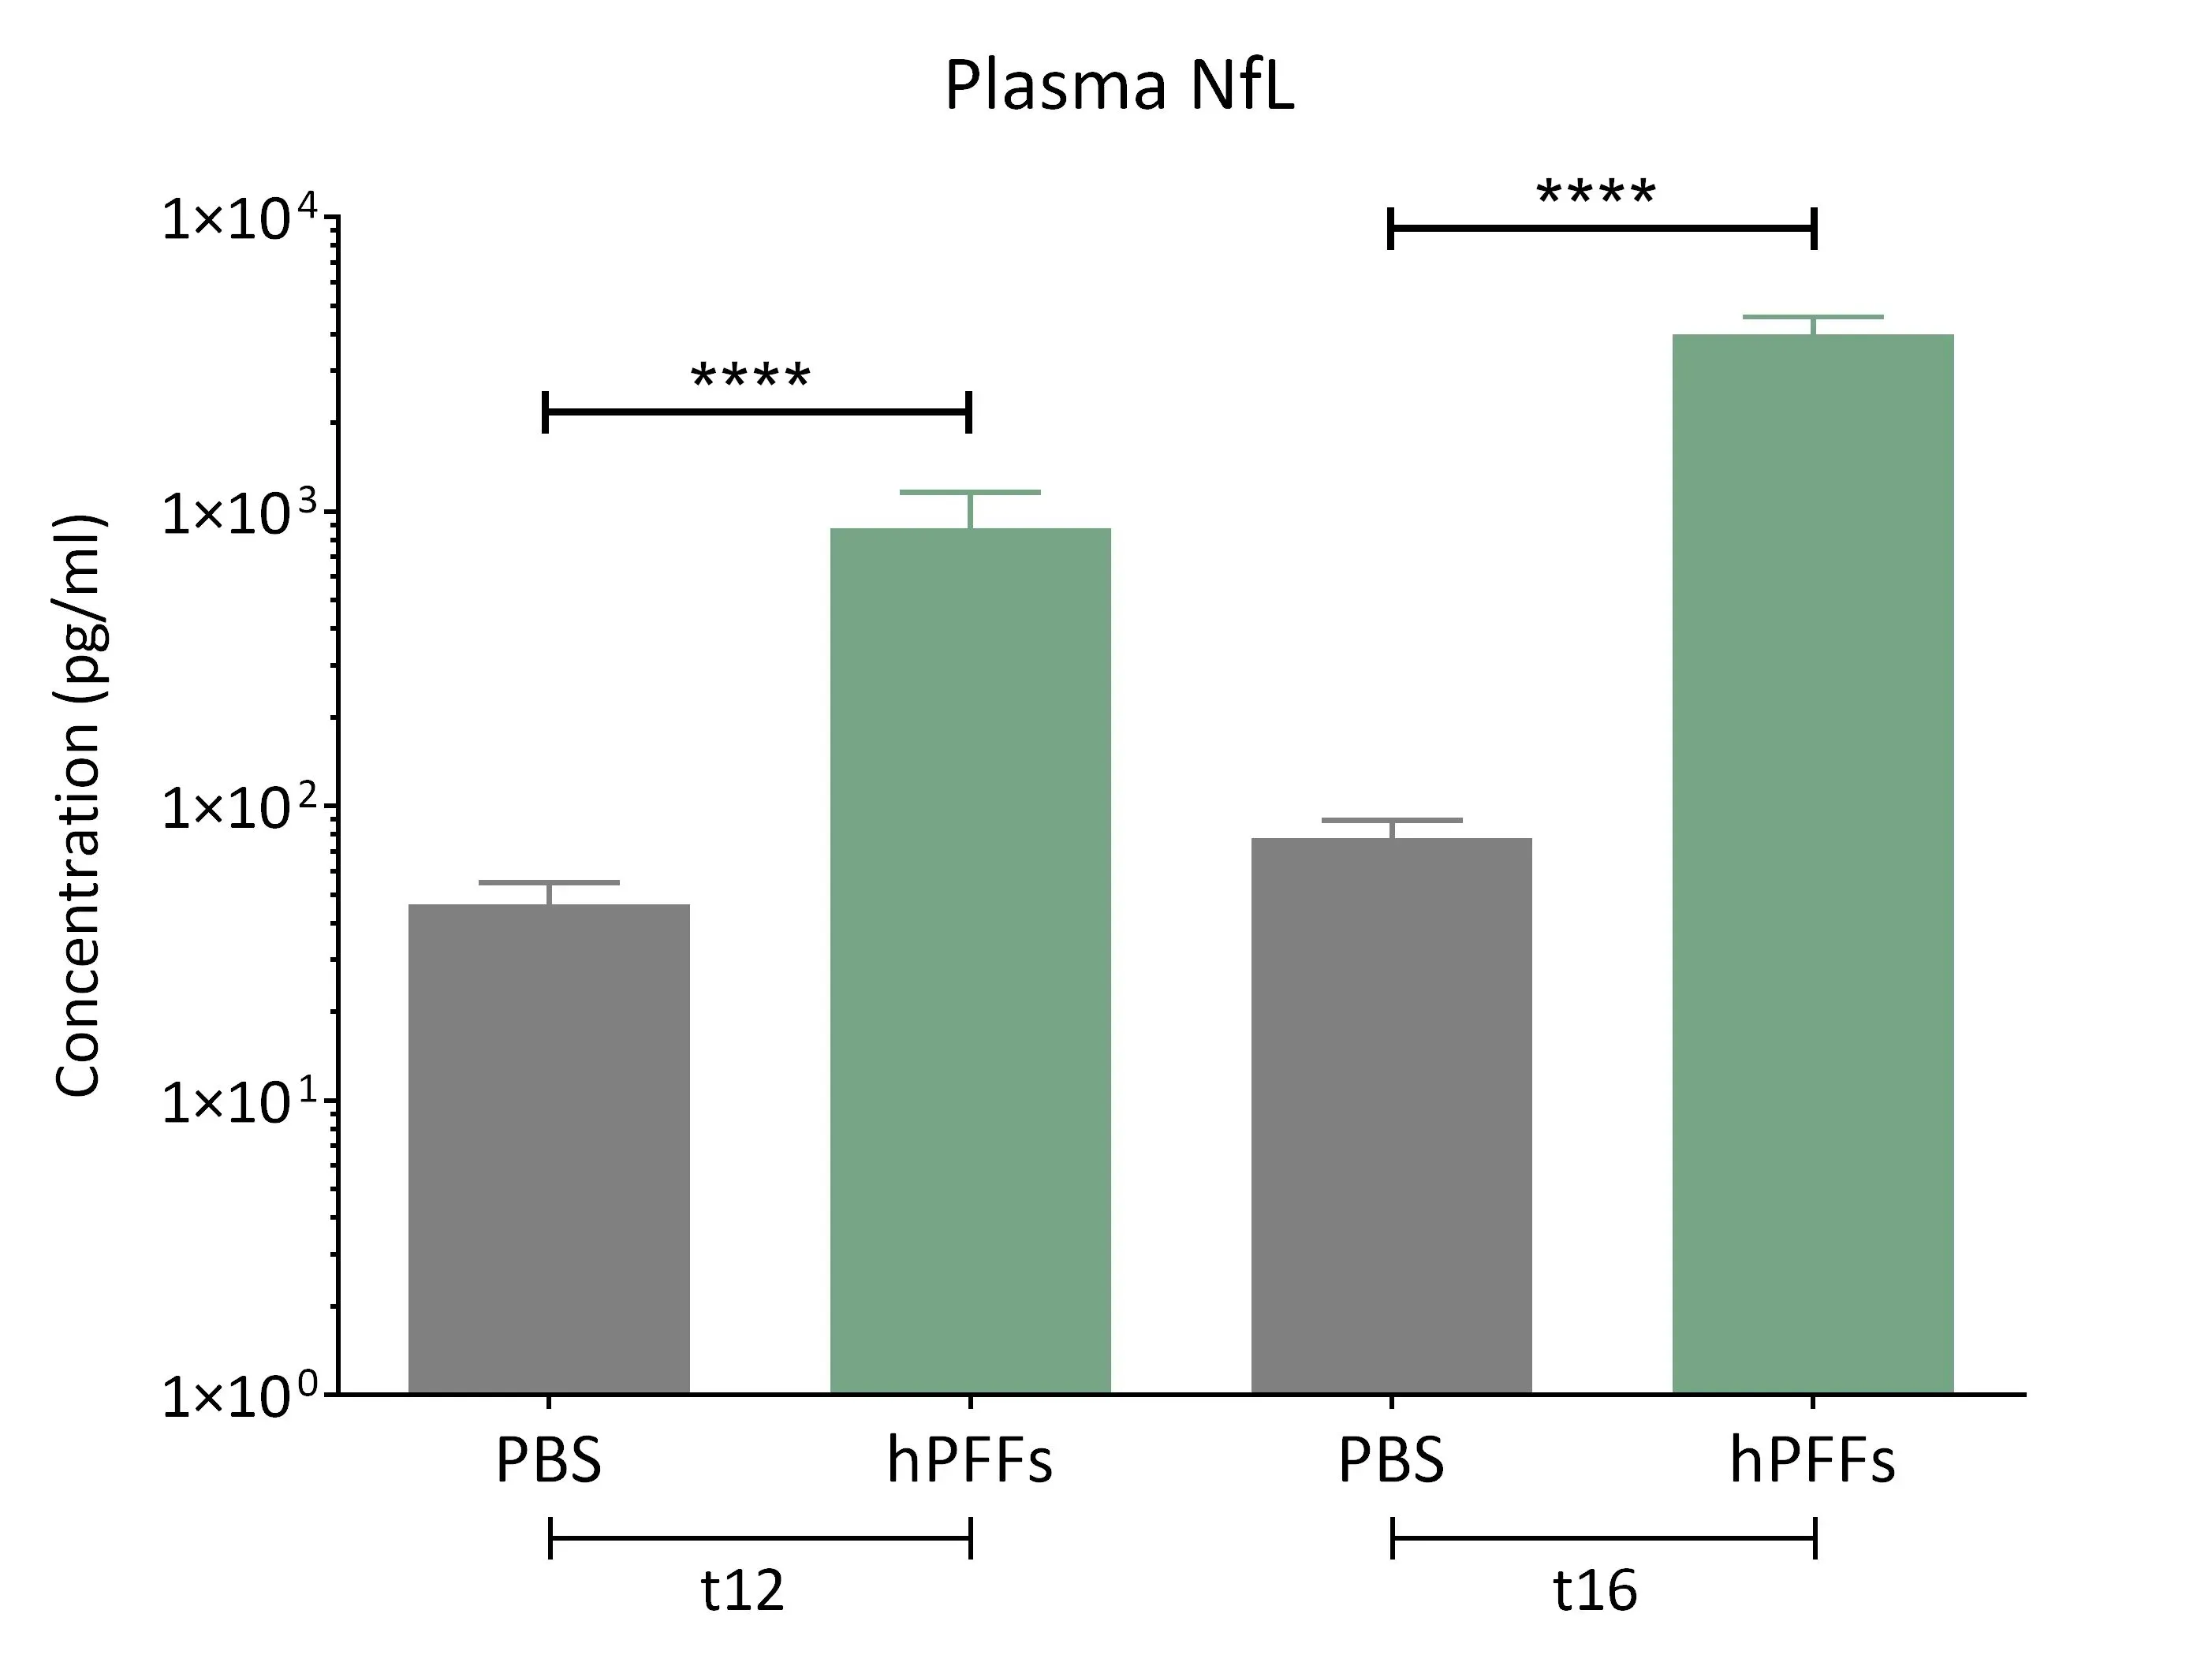
α-シヌクレイン線維形成誘導マウス由来血漿において、神経フィラメント軽鎖(NF-L)の著しい高値が認められる。
AAV A53T α-シヌクレインマウスモデル
成体齧歯類脳におけるα-シヌクレイン病理は、アデノ随伴ウイルス(AAV)ベクターの注入によって誘導可能である。このパーキンソン病マウスモデルでは、野生型(C57BL/6)マウスまたは遺伝子操作モデルマウスに対し、専門家がデジタル定位装置と自動マイクロインジェクター(高精度・高精度のため)を用いて、A53T変異ヒトα-シヌクレインを過剰発現するAAVベクターを黒質緻密部の近傍に定位注入する。
AAV-A53T α-シヌクレインモデル誘導
- A53T変異ヒトα-シヌクレインを過剰発現するアデノ随伴ウイルス(AAV)ベクターの定位注入
AAV-A53T α-シヌクレイン検証済み注入部位
- 黒質緻密部(SNc)
AAV-A53Tによるα-シヌクレイン疾患の特徴モデル
- 黒質被蓋部(SNc)におけるドーパミン作動性ニューロンの喪失および同側線条体の脱神経
- SNcおよび線条体におけるリン酸化α-シヌクレイン凝集体
- 神経炎症
- 神経変性
- 測定可能な片側運動障害
- ロータロッド試験
- 尾吊りスイング試験(TSST)
- シリンダーテスト
- 後肢クランプテスト
バイオスペクティブでは、これらのAAV-A53T α-シヌクレインモデルに対し、非侵襲的画像検査(例:MRI体積測定、[18F]FDG PET、[18F]DOPA PET)を実施し、臨床応用可能な画像バイオマーカー(例:局所脳萎縮、脳内グルコース代謝低下、ドーパミン作動性終末喪失)を生成することが可能です。
AAV-A53T α-シヌクレインパーキンソン病モデルは、治療薬(例:低分子化合物、ASO、遺伝子治療、生物学的製剤)がパーキンソン病に関連する病原性メカニズムおよび機能障害に及ぼす影響を研究するのに適した、堅牢かつ柔軟なシステムを提供します。
C57BL/6マウスにおいて、黒質被蓋野(SNc)へのAAV-hA53Tα-Synの片側注入後、同側(左半球)尾状核-被殻における重度のドーパミン作動性ニューロン喪失およびドーパミン作動性神経脱落が生じる。
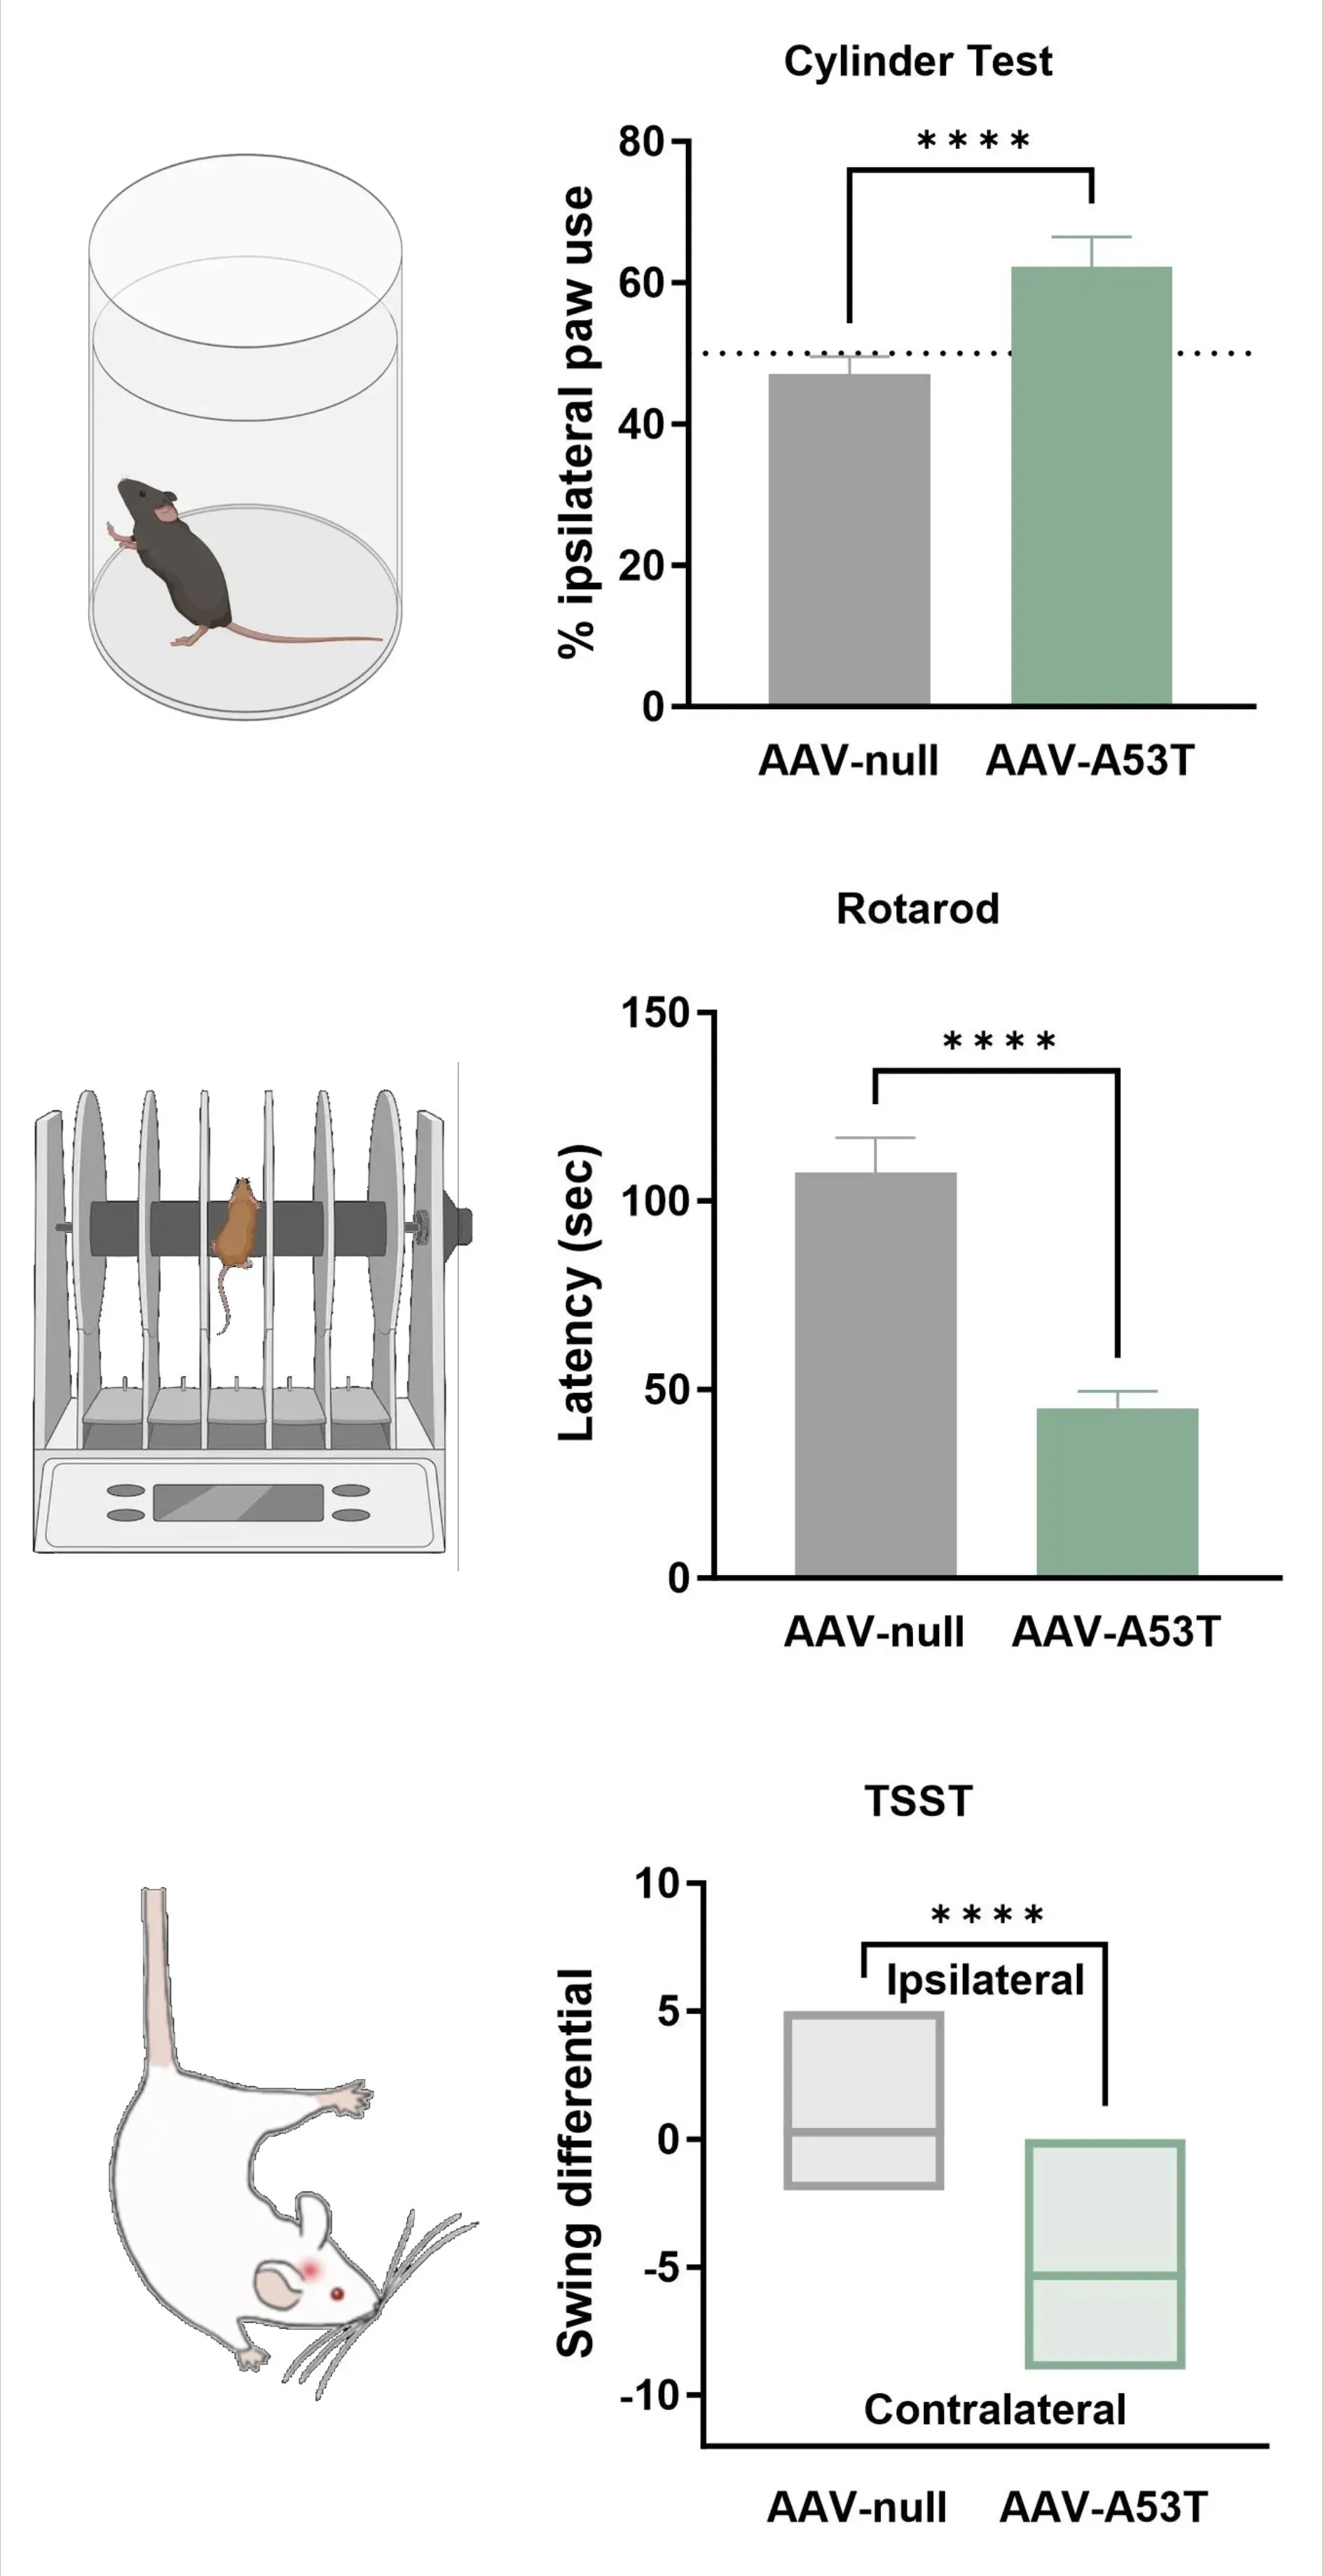
ドーパミン作動性神経支配の喪失は、片側運動障害と対応し、これには同側足の使用増加(シリンダーテスト)、転倒までの潜時短縮(ロータロッド)、および対側スイングの増加(尾吊りスイングテスト)が含まれる。
パーキンソン病モデルの特徴のうち、どの点がヒトの疾患に応用可能でしょうか?
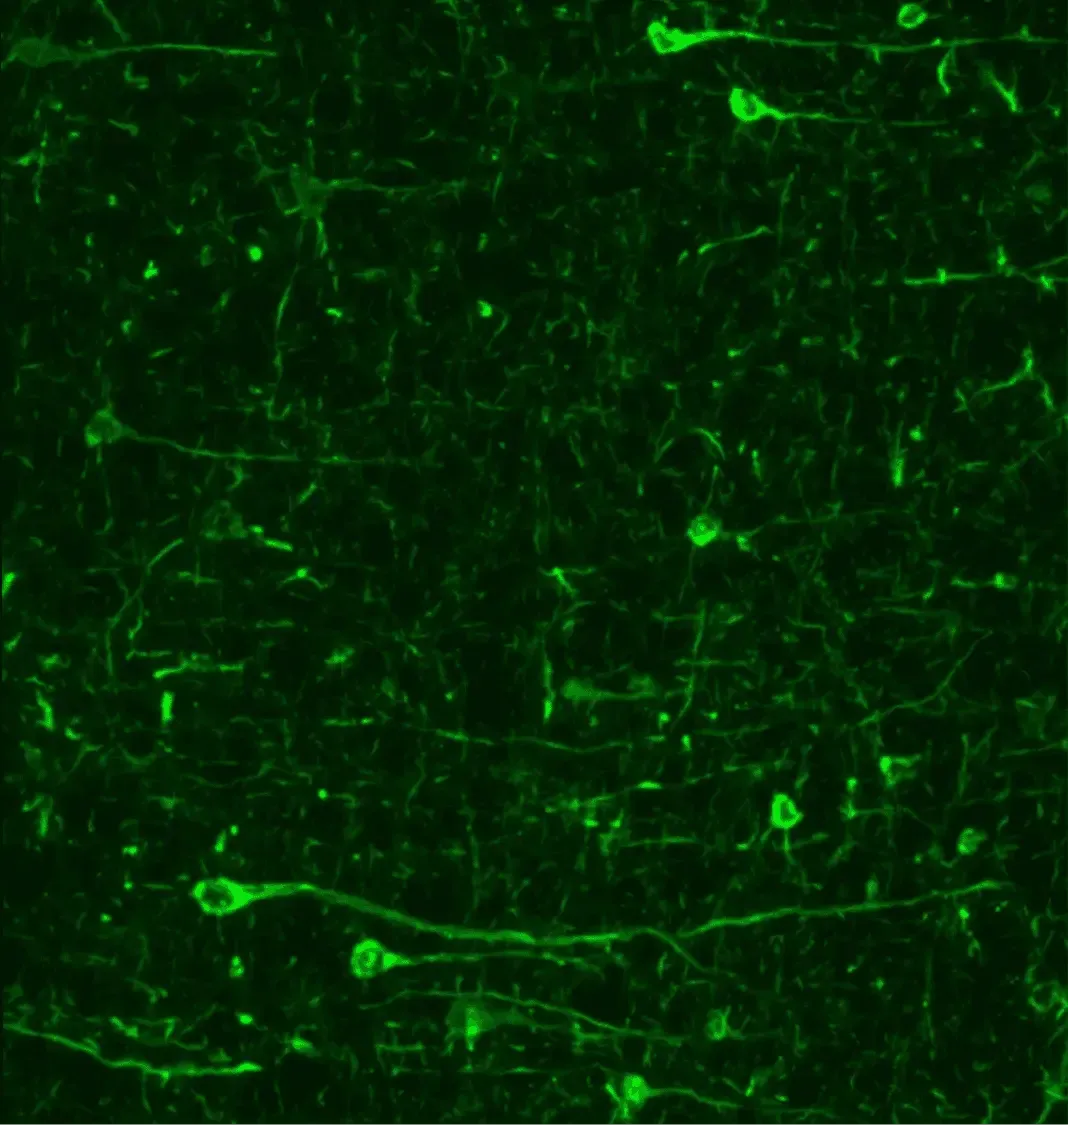
パーキンソン病動物モデルにおけるリン酸化シナプシン(pSyn129)の免疫蛍光染色により、神経細胞体および突起部における顕著な蓄積が明らかになりました。
α-シヌクレイン凝集体
変性したα-シヌクレインの凝集体は、ヒトのパーキンソン病における主要な病理学的特徴です。レビー小体およびレビー突起は、黒質緻密部内のドーパミン作動性ニューロンをはじめ、他の脳領域においても観察されます。この変性α-シヌクレイン病理は、特徴的な時空間的進行パターンを示します(Braak, 2003)。
当研究グループが開発したAAVおよびPFF誘導型パーキンソン病動物モデルにおいて、以下の所見が確認されています:
- 神経細胞体および突起における高レベルのリン酸化α-シヌクレイン
- PFFモデルにおける病理の強力な種形成と拡散
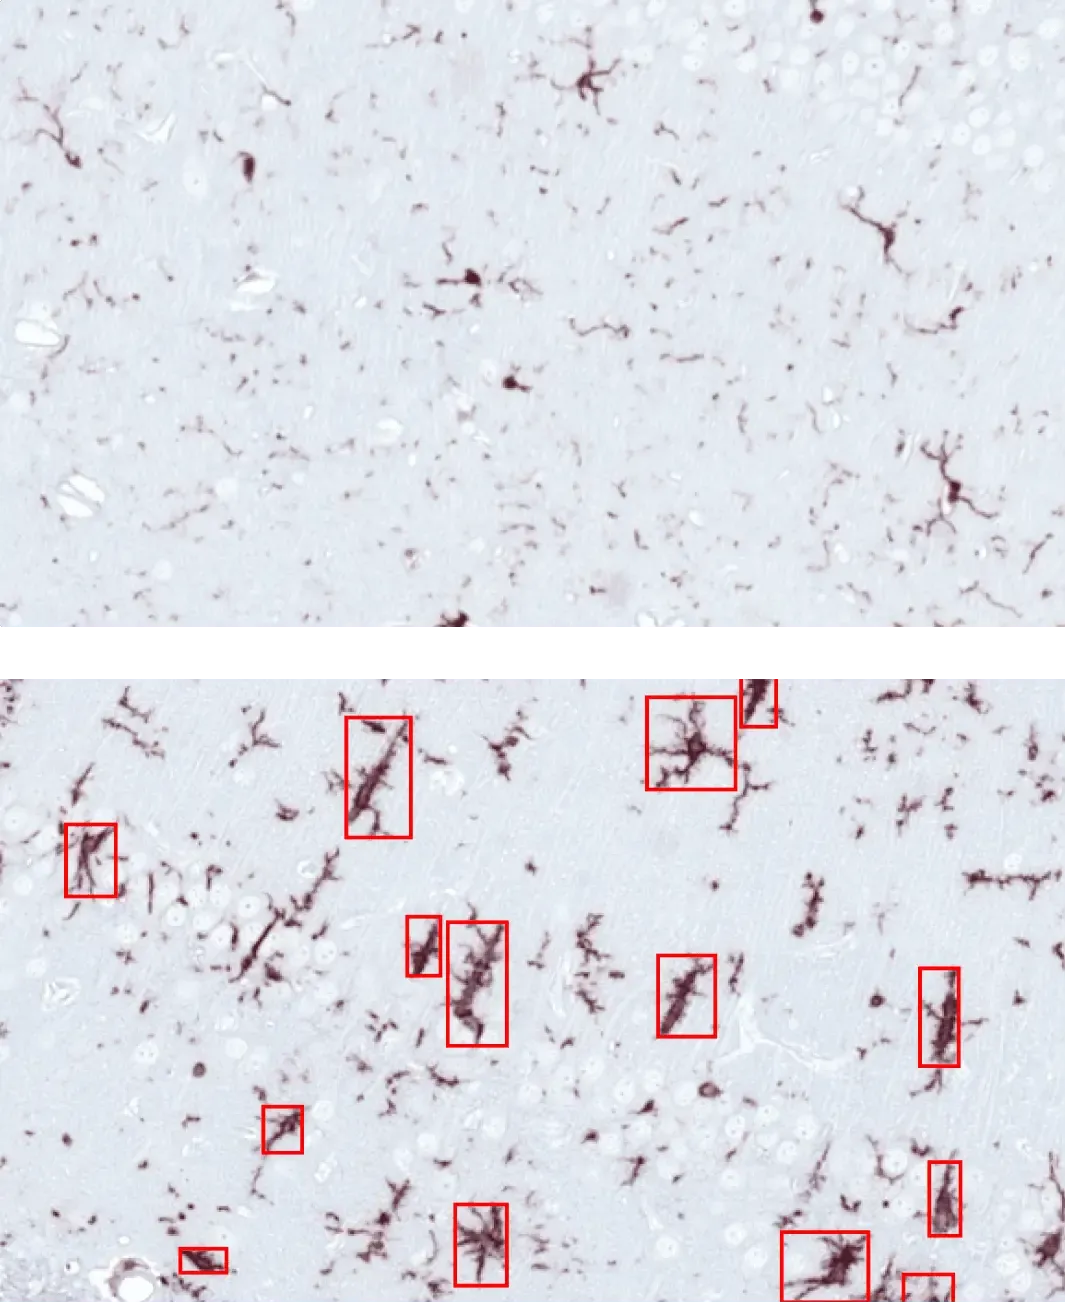
AONにPBS(上)またはα-シヌクレインPFF(下)を注入したマウスの海馬における活性化ミクログリア(赤枠)。
活性化ミクログリアと反応性アストロサイト
神経炎症はパーキンソン病の主要な病理学的特徴であり、活性化ミクログリアと反応性アストロサイトがその病態形成において重要な役割を果たしています(Kam, 2020;Chen, 2023)。
当研究グループが開発したAAVおよびPFF誘導型パーキンソン病マウスモデルにおいて、以下の所見が確認されました:
- 神経炎症反応の明確な時空間パターン
- 自社開発のコンピュータビジョン、機械学習、 深層学習アルゴリズムを用いて検出された、ミクログリアおよびアストロサイトの形態変化
神経炎症イニシアチブ:ミクログリア、アストロサイト、神経変性疾患
当研究チームのイノベーション:パーキンソン病α-シヌクレインマウスモデルにおけるミクログリア活性化
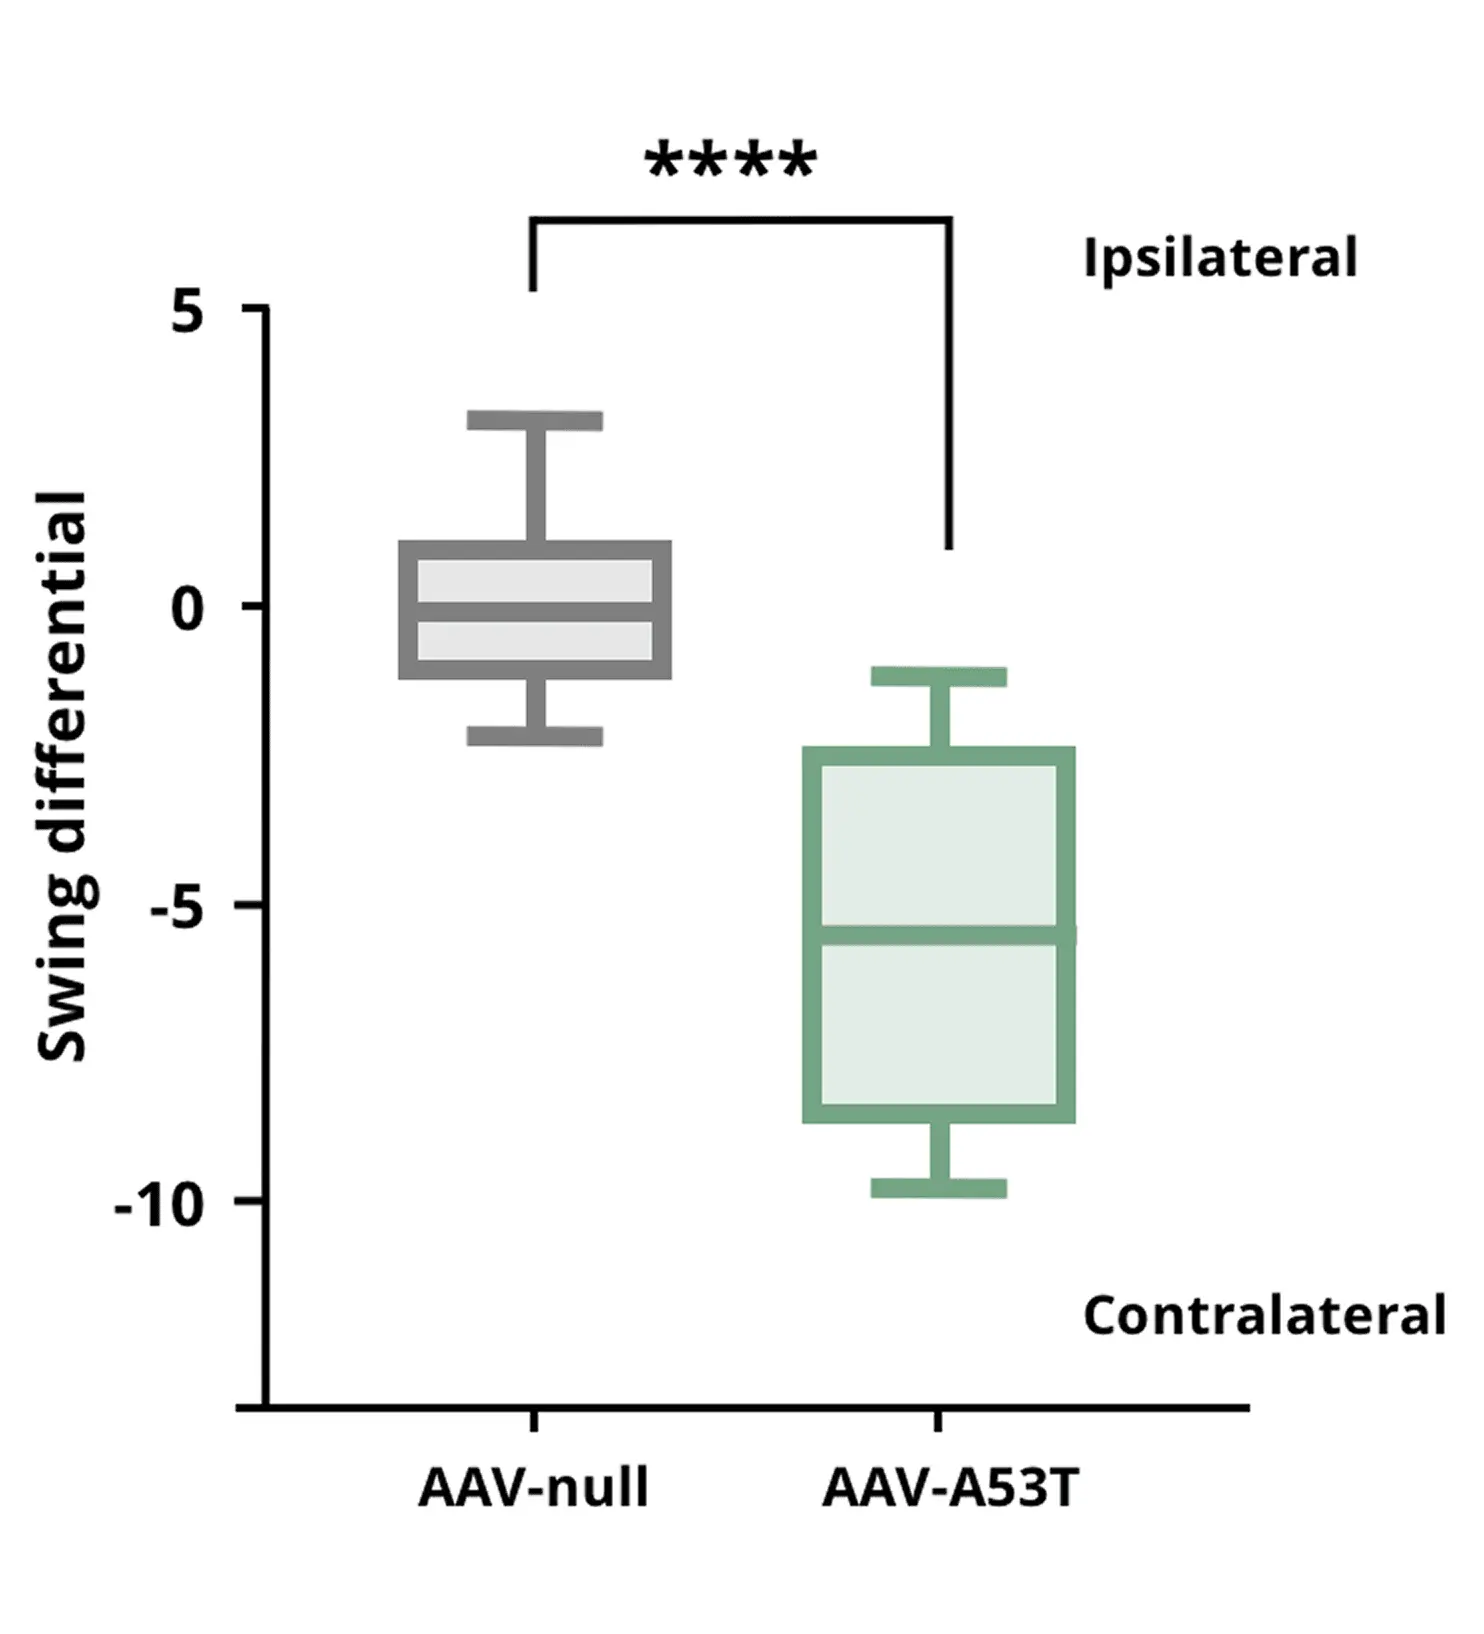
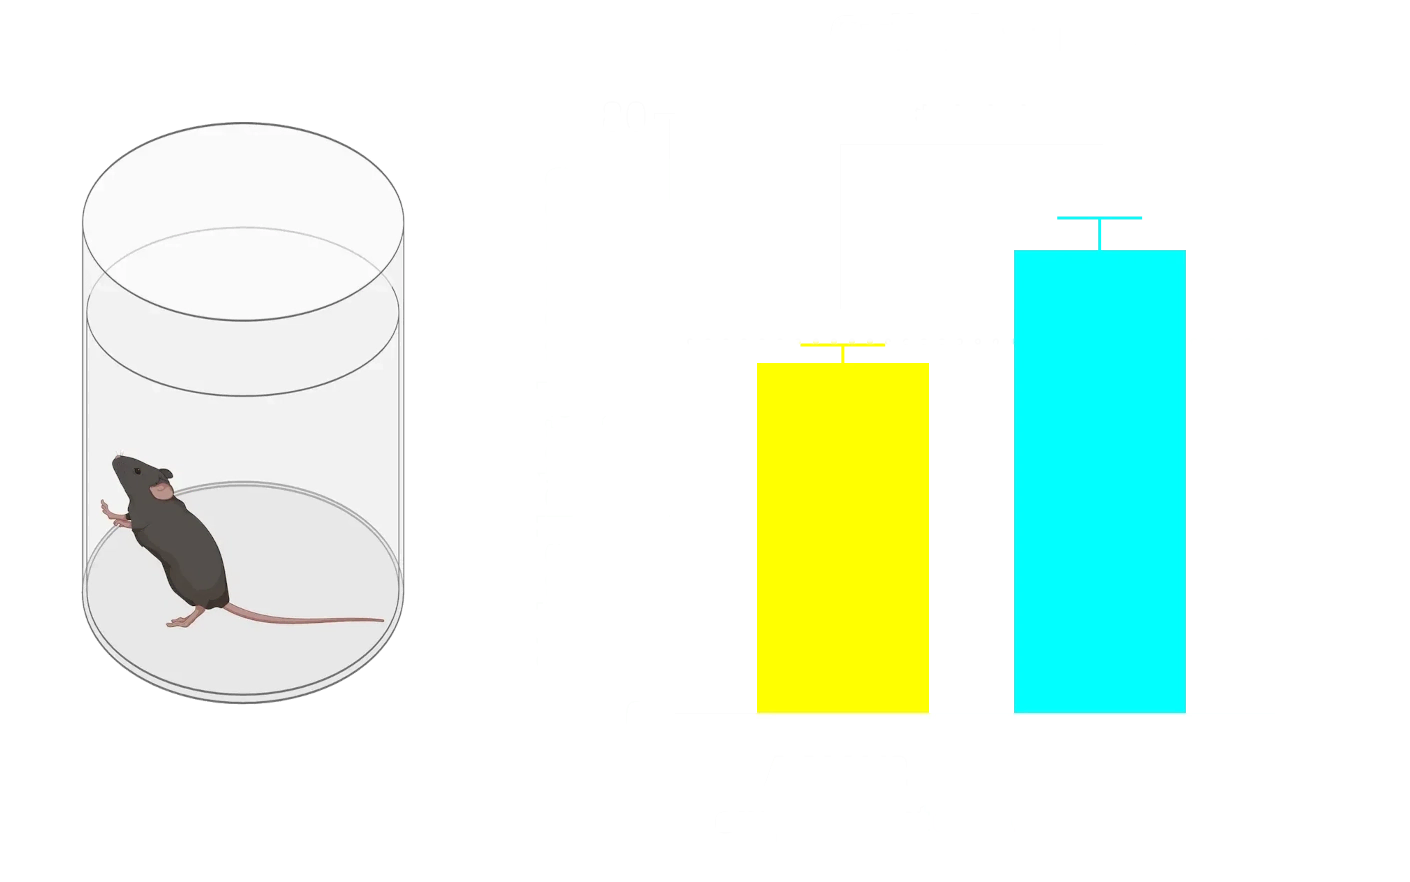
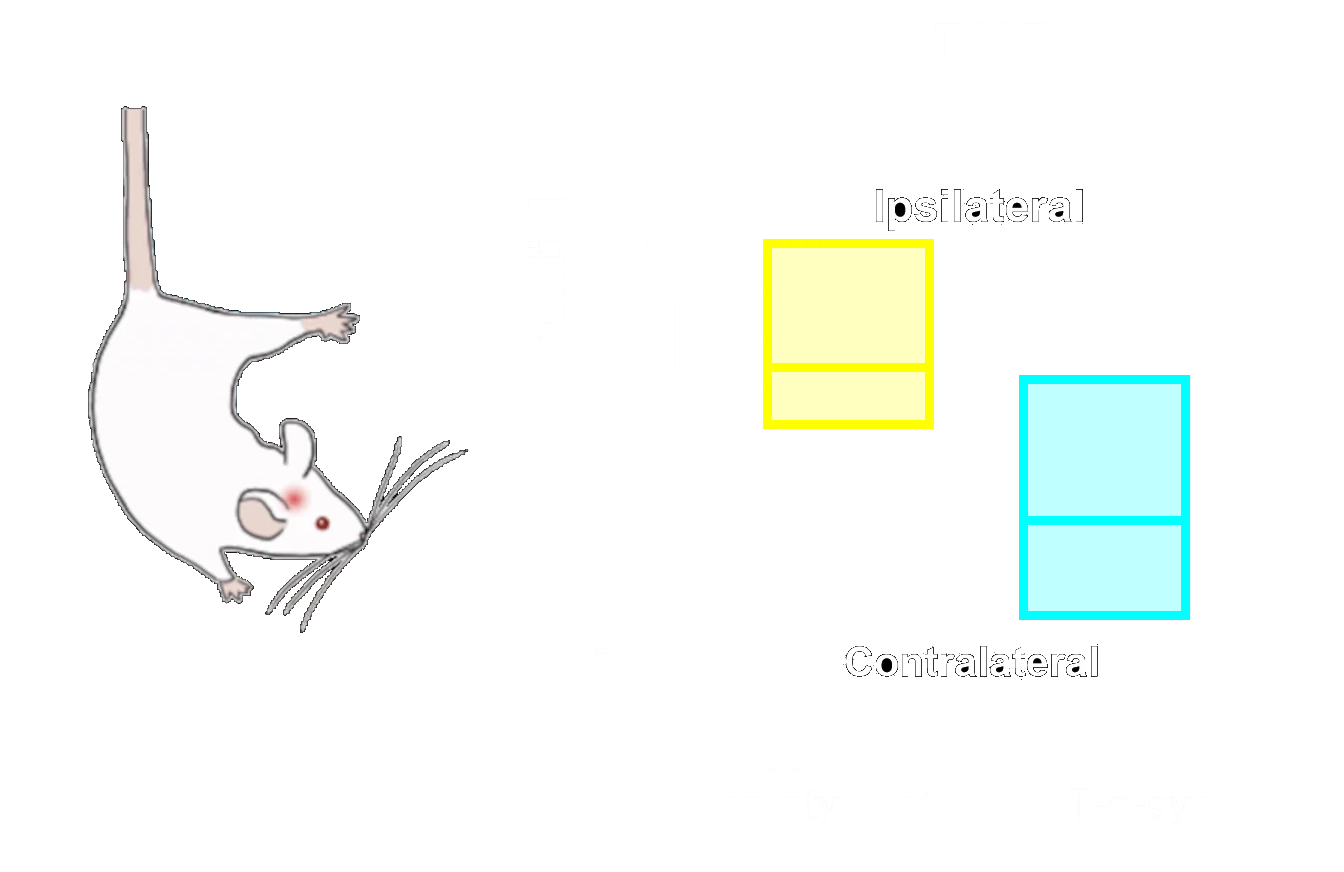
尾部懸垂スイング試験の結果、AAV-A53T α-synマウスは片側性ドーパミン作動性神経障害により、AAV非発現対照マウスと比較して対側方向へのスイングが増加することが示されました。
**** p<0.0001。
ドーパミン作動性ニューロンの喪失と運動障害
錐体外路運動症状はパーキンソン病の特徴であり、主に黒質緻密部(SNc)におけるドーパミン作動性ニューロンの喪失および線条体(例:尾状核および 被殻)の脱神経によって引き起こされます。
当研究グループのパーキンソン病モデルでは、以下のいずれかの方法でSNcを標的とし病態を誘導しております:
- α-シヌクレインを過剰発現させるAAV(アデノ随伴ウイルス)
- α-シヌクレイン既成線維(PFF)
これらの介入により、以下の結果が生じます:
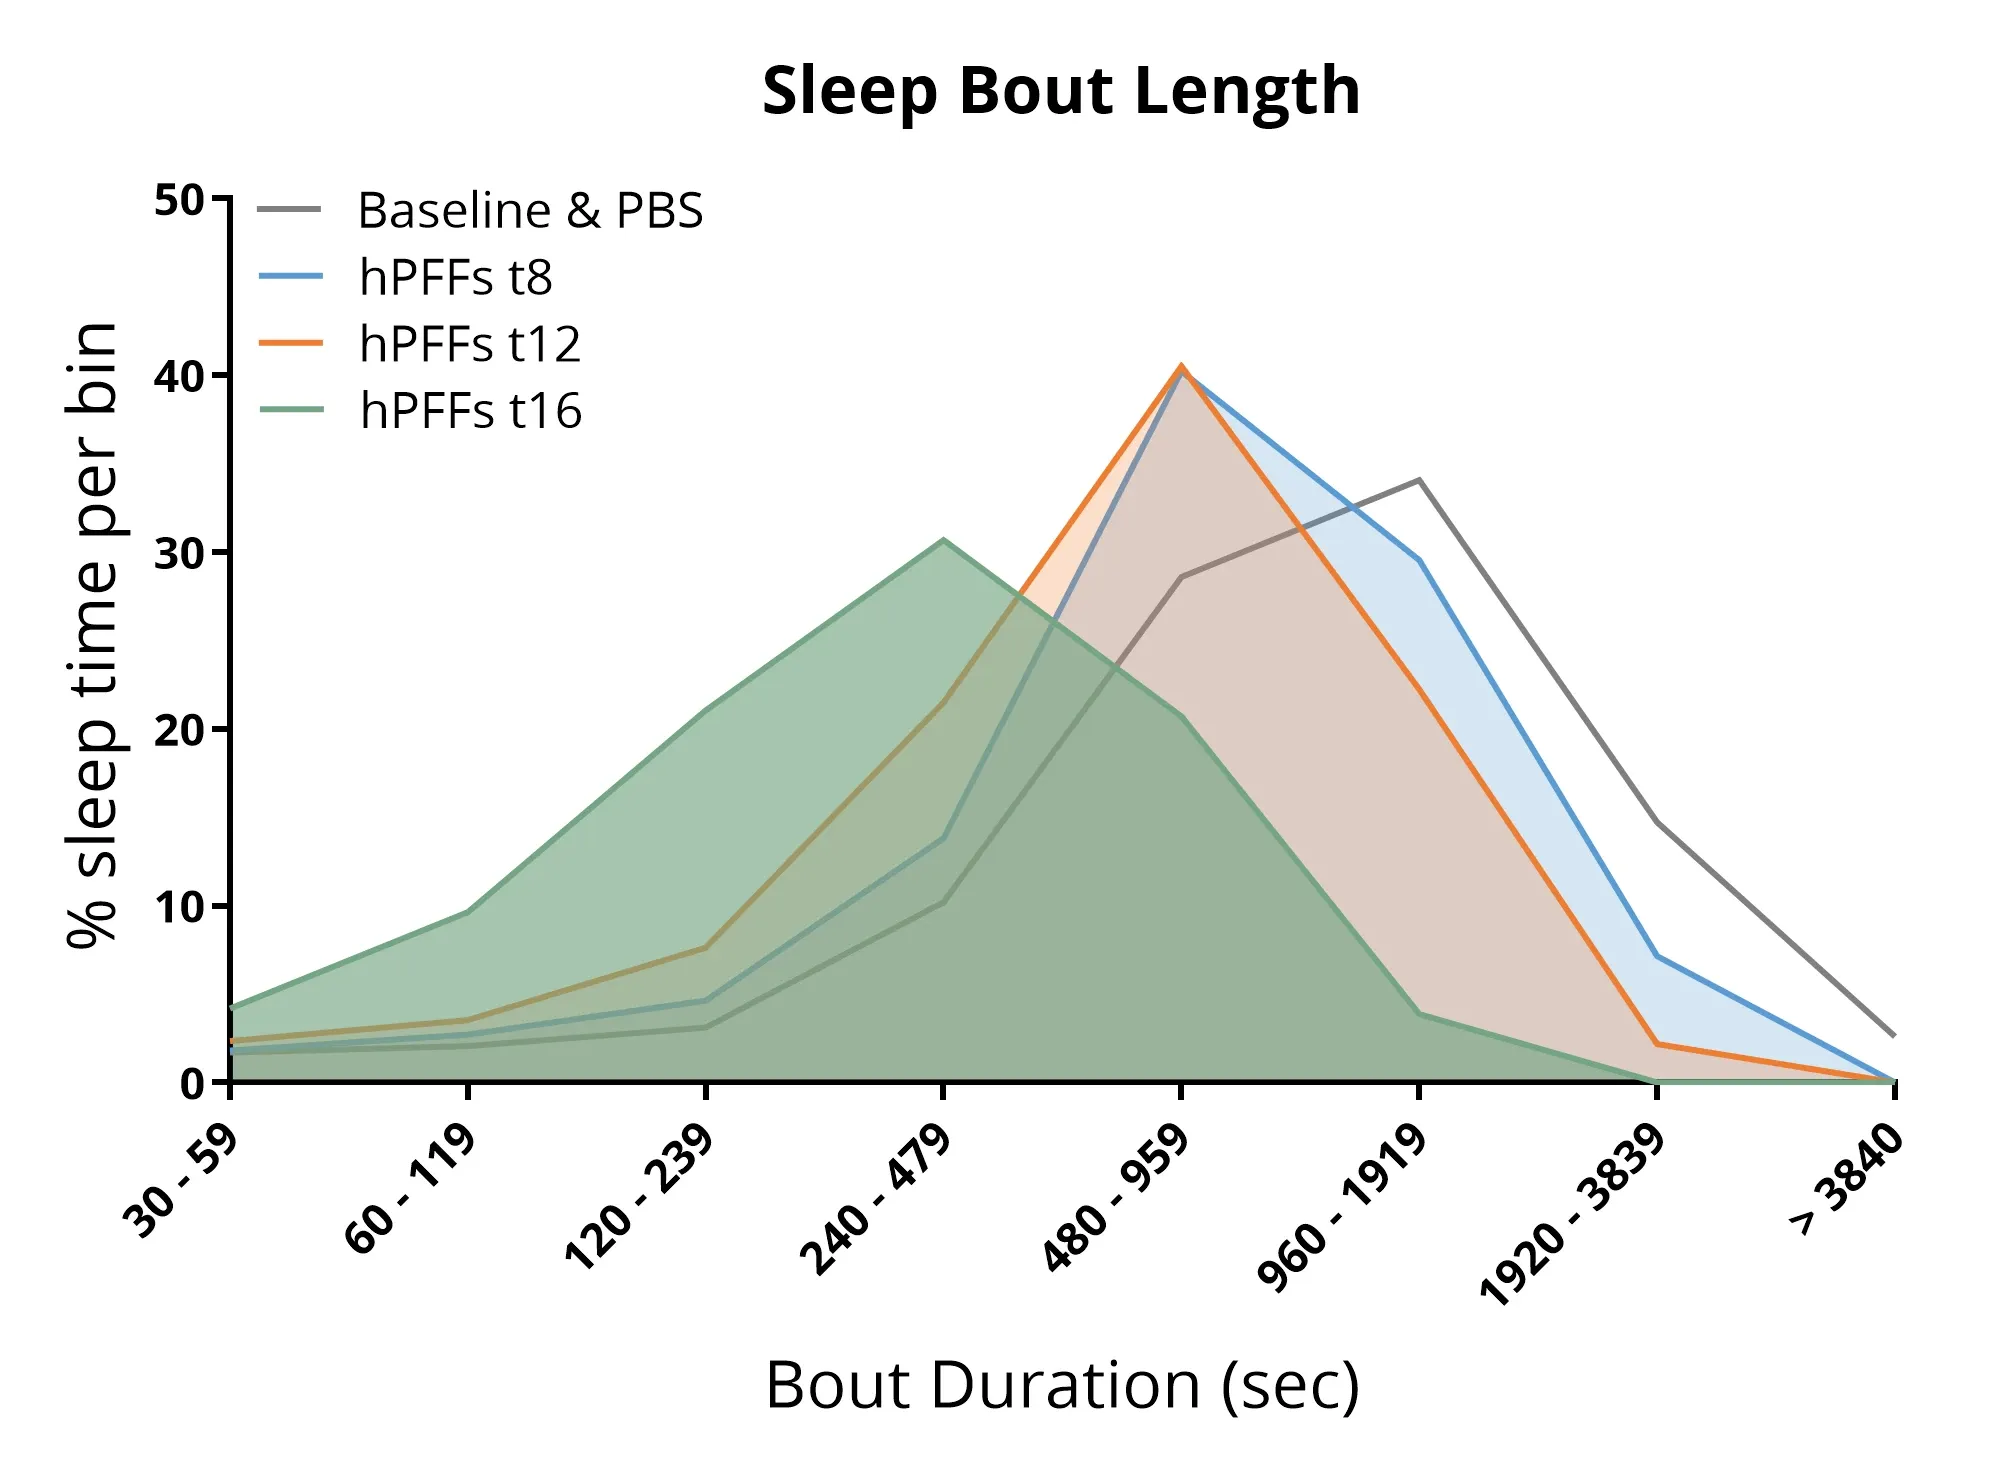
α-シヌクレインプリプリフォールドフィラメント(α-syn PFFs)をAON(腹側被蓋野)に注入したマウスにおいて、睡眠構造の乱れが認められました。具体的には、睡眠エピソードの長さの短縮および総睡眠時間の減少が観察されました。
睡眠障害
睡眠障害は、パーキンソン病における最も一般的な非運動症状の一つであり、患者の最大約85%に影響を及ぼします(Stefani, 2020;Asadpoordezaki, 2025)。
パーキンソン病マウスモデルにおいて非侵襲的睡眠モニタリングシステムを用いた結果、以下のことが明らかになりました:
- A53T トランスジェニックマウスのAON領域へのα-シヌクレインPFF注入により、以下の変化が生じます:
- 睡眠・覚醒構造 の変化
- 総睡眠 時間の割合 の変化
- 睡眠ブロックの長さの乱れ
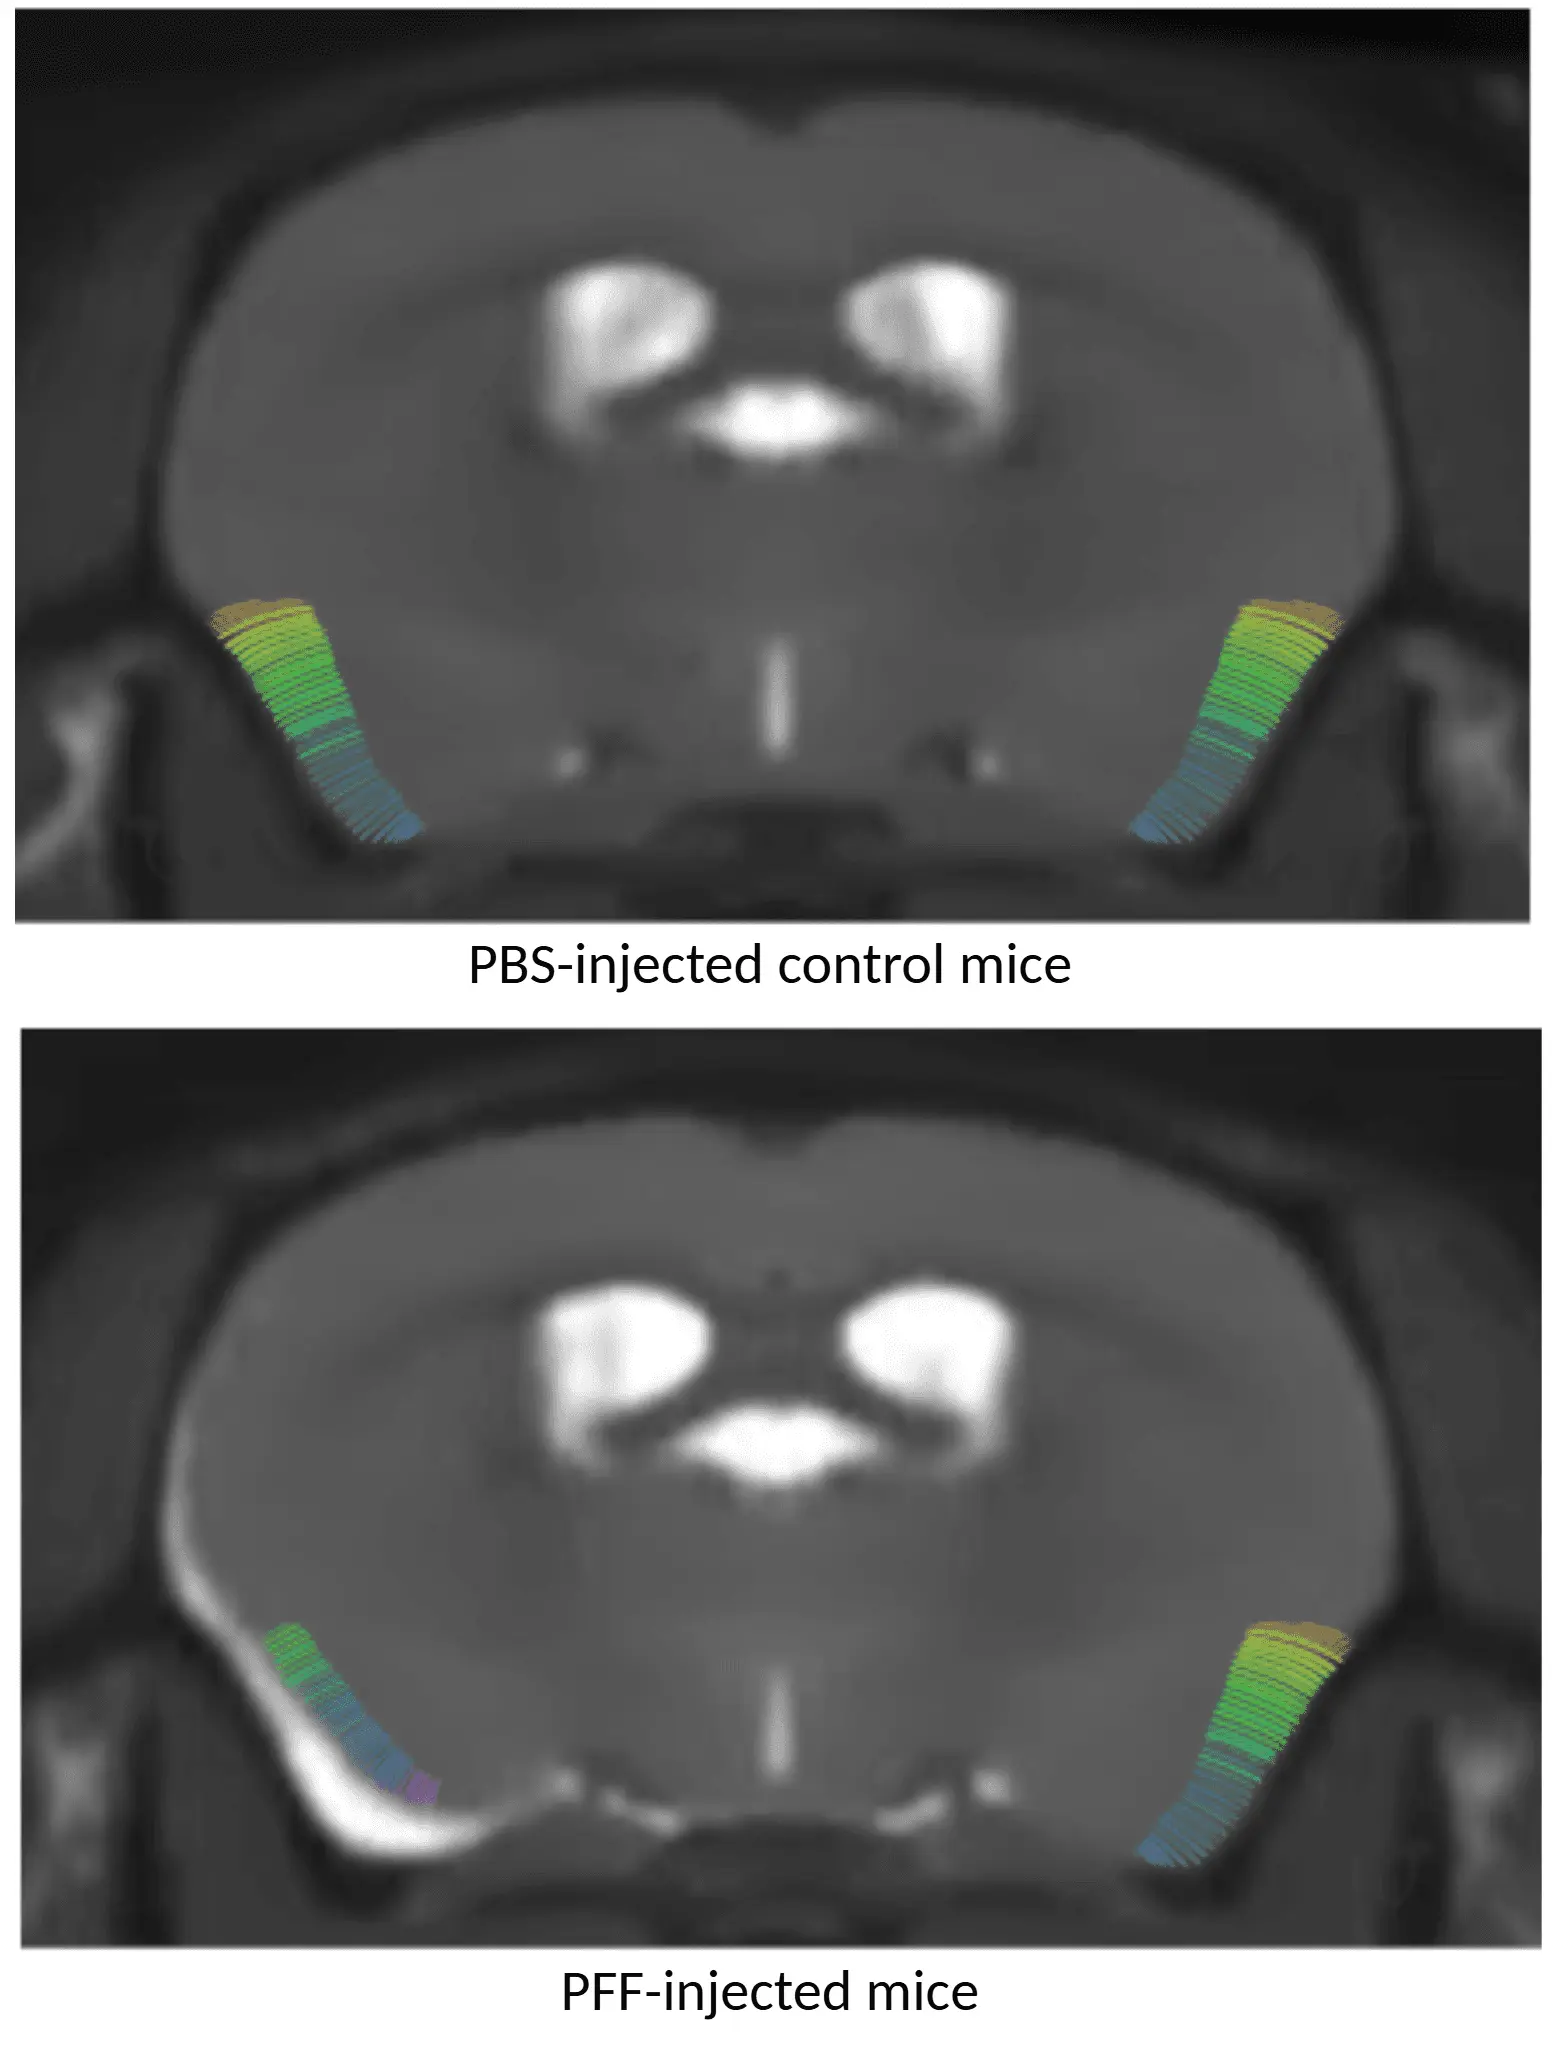
PBSを投与したマウス(上)とAON α-syn PFFを投与したマウス(下)のMRI皮質厚マップを示します。PFF処理を受けた個体では皮質の薄化が認められます。
局所的な脳萎縮
パーキンソン病の臨床試験では、マルチモダリティ脳画像バイオマーカーが広く活用されております。MRIに基づく局所神経解剖学的体積および皮質厚の測定値は、パーキンソン病における脳萎縮の感度が高い指標となっております(Tremblay, 2021;Abdelgawad, 2023)。
全脳高解像度解剖学的MRI撮影と高度な完全自動画像処理・解析を組み合わせることで、我々は以下のことを実証しました:
- AAVおよびPFF誘導パーキンソン病マウス双方において再現性のある局所的な脳萎縮
当社のイノベーションをご覧ください:神経変性疾患マウスモデルにおける脳萎縮解析
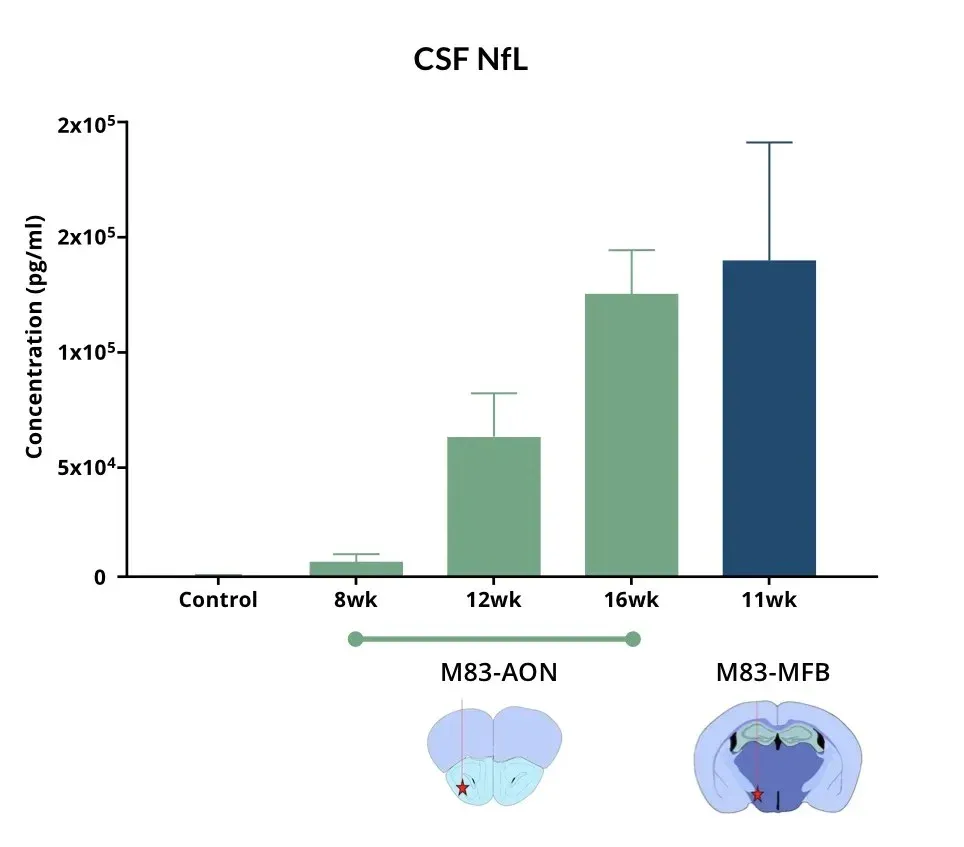
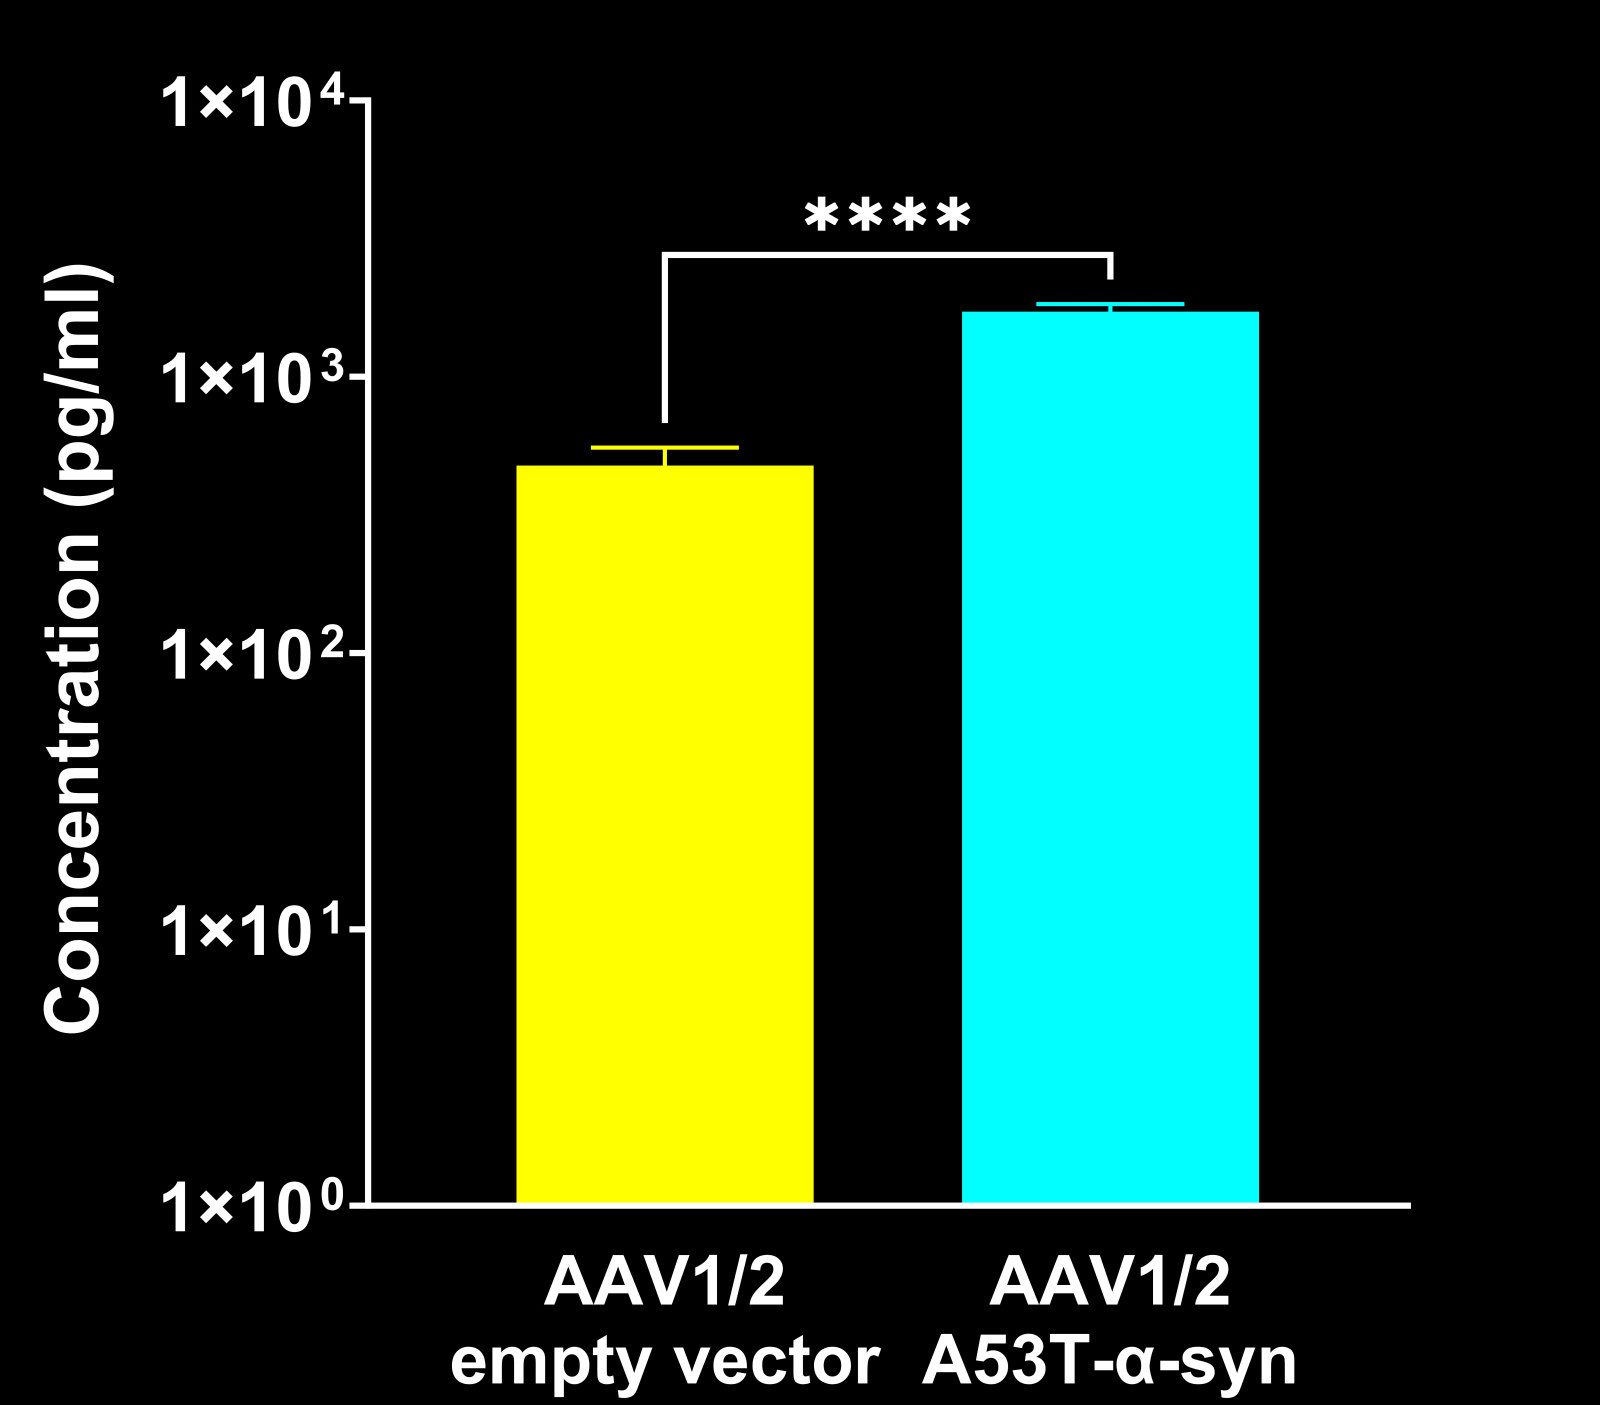
α-Syn PFFを注入したマウスでは、AONおよびMFBにおいて、対照群と比較して脳脊髄液中のNF-Lレベルが上昇しています。
脳脊髄液および血漿中の神経フィラメント軽鎖の上昇
パーキンソン病(PD)患者の脳脊髄液(CSF)および血漿中では、ニューロフィラメント軽鎖(NF-L)が上昇しており、PD臨床試験において体液バイオマーカーとして日常的に使用されています(Bäckström, 2020;Urso, 2023;Pedersen, 2024)。また、複数のPD前臨床モデルにおいてもNF-Lレベルの上昇が報告されています。
当研究グループのパーキンソン病マウスモデルでは、以下の所見が確認されています:
- ヒトα-シヌクレインのPFFを以下の部位に投与したM83+/-トランスジェニックマウスにおいて、血漿および脳脊髄液中のNF-Lが著しく増加しました:
- 前嗅核(AON)
- 内側前脳束(MFB)
詳細は当リソースをご参照ください:パーキンソン病モデルにおけるニューロフィラメント軽鎖
パーキンソン病(PFF)およびα-シヌクレイン発現アデノ随性ウイルス(AAV)げっ歯類モデルの病理学的・表現型プロファイルとは何でしょうか?
下記の表は、各モデルがヒトのパーキンソン病の特徴をどの程度再現しているかをまとめたものです。これにより、特定の研究課題に対する各モデルの関連性を迅速に比較することが可能となります。
病理
本表では、α-シヌクレイン凝集、神経炎症、ドーパミン作動性ニューロンの喪失など、パーキンソン病に関連する主要な病理学的特徴を概説し、PFFおよびAAV誘導マウスモデルにおいてそれらがどの程度確実に現れるかを比較しております。
| 特徴/領域 | PFFモデル | AAVモデル |
|
✔️ |
✔️ | |
|
✔️ |
✔️ | |
|
✔️ |
✔️ |
機能的特徴
本表は、運動障害や睡眠覚醒障害など、パーキンソン病の病理に関連する行動学的・生理学的障害を比較し、マウスモデル間の差異を明らかにするものです。
バイオマーカー
本表は、疾患進行に関連する非侵襲的イメージングおよび体液ベースのバイオマーカーをまとめたものです。これらのバイオマーカーは、PFFおよびAAV誘導性動物モデルにおいて、神経変性の評価および治療効果の評価のための定量的エンドポイントを提供します。
|
特徴/領域 |
PFFモデル |
AAVモデル |
|
✔️ |
✔️ | |
|
✔️ |
✔️ |
要約:PFFモデルとAAVα-シヌクレインモデルの両方において、顕著なα-シヌクレイン病理が認められます。PFFモデルでは特徴的なシード形成と拡散の時間的・空間的パターンが観察されます。両モデルで神経炎症反応が確認されますが、ドーパミン作動性ニューロンの喪失はAAVモデルにおいて一般的により重篤で、局所的に選択的です。 運動障害は両モデルで発生しますが、AAVモデルではより早期に、かつより大きな程度で現れます。また、AAVモデルにおける睡眠関連表現型はまだ評価されていません。MRIに基づく脳萎縮とNF-Lの上昇は、両マウスモデルにおいて神経変性の臨床転移性バイオマーカーとして機能します。
パーキンソン病マウスモデルの特徴は何でしょうか?
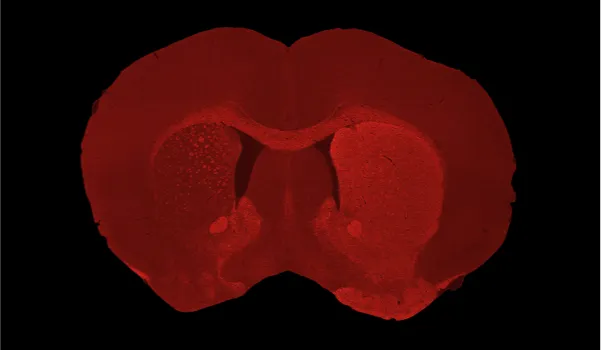
下記の「画像インタラクティブ」では、AAV-A53T-Synucleinマウスモデルの特徴解析について、生体内データやマルチプレックス免疫蛍光組織切片の高解像度画像を含め、ご覧いただけます。
左側のパネルから「画像ストーリー」を簡単にご覧いただけます。
高解像度顕微鏡画像は、マウスの左ボタンでパン操作が可能です。ズームイン・ズームアウトは、 マウス/トラックパッド(上下)または左上隅の「+」ボタンと「-」ボタンで操作 いただけます。右上隅のコントロールパネルでは 、各チャンネルやセグメンテーションの画像設定のオン/オフ切り替え、色変更、調整が可能です。
最適なインタラクティブ体験 のため、フルスクリーンモード でのご利用をお勧めいたします。


Characterization of our AAV-A53T-Synuclein mouse model, including in vivo data and high-resolution images of entire Multiplex Immunofluorescence tissue sections.
Share link to
 Click to copy link
パーキンソン病動物モデル概要:PFFモデルとAAVα-シヌクレインモデルの比較
PFFモデルとAAVα-シヌクレインげっ歯類モデルは、パーキンソン病のメカニズム解明と治療戦略評価において、相互に補完的な研究基盤を提供します。両モデルとも、強力なα-シヌクレイン凝集や測定可能な神経炎症など、本疾患の中核的病理特徴を再現しますが、主要な表現型の発現と進行には差異があります。 PFFモデルは病理の種形成と拡散を研究する強力な枠組みを提供します。一方、AAVモデルはより顕著で局所的に選択的なドーパミン作動性ニューロンの喪失を示し、より早期かつ重度の運動障害を伴います。睡眠関連表現型はAAVモデルでは未評価ですが、両モデルとも神経変性のトランスレーショナルバイオマーカーとして、MRIに基づく脳萎縮と生体液中のNF-Lレベルの利用を支持しています。 これらのモデルを総合的に活用することで、多様な実験目的においてパーキンソン病関連経路と治療効果を包括的に評価することが可能となります。
当社のパーキンソン病マウスモデルの特性評価、検証済み測定法、ならびに前臨床神経科学CROサービスについて、詳細をご覧ください。
関連コンテンツ
パーキンソン病に関する最新情報ならびにパーキンソン病動物モデルにおける治療薬評価に関連する最善の実践方法について。
プリフォームド・フィブリル - 細胞および動物モデルに関するガイド
複数の神経変性疾患における疾患修飾療法の非臨床試験のための、既成フィブリル誘導細胞モデルおよび動物モデルの概要
パーキンソン病におけるミクログリア、アストロサイト、およびα-シヌクレイン
α-シヌクレインがパーキンソン病およびその他のシヌクレイン病においてミクログリアおよびアストロサイトに及ぼす影響。
パーキンソン病治療薬開発のためのAAV α-シヌクレインモデル
疾患修飾治療薬の前臨床研究に使用するマウスおよびラットモデルにおけるアデノ随伴ウイルス(AAV)によるα-シヌクレイン発現の概要。
パーキンソン病モデルにおけるニューロフィラメント軽鎖
神経フィラメント軽鎖(NfL;NF-L)レベルが、パーキンソン病のマウスおよびラットモデルにおける血液(血漿;血清)およびCSFバイオマーカーとして使用できる方法。
ミトファジーとパーキンソン病
障害のあるミトファジーがパーキンソン病における神経変性につながる仕組みの概要。
オートファジー、パーキンソン病、ドーパミン作動性ニューロン
パーキンソン病における障害のあるオートファジーが、ドーパミン作動性ニューロンにおける病理学的変化と神経変性につながる仕組みの概要。
ミトコンドリア機能障害とパーキンソン病
パーキンソン病におけるミトコンドリア機能障害が神経変性と関連する仕組みの概要。