AAV-Tau(AAV-Tau蛋白病)模型概述
对于这种进行性核上性麻痹和皮质基底变性模型,我们会在约2-3个月大的C57BL/6小鼠的黑质中单侧立体定向接种过表达野生型人类tau蛋白(MAPT)的AAV。这种小鼠模型可复制人类tau蛋白病的一些关键特征,包括
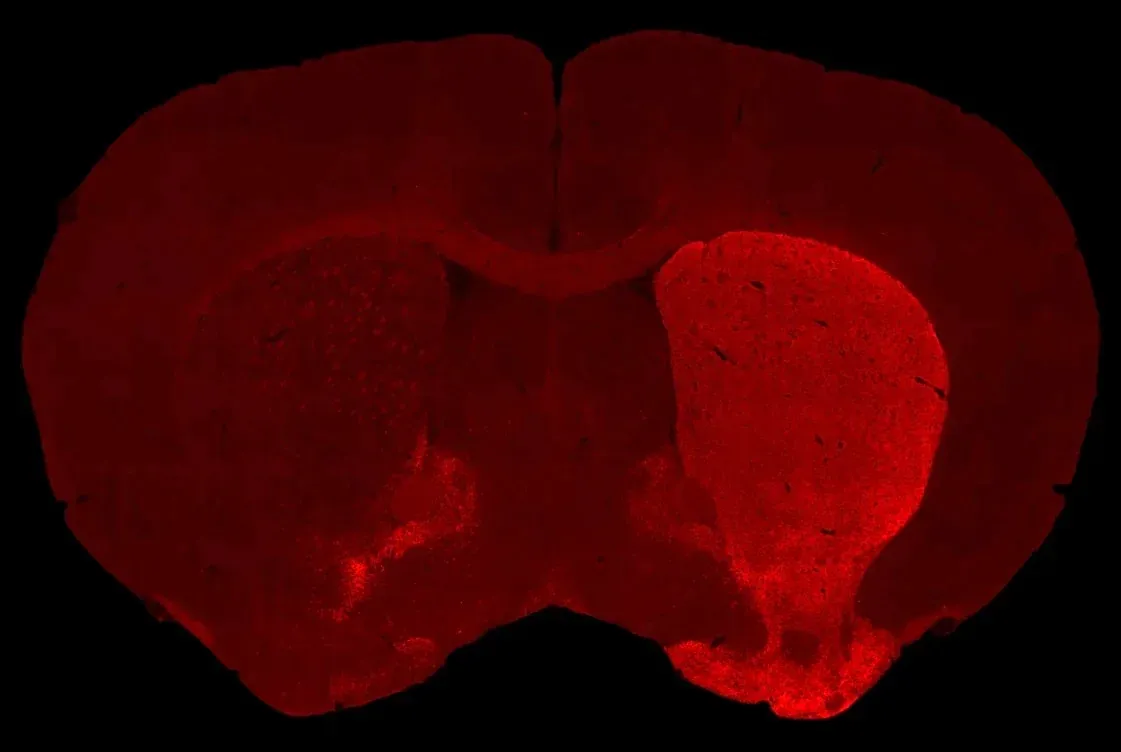
- 黑质致密部多巴胺能神经元减少
- 同侧纹状体多巴胺能神经元脱神经
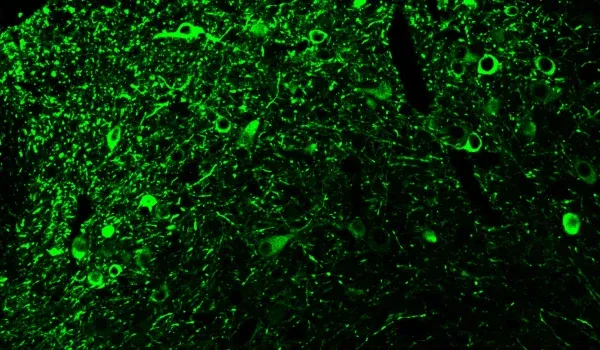
- 细胞体和神经突起的磷酸化tau聚集
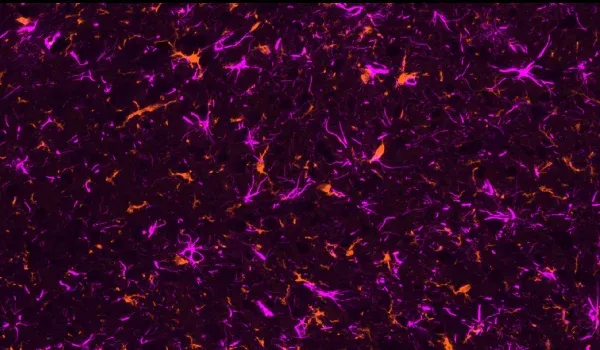
- 活化的微胶质细胞
- 反应性星形胶质细胞
- 运动功能障碍
- 通过活体核磁共振扫描测量的大脑萎缩(黑质、中脑、尾状核-壳核)
AAV-Tau模型生成
模型生成的一般方案是:
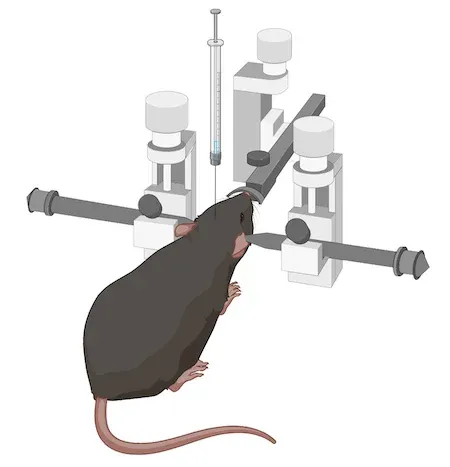
对于这种特定模型,我们使用8-12周龄的C57BL/6小鼠。然后,我们将AAV载体立体定向注射到黑质附近。我们使用带有自动微量注射器的数字立体定向设备,以实现高精度和精确度。
使用该模型的研究可以迅速启动。研究的体内阶段通常持续约6周。因此,可以在相对较短的时间内提供读数,尤其是与阿尔茨海默病和tau蛋白病变的传统tau转基因模型相比。
模型特征
Email
点击复制链接
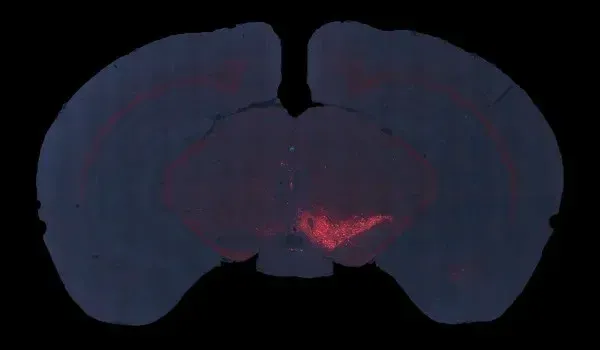
下面的交互式演示可让您了解我们对AAV-Tau小鼠模型的表征,包括体内数据和整个多重免疫荧光组织切片的高分辨率图像。
您只需使用左侧面板浏览“图像故事”即可。
您可以使用鼠标左键在高清显微镜图像中平移。您可以使用 鼠标/触控板(上/下)或左上角的+和-按钮放大和缩小 。您可以在右上角的控制面板中 切换(开/关)、更改颜色以及调整通道和分割的图像设置。
我们建议使用 全屏模式,以获得 最佳交互体验。
了解更多关于我们AAV-Tau小鼠模型的表征、我们经过验证的措施以及我们的临床前神经科学合同研究组织服务。
探索更多我们的tau病模型
相关内容
关于阿尔茨海默氏症和Tau蛋白病以及转化生物标记物在动物模型中治疗剂评估的最佳实践的最新信息。
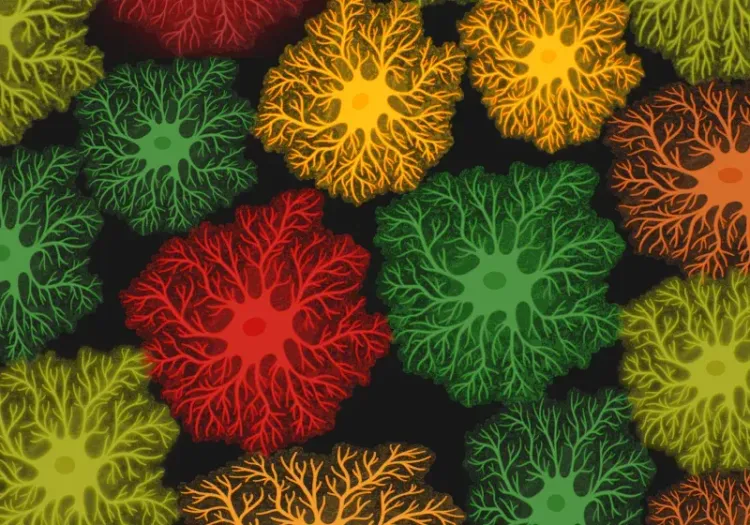
阿尔茨海默病中的星形细胞形态
星形胶质细胞形态学分析概述及其在神经退行性疾病研究和药物研发中的应用。
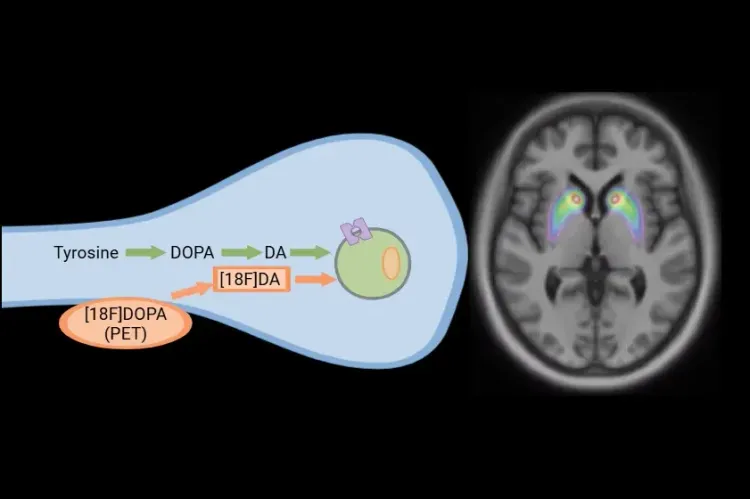
帕金森病临床试验中的[18F]多巴胺PET
在帕金森病和运动障碍临床试验中,如何利用[18F]DOPA PET监测疾病进展和治疗干预反应。